RD-PivotLines_v1
Download script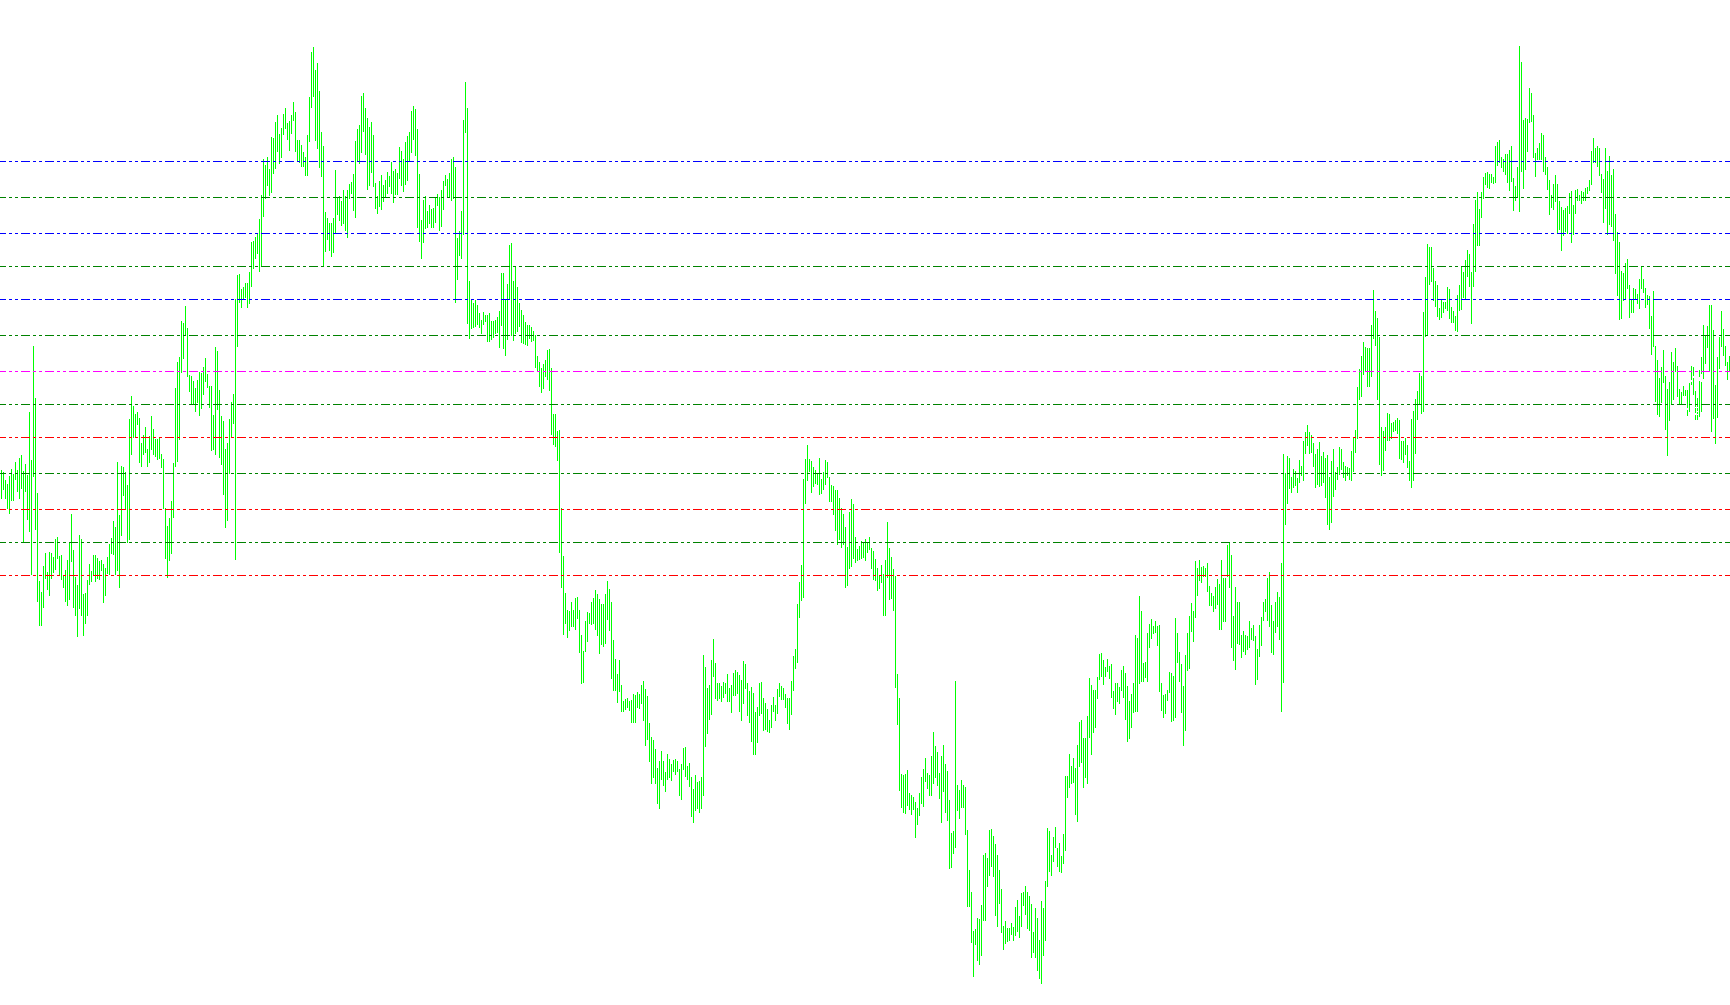
This script is a technical analysis tool designed for the MetaTrader platform to automate the plotting of several key price levels on a trading chart. Its primary purpose is to provide traders with visual "roadmaps" based on historical price action, helping them identify potential areas of support and resistance.
Core Functionality
The logic operates by analyzing daily price data from the previous trading session. It automatically retrieves four specific pieces of information from yesterday’s performance: the High, Low, Open, and Close prices. Using these figures, the script calculates a series of different technical levels that are displayed directly on your current chart.
Technical Components Explained
The tool provides three distinct types of analytical layers, which can be toggled on or off independently:
1. Standard Pivot Points This is the foundational layer of the script. It calculates the "Pivot" (the central balance point) and identifies three Resistance levels (R1, R2, R3) and three Support levels (S1, S2, S3). These levels help traders anticipate where the price might stall or reverse during the current trading day based on where it moved yesterday.
2. Camarilla Levels This is an optional secondary layer. It calculates specific "Breakout" levels (H3, H4 and L3, L4) using a unique formula involving the previous day's range. These are often used by traders to identify prices that, if breached, could signal a significant trend change or a continuation of a strong move.
3. Midpoint Pivots This layer adds high-granularity detail to the chart. It calculates various "Midpoints" (M0 through M5) between the primary pivot and support/resistance levels. This allows for a more nuanced view of the market, identifying smaller sub-zones where price might pause or consolidate before making a larger move.
User Experience & Visuals
- Dynamic Updates: The script automatically recalculates these values as new daily data becomes available.
- Automated Charting: Instead of requiring manual entry, the script draws horizontal dashed lines and labels directly on your workspace.
- Color Coding: Different categories are assigned specific colors (e.g., Blue for Resistance, Red for Support, Yellow for Camarilla, and Green for Midpoints) to ensure the chart remains easy to read at a glance.
- On-Screen Summary: The script displays a real-time text summary in the corner of the chart, showing you yesterday’s high/low, today's current range, and the closing price of the previous day.
- Safety Check: The script includes a built-in verification to ensure it is running on a timeframe appropriate for daily analysis (checking that the chart isn't set to a period longer than one day).
//+------------------------------------------------------------------+
//|                                                        Pivot.mq4 |
//|                      Copyright © 2004, MetaQuotes Software Corp. |
//|                                        http://www.metaquotes.net |
//+------------------------------------------------------------------+
#property copyright "Copyright © 2004, MetaQuotes Software Corp."
#property link      "http://www.metaquotes.net"

#property indicator_chart_window

extern bool pivots = true;
extern bool camarilla = False;
extern bool midpivots = true;

double day_high=0;
double day_low=0;
double yesterday_high=0;
double yesterday_open=0;
double yesterday_low=0;
double yesterday_close=0;
double today_open=0;
double today_high=0;
double today_low=0;
double P=0;
double Q=0;
double R1,R2,R3;
double M0,M1,M2,M3,M4,M5;
double S1,S2,S3;
double H4,H3,L4,L3;
double nQ=0;
double nD=0;
double D=0;
double rates_d1[2][6];

//+------------------------------------------------------------------+
//| Custom indicator initialization function                         |
//+------------------------------------------------------------------+
int init()
{
   //---- indicators
    R1=0; R2=0; R3=0;
    M0=0; M1=0; M2=0; M3=0; M4=0; M5=0;
    S1=0; S2=0; S3=0;
    H4=0; H3=0; L4=0; L3=0;

   //----
   return(0);
}


//+------------------------------------------------------------------+
//| Custor indicator deinitialization function                       |
//+------------------------------------------------------------------+
int deinit()
{
   ObjectDelete("R1 Label");
   ObjectDelete("R1 Line");
   ObjectDelete("R2 Label");
   ObjectDelete("R2 Line");
   ObjectDelete("R3 Label");
   ObjectDelete("R3 Line");
   ObjectDelete("S1 Label");
   ObjectDelete("S1 Line");
   ObjectDelete("S2 Label");
   ObjectDelete("S2 Line");
   ObjectDelete("S3 Label");
   ObjectDelete("S3 Line");
   ObjectDelete("P Label");
   ObjectDelete("P Line");
   ObjectDelete("H4 Label");
   ObjectDelete("H4 Line");
   ObjectDelete("H3 Label");
   ObjectDelete("H3 Line");
   ObjectDelete("L3 Label");
   ObjectDelete("L3 Line");
   ObjectDelete("L4 Label");
   ObjectDelete("L4 Line");
   ObjectDelete("M5 Label");
   ObjectDelete("M5 Line");
   ObjectDelete("M4 Label");
   ObjectDelete("M4 Line");
   ObjectDelete("M3 Label");
   ObjectDelete("M3 Line");
   ObjectDelete("M2 Label");
   ObjectDelete("M2 Line");
   ObjectDelete("M1 Label");
   ObjectDelete("M1 Line");
   ObjectDelete("M0 Label");
   ObjectDelete("M0 Line");

   return(0);
}

//+------------------------------------------------------------------+
//| Custom indicator iteration function                              |
//+------------------------------------------------------------------+
int start()
{
   //---- exit if period is greater than daily charts
   if(Period() > 1440)
   {
      Print("Error - Chart period is greater than 1 day.");
      return(-1); // then exit
   }

   //---- Get new daily prices

   ArrayCopyRates(rates_d1, Symbol(), PERIOD_D1);

   yesterday_close = rates_d1[1][4];
   yesterday_open = rates_d1[1][1];
   today_open = rates_d1[0][1];
   yesterday_high = rates_d1[1][3];
   yesterday_low = rates_d1[1][2];
   day_high = rates_d1[0][3];
   day_low = rates_d1[0][2];


   //---- Calculate Pivots

   D = (day_high - day_low);
   Q = (yesterday_high - yesterday_low);
   P = (yesterday_high + yesterday_low + yesterday_close) / 3;

   R1 = (2*P)-yesterday_low;
   S1 = (2*P)-yesterday_high;
   R2 = P+(yesterday_high - yesterday_low);
   S2 = P-(yesterday_high - yesterday_low);

	H4 = (Q*0.55)+yesterday_close;
	H3 = (Q*0.27)+yesterday_close;
	R3 = (2*P)+(yesterday_high-(2*yesterday_low));
	M5 = (R2+R3)/2;
//	R2 = P-S1+R1;
	M4 = (R1+R2)/2;
//	R1 = (2*P)-yesterday_low;
	M3 = (P+R1)/2;
//	P = (yesterday_high + yesterday_low + yesterday_close)/3;
	M2 = (P+S1)/2;
//	S1 = (2*P)-yesterday_high;
	M1 = (S1+S2)/2;
//	S2 = P-R1+S1;
	S3 = (2*P)-((2* yesterday_high)-yesterday_low);
	L3 = yesterday_close-(Q*0.27);
	L4 = yesterday_close-(Q*0.55);
	M0 = (S2+S3)/2;

   if (Q > 5) { nQ = Q; }
   else { nQ = Q*10000; }

   if (D > 5) { nD = D; }
   else { nD = D*10000; }


   Comment("Yesterdays High= ",yesterday_high, "  Todays=  ",day_high, "    Previous Days Range= ",nQ,"\n",
           "Yesterdays Low=  ",yesterday_low,  "  Todays=  ",day_low,  "    Current Days Range= ",nD,"\n",
           "Close= ",yesterday_close, "    Good Morning, Good Luck Trading RICKY Ds System!");

   //---- Set line labels on chart window

   //---- Pivot Lines
   if (pivots==true) {
      SetLevel("R1", R1, Blue);
      SetLevel("R2", R2, Blue);
      SetLevel("R3", R3, Blue);

      SetLevel("Pivot", P, Magenta);

      SetLevel("S1", S1, Red);
      SetLevel("S2", S2, Red);
      SetLevel("S3", S3, Red);
   }


   //----- Camarilla Lines
   if (camarilla==true) {
      SetLevel("H3", H3, Yellow);
      SetLevel("H4", H4, Yellow);

      SetLevel("L3", L3, Yellow);
      SetLevel("L4", L4, Yellow);
   }


   //------ Midpoints Pivots
   if (midpivots==true) {
      SetLevel("M5", M5, Green);
      SetLevel("M4", M4, Green);
      SetLevel("M3", M3, Green);
      SetLevel("M2", M2, Green);
      SetLevel("M1", M1, Green);
      SetLevel("M0", M0, Green);
   }


   return(0);
}


//+------------------------------------------------------------------+
//| Helper                                                           |
//+------------------------------------------------------------------+
void SetLevel(string text, double level, color col1)
{
   string labelname= text + " Label";
   string linename= text + " Line";

   if (ObjectFind(labelname) != 0) {
      ObjectCreate(labelname, OBJ_TEXT, 0, Time[20], level);
      ObjectSetText(labelname, " " + text, 8, "Arial", White);
   }
   else {
      ObjectMove(labelname, 0, Time[20], level);
   }

   if (ObjectFind(linename) != 0) {
      ObjectCreate(linename, OBJ_HLINE, 0, Time[40], level);
      ObjectSet(linename, OBJPROP_STYLE, STYLE_DASHDOTDOT);
      ObjectSet(linename, OBJPROP_COLOR, col1);
   }
   else {
      ObjectMove(linename, 0, Time[40], level);
   }
}
Comments