RD-forecast osc-15M
Download script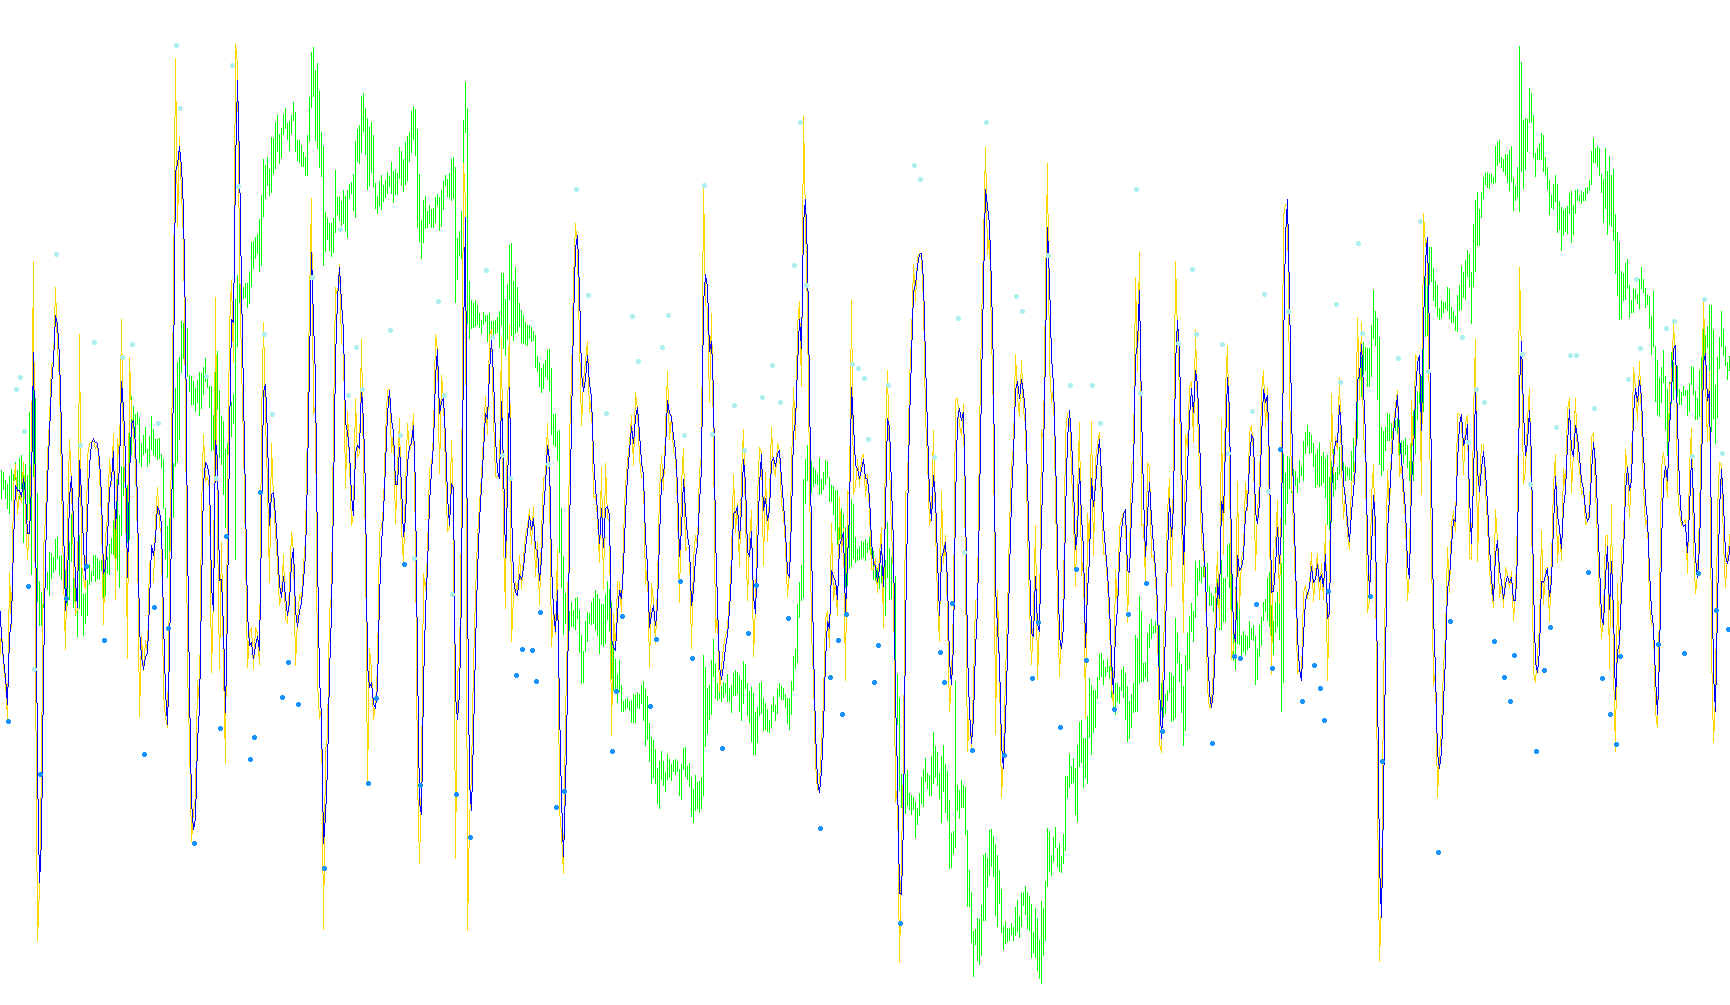
This tool is designed to help traders analyze market momentum by calculating a "forecast" based on historical price movement. Instead of just showing you what the price has done in the past, it attempts to project a smoothed trend line that can help identify potential turning points in the market.
How the Logic Works
The script follows a multi-step mathematical process to transform raw price data into actionable visual signals:
1. Data Smoothing (Weighted Moving Average) The tool starts by looking at a specific set of recent closing prices (determined by the "regress" setting). It calculates a weighted average, which means it gives more importance to certain data points than others to filter out "noise" or minor price fluctuations that might mislead a trader.
2. Forecast Calculation Once the smoothed average is established, the script compares the current market price against this average. By calculating the percentage difference between the two, it generates a "Forecast Oscillator." This tells you how far the price has stretched away from its expected path.
3. Triple Smoothing and Projection To make the data even more reliable, the tool applies a series of complex mathematical filters (similar to a triple smoothing technique). This process stabilizes the oscillator line, making it less erratic and easier to read on a chart. The goal here is to create a "trend of the trend."
4. Generating Entry Signals The most practical part of this script is how it identifies opportunities. It looks for specific "crosses" between the standard forecast and the triple-smoothed version:
- High Signals: When the primary oscillator drops below the smoothed line while the smoothed line is in a positive state, it suggests a potential upward momentum shift.
- Low Signals: When the primary oscillator rises above the smoothed line while the smoothed line is in a negative state, it suggests a potential downward momentum shift.
Summary for Traders
Essentially, this script acts as a filter. It takes the raw volatility of the market, smooths it out using weighted averages, and then produces two lines on your chart. When these lines interact in specific ways, the tool places visual arrows on your screen to highlight areas where the price momentum may be shifting from one direction to another.
//+------------------------------------------------------------------+
//|                                                 forecast osc.mq4 |
//|                Copyright © 2005, Nick Bilak, beluck[AT]gmail.com |
//|                                    http://metatrader.50webs.com/ |
//+------------------------------------------------------------------+
#property copyright "Copyright © 2005, Nick Bilak"
#property link      "http://metatrader.50webs.com/"

#property indicator_separate_window
#property indicator_buffers 4
#property indicator_level1 0
#property indicator_color1 SteelBlue
#property indicator_color2 HotPink
#property indicator_color3 Magenta
#property indicator_color4 Aqua

//---- input parameters
extern int       regress=15;
extern int       t3=3;
extern double    b=0.7;

//---- buffers
double osc[];
double osct3[];
double hiSig[];
double loSig[];

int shift,limit,length;
double b2,b3,c1,c2,c3,c4,w1,w2,n,WT,forecastosc,t3_fosc,sum,e1,e2,e3,e4,e5,e6,tmp,tmp2;

//+------------------------------------------------------------------+
//| Custom indicator initialization function                         |
//+------------------------------------------------------------------+
int init()
  {
//---- indicators
//   SetIndexStyle(0,DRAW_HISTOGRAM);
   SetIndexStyle(0,DRAW_LINE);
   SetIndexBuffer(0,osc);
   SetIndexEmptyValue(0,0);

   SetIndexStyle(1,DRAW_LINE);
   SetIndexBuffer(1,osct3);

   SetIndexStyle(2,DRAW_ARROW);
   SetIndexBuffer(2,hiSig);
   SetIndexEmptyValue(2,EMPTY_VALUE);
   SetIndexArrow(2,159);

   SetIndexStyle(3,DRAW_ARROW);
   SetIndexBuffer(3,loSig);
   SetIndexEmptyValue(3,EMPTY_VALUE);
   SetIndexArrow(3,159);
//----
   return(0);
  }
//+------------------------------------------------------------------+
//| Custor indicator deinitialization function                       |
//+------------------------------------------------------------------+
int deinit()
  {
   return(0);
  }
//+------------------------------------------------------------------+
//| Custom indicator iteration function                              |
//+------------------------------------------------------------------+
int start()
  {
   int counted_bars=IndicatorCounted();

   if (counted_bars<0) return(-1);
   if (counted_bars>0) counted_bars--;
   limit=Bars-31;
   if(counted_bars>=31) limit=Bars-counted_bars+2;

   for (shift=limit+30;shift>=0;shift--)   {

      b2=b*b;
      b3=b2*b;
      c1=-b3;
      c2=(3*(b2+b3));
      c3=-3*(2*b2+b+b3);
      c4=(1+3*b+b3+3*b2);
      n=t3;

      if (n<1) n=1;
      n = 1 + 0.5*(n-1);
      w1 = 2 / (n + 1);
      w2 = 1 - w1;

      length=regress;
      sum = 0;
      for (int i = length; i>0; i--) {
         tmp = length+1;
         tmp = tmp/3;
         tmp2 = i;
         tmp = tmp2 - tmp;
         sum = sum + tmp*Close[shift+length-i];
      }
      tmp = length;
      WT = sum*6/(tmp*(tmp+1));

      forecastosc=(Close[shift]-WT)/WT*100;

      e1 = w1*forecastosc + w2*e1;
      e2 = w1*e1 + w2*e2;
      e3 = w1*e2 + w2*e3;
      e4 = w1*e3 + w2*e4;
      e5 = w1*e4 + w2*e5;
      e6 = w1*e5 + w2*e6;

      t3_fosc = c1*e6 + c2*e5 + c3*e4 + c4*e3;

      osc[shift] = forecastosc;
      osct3[shift] = t3_fosc;

      if (osc[shift+1] > osct3[shift+2] && osc[shift+2] <= osct3[shift+3] && osct3[shift+1]<0) loSig[shift+1] = t3_fosc-0.05;
      if (osc[shift+1] < osct3[shift+2] && osc[shift+2] >= osct3[shift+3] && osct3[shift+1]>0) hiSig[shift+1] = t3_fosc+0.05;

   }
   return(0);
  }
//+------------------------------------------------------------------+
Comments