Regression_Channel
Download script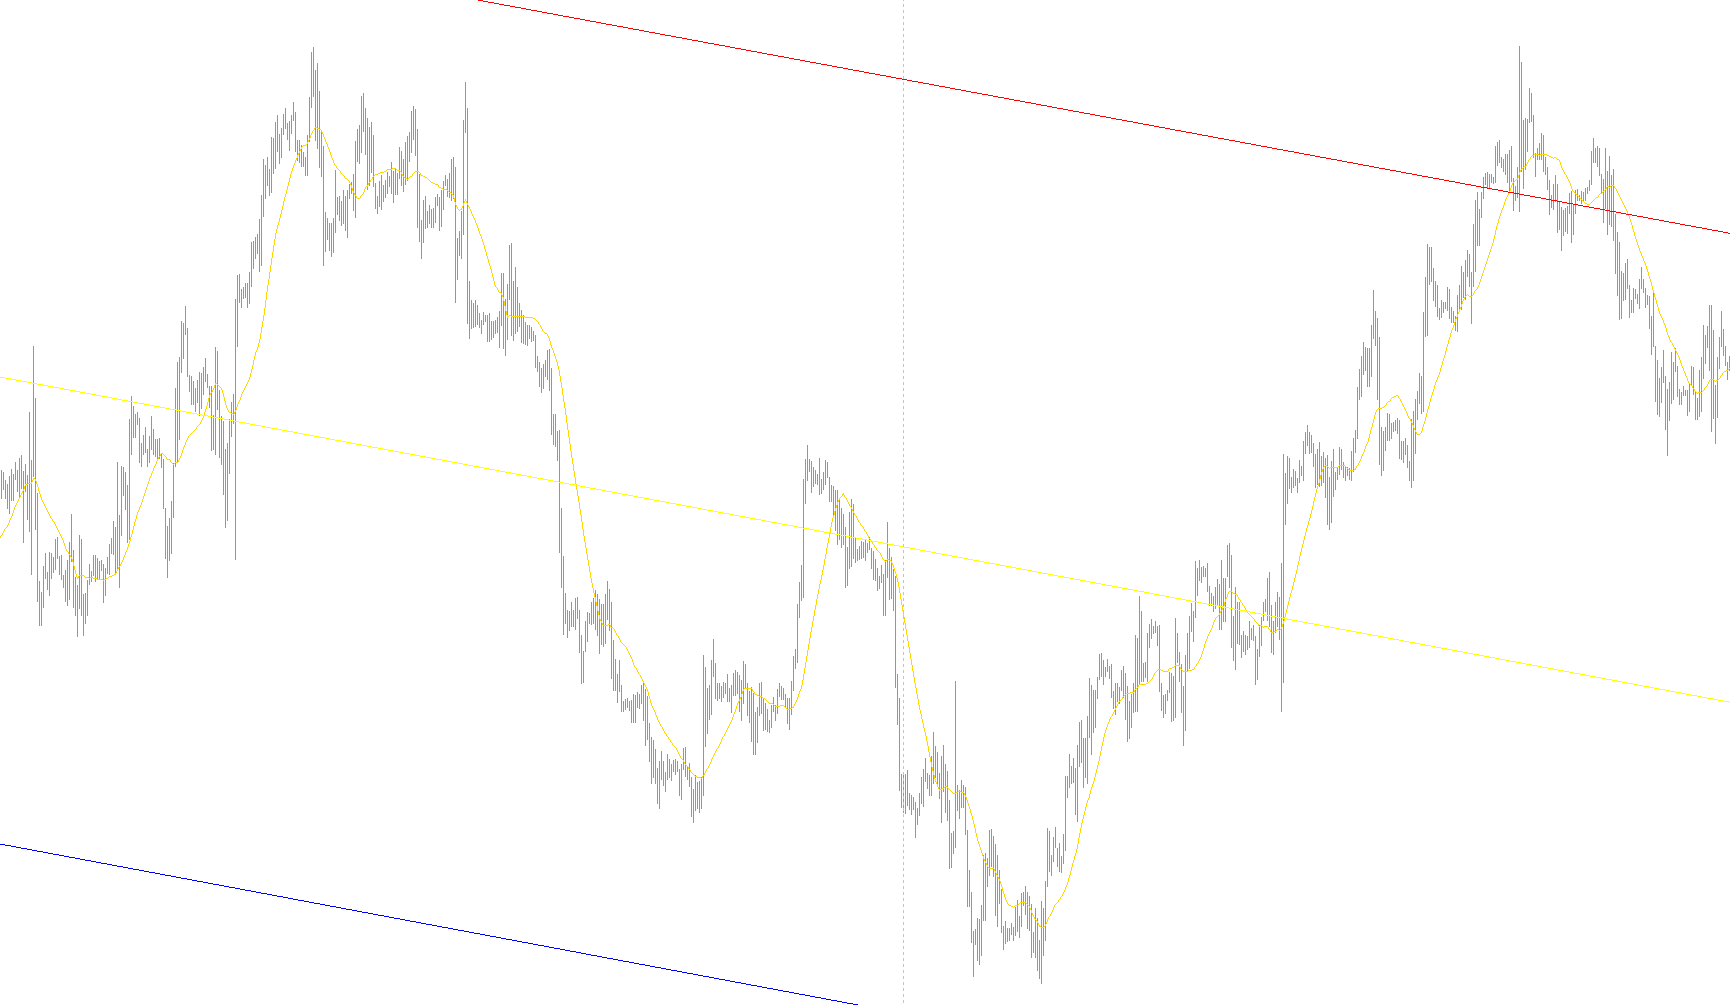
Overview of the Regression Channel Indicator
The Regression Channel is a technical analysis tool designed to help traders visualize the prevailing trend and volatility of a financial asset. Unlike standard moving averages that simply follow price, this script identifies a specific "corridor" of price action based on mathematical regression, helping to define the boundaries of a market move.
How the Logic Works
The indicator operates through a multi-step process to determine where the trend starts, how it moves, and how wide the "trading lane" should be:
1. Trend Identification (Detecting Extremes)
The script first analyzes the relationship between the current price and a Moving Average (MA). It looks for significant "overshoots"—moments where the price moves significantly far away from its average.
- It identifies the highest peak and the lowest trough within a specific timeframe that meet these conditions.
- By finding these two extreme points, the script establishes the beginning and the end of the regression channel.
2. Calculating the Central Trend Line
Once the start and end points are locked in, the script performs a linear regression calculation.
- Instead of just drawing a straight line between two dots, it calculates a "line of best fit" for that period.
- This resulting Middle Line (shown in yellow) represents the core momentum of the asset. It tells you the direction of the trend while smoothing out minor fluctuations.
3. Defining the Channel Boundaries (Volatility)
To determine how wide the channel should be, the script measures the "Standard Deviation." This is a mathematical way of saying it looks at how much the price usually wanders away from the middle line.
- It calculates a buffer zone (specifically 3 times the standard deviation).
- Upper and Lower Boundaries: It projects these boundaries based on the calculated volatility. If the price stays within these lines, it is considered to be following the current trend. If it breaks out, it may signal a significant change in market sentiment.
4. Visual Feedback
The script provides several visual cues to help with navigation:
- Middle Line: The core trend direction.
- Upper/Lower Lines: The "walls" of the channel.
- Vertical Markers: These clearly mark the start and end dates of the analyzed data range.
- Text Labels: These display the specific bar numbers associated with the beginning and end of the regression, allowing for precise timeframes.
Summary for the Trader
In simple terms, this script looks at a piece of history, finds the most extreme high and low points (relative to a moving average), and draws a "tunnel" around the trend. The middle line shows you where the price wants to go, and the outer lines show you the boundaries of normal volatility. When the price stays inside the tunnel, the trend is stable; when it hits or breaks the walls, it provides a potential signal for a trend reversal or a period of high instability.
//+------------------------------------------------------------------+
//|                                           Regression_Channel.mq4 |
//|                                        Converted to MT4 by KimIV |
//+------------------------------------------------------------------+
/*[[
	Name := Regression_Channel
	Author := Copyright © 2004, MetaQuotes Software Corp.
	Link := http://www.metaquotes.net/
]]*/
#property copyright "KimIV"
#property link      "http://www.kimiv.ru"

#property indicator_chart_window
#property indicator_buffers 1
#property indicator_color1 Blue

//------- Âíåøíèå ïàðàìåòðû èíäèêàòîðà -------------------------------
extern int    NumberName   = 1;
extern int    iPeriod      = 21;
extern double MAShoot      = 50;
extern bool   DrawVertical = True;
extern bool   DrawText     = True;
extern bool   ShowMA       = True;
extern int    LineWeight   = 1;
extern int    BarsCount    = 0;

//------- Áóôåðû èíäèêàòîðà ------------------------------------------
double MABuffer[];

//+------------------------------------------------------------------+
//| Custom indicator initialization function                         |
//+------------------------------------------------------------------+
void init() {
  ObjectCreate("Regression_middle"+NumberName, OBJ_TREND, 0, 0,0, 0,0);
	ObjectSet("Regression_middle"+NumberName, OBJPROP_COLOR, Yellow);
 	ObjectSet("Regression_middle"+NumberName, OBJPROP_STYLE, STYLE_SOLID);
 	ObjectSet("Regression_middle"+NumberName, OBJPROP_WIDTH, LineWeight);
  ObjectCreate("Regression_upper" +NumberName, OBJ_TREND, 0, 0,0, 0,0);
 	ObjectSet("Regression_upper"+NumberName, OBJPROP_STYLE, STYLE_SOLID);
 	ObjectSet("Regression_upper"+NumberName, OBJPROP_WIDTH, LineWeight);
  ObjectCreate("Regression_lower" +NumberName, OBJ_TREND, 0, 0,0, 0,0);
 	ObjectSet("Regression_lower"+NumberName, OBJPROP_STYLE, STYLE_SOLID);
 	ObjectSet("Regression_lower"+NumberName, OBJPROP_WIDTH, LineWeight);
  if (DrawText) {
    ObjectCreate("Regression_bars_begin"+NumberName, OBJ_TEXT, 0, 0,0, 0,0, 0,0);
    ObjectCreate("Regression_bars_end"  +NumberName, OBJ_TEXT, 0, 0,0, 0,0, 0,0);
  }
  if (DrawVertical) {
  	ObjectCreate("Regression_begin"+NumberName, OBJ_VLINE, 0, 0,0);
  	ObjectSet("Regression_begin"+NumberName, OBJPROP_COLOR, Silver);
  	ObjectSet("Regression_begin"+NumberName, OBJPROP_STYLE, STYLE_DOT);
  	ObjectSet("Regression_begin"+NumberName, OBJPROP_WIDTH, 1);
	  ObjectCreate("Regression_end"  +NumberName, OBJ_VLINE, 0, 0,0);
  	ObjectSet("Regression_end"+NumberName, OBJPROP_COLOR, Silver);
  	ObjectSet("Regression_end"+NumberName, OBJPROP_STYLE, STYLE_DOT);
  	ObjectSet("Regression_end"+NumberName, OBJPROP_WIDTH, 1);
	}

  SetIndexBuffer(0, MABuffer);
  SetIndexStyle (0, DRAW_LINE, STYLE_SOLID, 1);
  Comment("Auto Regression channel");
}

//+------------------------------------------------------------------+
//| Custor indicator deinitialization function                       |
//+------------------------------------------------------------------+
void deinit() {
  ObjectDelete("Regression_middle"+NumberName);
  ObjectDelete("Regression_upper" +NumberName);
  ObjectDelete("Regression_lower" +NumberName);
  ObjectDelete("Regression_bars_begin"+NumberName);
  ObjectDelete("Regression_bars_end"  +NumberName);
	ObjectDelete("Regressin_begin"+NumberName);
  ObjectDelete("Regressin_end"  +NumberName);
  Comment("");
}

//+------------------------------------------------------------------+
//| Custom indicator iteration function                              |
//+------------------------------------------------------------------+
void start() {
  bool   check_low, check_high;
  bool   check_upper_chanel;
  color  color_1, color_2;
  double save_low, save_high;
  double MA, a1, a2, a3, b1, a_, b_, y1, y2, price;
  double stddiv_low, stddiv_high, tmp_div;
  double x_n_up, x_1_up, x_n_down, x_1_down;
  double ratio_currency;
  int    Bars_, shift;
  int    n, n_begin, n_end;
  int    MAType, MAPrice;
  int    save_shift_low, save_shift_high;

  if (BarsCount<1) Bars_ = Bars;
  else Bars_ = BarsCount;

  save_low = -1;
  save_high = -1;
  save_shift_low = -1;
  save_shift_high = -1;

  check_low = false;
  check_high = false;

  MAType = MODE_SMA;
  MAPrice = PRICE_CLOSE;

  if (Close[1]>80) ratio_currency = 100;
  else ratio_currency = 10000;

  // Ïîèñê òî÷åê ïåðåñå÷åíèÿ ñ ÌÀ
  for (shift=Bars_-1; shift>=0; shift--) {
  	MA = iMA(NULL, 0, iPeriod, 0, MAType, MAPrice, shift);
  	if (ShowMA) MABuffer[shift] = MA;
  	if (MA-MAShoot/ratio_currency>Close[shift])	{
  		if (Close[shift]<save_low || save_low==-1) {
  			check_low = true;
  			save_low = Close[shift];
  			save_shift_low = shift;
  		}
  	}

  	if (MA+MAShoot/ratio_currency<Close[shift]) {
  		if (save_high<Close[shift] || save_high==-1) {
  			check_high = true;
  			save_high = Close[shift];
  			save_shift_high = shift;
  		}
  	}

  	if (check_low) {
  		if (MA+MAShoot/ratio_currency<Close[shift])	{
  			check_low = false;
  			save_low = -1;
  		}
  	}

  	if (check_high) {
  		if (MA-MAShoot/ratio_currency>Close[shift]) {
  			check_high = false;
  			save_high = -1;
  		}
  	}
  }

  //Îïðåäåëåíèå ãðàíèö ïîñòðîåíèÿ êàíàëëà
  if (save_shift_low>save_shift_high) {
  	n_begin = save_shift_low;
  	n_end = save_shift_high;
  } else {
  	n_begin = save_shift_high;
  	n_end = save_shift_low;
  }

  if (n_end==0) n_end = 1; // Íóëåâîé áàð íå èñïîëüçîâàòü
  n = n_begin - n_end + 1; // äëèíà êàíàëà

  a1 = 0;
  a2 = 0;
  a3 = 0;
  b1 = 0;
  a_ = 0;
  b_ = 0;
  y1 = 0;
  y2 = 0;
  tmp_div = 0;

  if (Close[n_begin]<Close[n_end]) check_upper_chanel = true;
  else check_upper_chanel = false;

  for (shift=n_begin; shift>=n_end; shift--) {
  	if (check_upper_chanel) price = Low[shift];
  	else price = High[shift];

  	a1 = a1 + shift*price;
  	a2 = a2 + shift;
  	a3 = a3 + price;
  	b1 = b1 + shift*shift;
  }

  b_ = (n*a1 - a2*a3)/(n*b1 - a2*a2);
  a_ = (a3 - b_*a2)/n;
  y1 = a_ + b_*n_begin;
  y2 = a_ + b_*n_end;

 	ObjectSet("Regression_middle"+NumberName, OBJPROP_TIME1, Time[n_begin]);
 	ObjectSet("Regression_middle"+NumberName, OBJPROP_TIME2, Time[n_end]);
 	ObjectSet("Regression_middle"+NumberName, OBJPROP_PRICE1, y1);
 	ObjectSet("Regression_middle"+NumberName, OBJPROP_PRICE2, y2);

  for (shift=n_begin; shift>=n_end; shift--) {
  	if (check_upper_chanel) price = Low[shift];
	  else price = High[shift];

  	tmp_div = tmp_div + (price - (a_ + b_*shift))*(price - (a_ + b_*shift));
  }

  stddiv_low = MathSqrt(tmp_div/n);
  stddiv_high = MathSqrt(tmp_div/n);

  x_n_up = y1 + 3*stddiv_high;
  x_1_up = y2 + 3*stddiv_high;

  x_n_down = y1 - 3*stddiv_low;
  x_1_down = y2 - 3*stddiv_low;

  if (check_upper_chanel) {
  	color_1 = Blue;
  	color_2 = Red;
  } else {
  	color_1 = Red;
  	color_2 = Blue;
  }

  //upper
 	ObjectSet("Regression_upper"+NumberName, OBJPROP_TIME1, Time[n_begin]);
 	ObjectSet("Regression_upper"+NumberName, OBJPROP_TIME2, Time[n_end]);
 	ObjectSet("Regression_upper"+NumberName, OBJPROP_PRICE1, x_n_up);
 	ObjectSet("Regression_upper"+NumberName, OBJPROP_PRICE2, x_1_up);
	ObjectSet("Regression_upper"+NumberName, OBJPROP_COLOR, color_1);
  //lower
 	ObjectSet("Regression_lower"+NumberName, OBJPROP_TIME1, Time[n_begin]);
 	ObjectSet("Regression_lower"+NumberName, OBJPROP_TIME2, Time[n_end]);
 	ObjectSet("Regression_lower"+NumberName, OBJPROP_PRICE1, x_n_down);
 	ObjectSet("Regression_lower"+NumberName, OBJPROP_PRICE2, x_1_down);
 	ObjectSet("Regression_lower"+NumberName, OBJPROP_COLOR, color_2);

  if (DrawText) {
   	ObjectSet("Regression_bars_begin"+NumberName, OBJPROP_TIME1, Time[n_begin]);
   	ObjectSet("Regression_bars_begin"+NumberName, OBJPROP_PRICE1, x_n_down);
  	ObjectSetText("Regression_bars_begin"+NumberName, DoubleToStr(n_begin,0), 10, "System", White);

   	ObjectSet("Regression_bars_end"+NumberName, OBJPROP_TIME1, Time[n_end]);
   	ObjectSet("Regression_bars_end"+NumberName, OBJPROP_PRICE1, x_1_up);
  	ObjectSetText("Regression_bars_end"+NumberName, DoubleToStr(n_end,0), 10, "System", White);
  } else {
  	ObjectDelete("Regression_bars_begin" + NumberName);
  	ObjectDelete("Regression_bars_end" + NumberName);
  }

  if (DrawVertical) {
  	ObjectSet("Regression_begin"+NumberName, OBJPROP_TIME1, Time[n_begin]);
  	ObjectSet("Regression_end"+NumberName, OBJPROP_TIME1, Time[n_end]);
  } else {
  	ObjectDelete("Regression_begin" + NumberName);
  	ObjectDelete("Regression_end" + NumberName);
  }
}
//-------------------------------------------------------------------+
Comments