RD-BT2Stop
Download script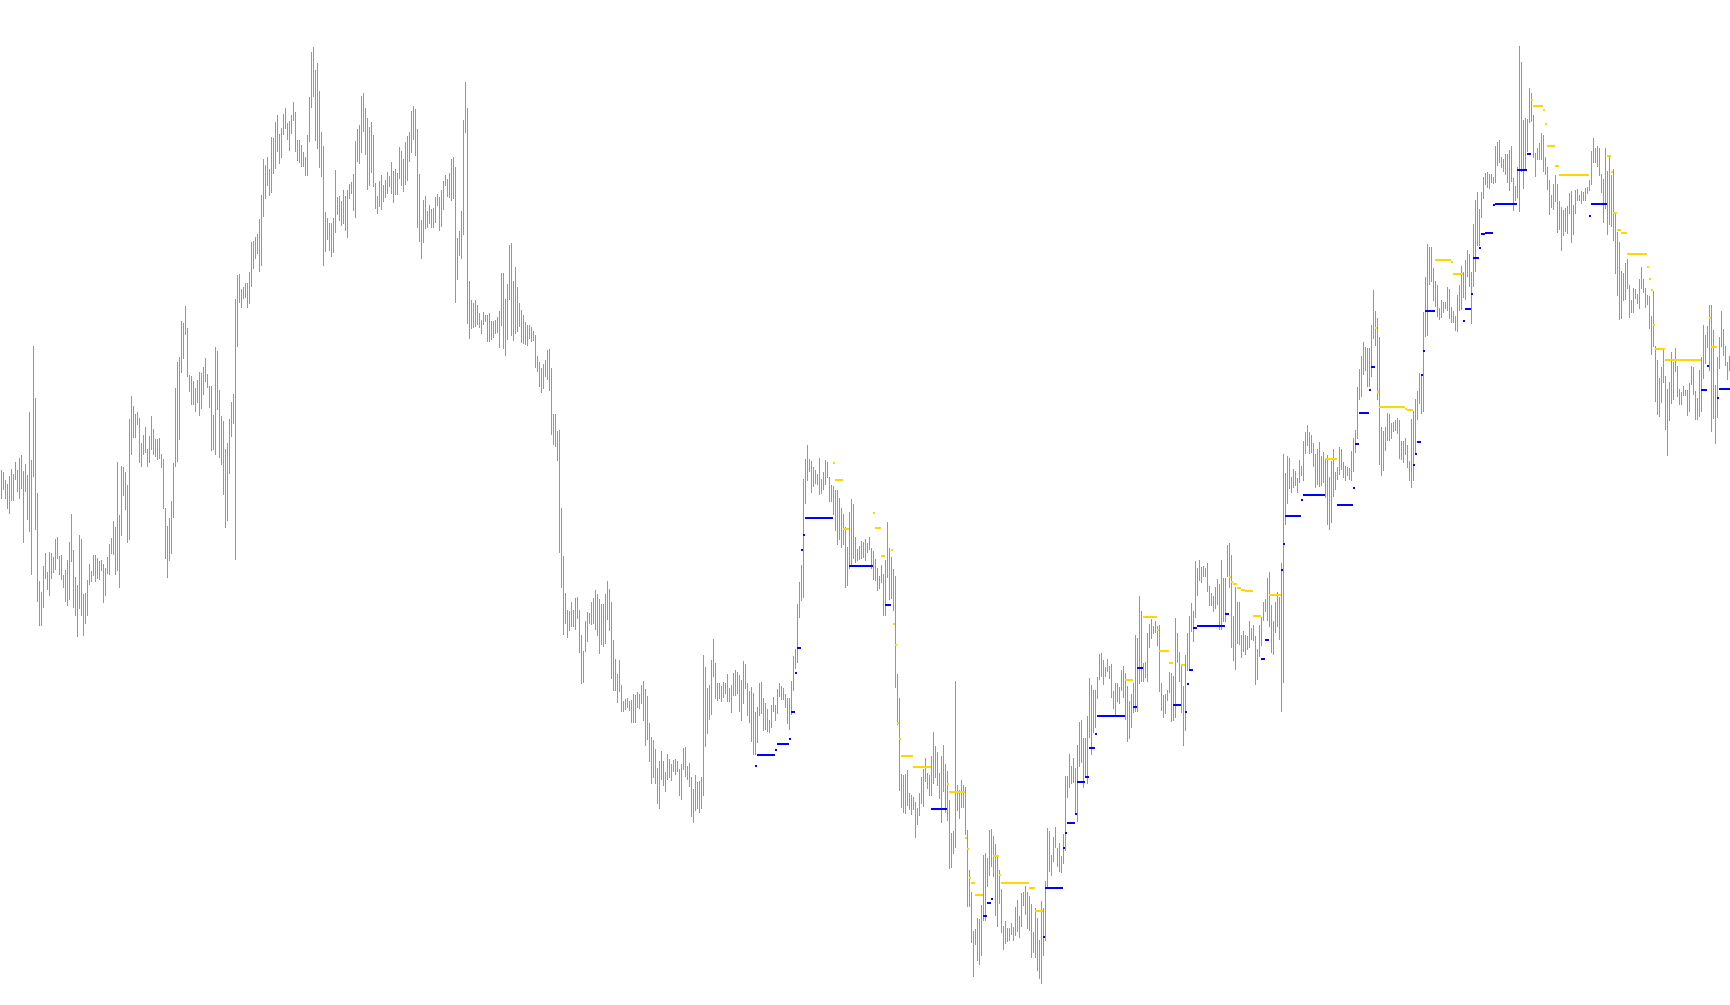
This indicator is designed to help traders visualize market momentum and identify potential trend reversals by dynamically plotting "stop" levels based on historical price volatility. Instead of relying on static lines, it adapts to the current behavior of the market to provide a more organic view of price action.
Core Logic & Functionality
The script operates by analyzing the relationship between recent price movements and the average range of the candles over a specific period. Here is a breakdown of how it processes that information:
1. Volatility Measurement (The "WATR" Component) The tool first calculates a weighted average of the market's range (the distance between the high and low of each candle). By giving more weight to recent candles, the script ensures that the volatility calculation is highly responsive to current market conditions. This creates a dynamic percentage—essentially a "buffer zone"—that expands or contracts based on how wildly the price is moving.
2. Trend Detection and Tracking The indicator monitors the direction of the price. It identifies whether the market is currently in an upward (bullish) or downward (bearish) trend by comparing the closing prices against the highs and lows established during previous sessions.
- In an Uptrend: The script tracks the highest price reached. It then subtracts the volatility buffer from that high point to create a trailing support level.
- In a Downtrend: The script tracks the lowest price reached. It then adds the volatility buffer to that low point to create a trailing resistance level.
3. Dynamic Reversal Logic The most critical part of this logic is its ability to "flip" directions. The indicator does not just follow the price; it waits for a specific breach of its own calculated buffer:
- If the market is in an uptrend but the price drops below the calculated support level, the script recognizes a trend change and switches to a bearish outlook.
- Conversely, if the market is in a downtrend but the price breaks above the resistance level, it switches to a bullish outlook.
Visual Representation
On your chart, this logic manifests as two distinct sets of markers (colored Blue for upward trends and Red for downward trends). These markers represent the "ceiling" or "floor" of the current move. When you see the markers shifting colors or positions, it signifies that the script has detected a significant enough move in price to justify a change in the market's primary direction.
Summary for the User
In simple terms, this tool acts like a "smart trailing stop." It measures how much the market typically "breathes" (volatility) and places a marker at a distance from the peak or valley. As long as the price stays within that breathing room, the trend is considered intact. Once the price breaks through that buffer, the script alerts you to a potential shift in the market's momentum.
//+-----------------------------------------------------------------------+
//|                                                   BrainTrend1Stop.mq4 |
//|                                   Copyright © 2005. Alejandro Galindo |
//|                                                   http://elCactus.com |
//+-----------------------------------------------------------------------+

#property indicator_chart_window
#property indicator_buffers 2
#property indicator_color1 Red
#property indicator_color2 Blue

//---- input parameters
extern int AveragePeriod= 10;
extern int Reg= 1;

//---- buffers
double Buffer1[];
double Buffer2[];


//+------------------------------------------------------------------+
//| Custom indicator initialization function                         |
//+------------------------------------------------------------------+
int init()
{
   //---- indicator line
   IndicatorBuffers(2);

   SetIndexStyle(0,DRAW_ARROW);
   SetIndexBuffer(0,Buffer1);
   SetIndexArrow(0,158);

   SetIndexStyle(1,DRAW_ARROW);
   SetIndexBuffer(1,Buffer2);
   SetIndexArrow(1,158);

   //----
   return(0);
}

//+------------------------------------------------------------------+
//| BrainTrend1Stop                                                  |
//+------------------------------------------------------------------+
int start()
{

   int i,shift,counted_bars=IndicatorCounted();
   double value=0, price=0, trend=0, dK=0, AvgRange=0, WATR=0;
   int bar=0;
   int CountBars= 500;
   if (CountBars>=Bars) CountBars=Bars;

   SetIndexDrawBegin(0,Bars-CountBars+11+1);
   SetIndexDrawBegin(1,Bars-CountBars+11+1);

   //---- initial zero
   AvgRange=0;
   for (i=1;i<=AveragePeriod;i++)
   {
      dK = 1+(AveragePeriod-i)/AveragePeriod;
      AvgRange=AvgRange+ dK*MathAbs(High[i]-Low[i]);
   }

   if (Point>=0.01) { WATR = (AvgRange/AveragePeriod)*Point; }
   else { WATR = AvgRange/AveragePeriod; }

   if (Close[Bars-1] > Open[Bars-1])
   {
      value = Close[Bars - 1] * (1 - WATR);
      trend = 1;
      Buffer2[Bars-1]=value;
   }

   if (Close[Bars-1] < Open[Bars-1])
   {
      value = Close[Bars - 1] * (1 + WATR);
      trend = -1;
      Buffer1[Bars-1]=value;
   }


   bar=CountBars-11-1;
   while(bar>=0)
   {

      Buffer1[bar]=0;   // fixed, was: Buffer1[shift]=0;
      Buffer2[bar]=0;   // fixed, was: Buffer2[shift]=0;

      if (Reg==2)
      {
         AvgRange=0;
         for (i=1;i<=AveragePeriod;i++)
         {
            dK = 1+(AveragePeriod-i)/AveragePeriod;
            AvgRange=AvgRange+ dK*MathAbs(High[bar + i]-Low[bar + i]);
         }
         if (Point>=0.01) { WATR = (AvgRange/AveragePeriod)*Point; }
         else { WATR = AvgRange/AveragePeriod; }

      }

      if (trend >= 0) {

         if (Close[bar] > price) { price = Close[bar]; }
         value = price * (1 - WATR);

         if (Close[bar] < value)
         {
             price = Close[bar];
             value = price * (1 + WATR);
             trend = -1;
         }
       }
       else
       if (trend <= 0) {

            if (Close[bar] < price) { price = Close[bar]; }
            value = price * (1 + WATR);

            if (Close[bar] > value)
            {
                price = Close[bar];
               value = price * (1 - WATR);
               trend = 1;
            }
       }

      if (trend == -1) { Buffer1[bar]=value; }
      if (trend == 1) { Buffer2[bar]=value; }

      bar--;
   }

   return(0);
}

//+------------------------------------------------------------------+
Comments