RBCI2_v2
Download script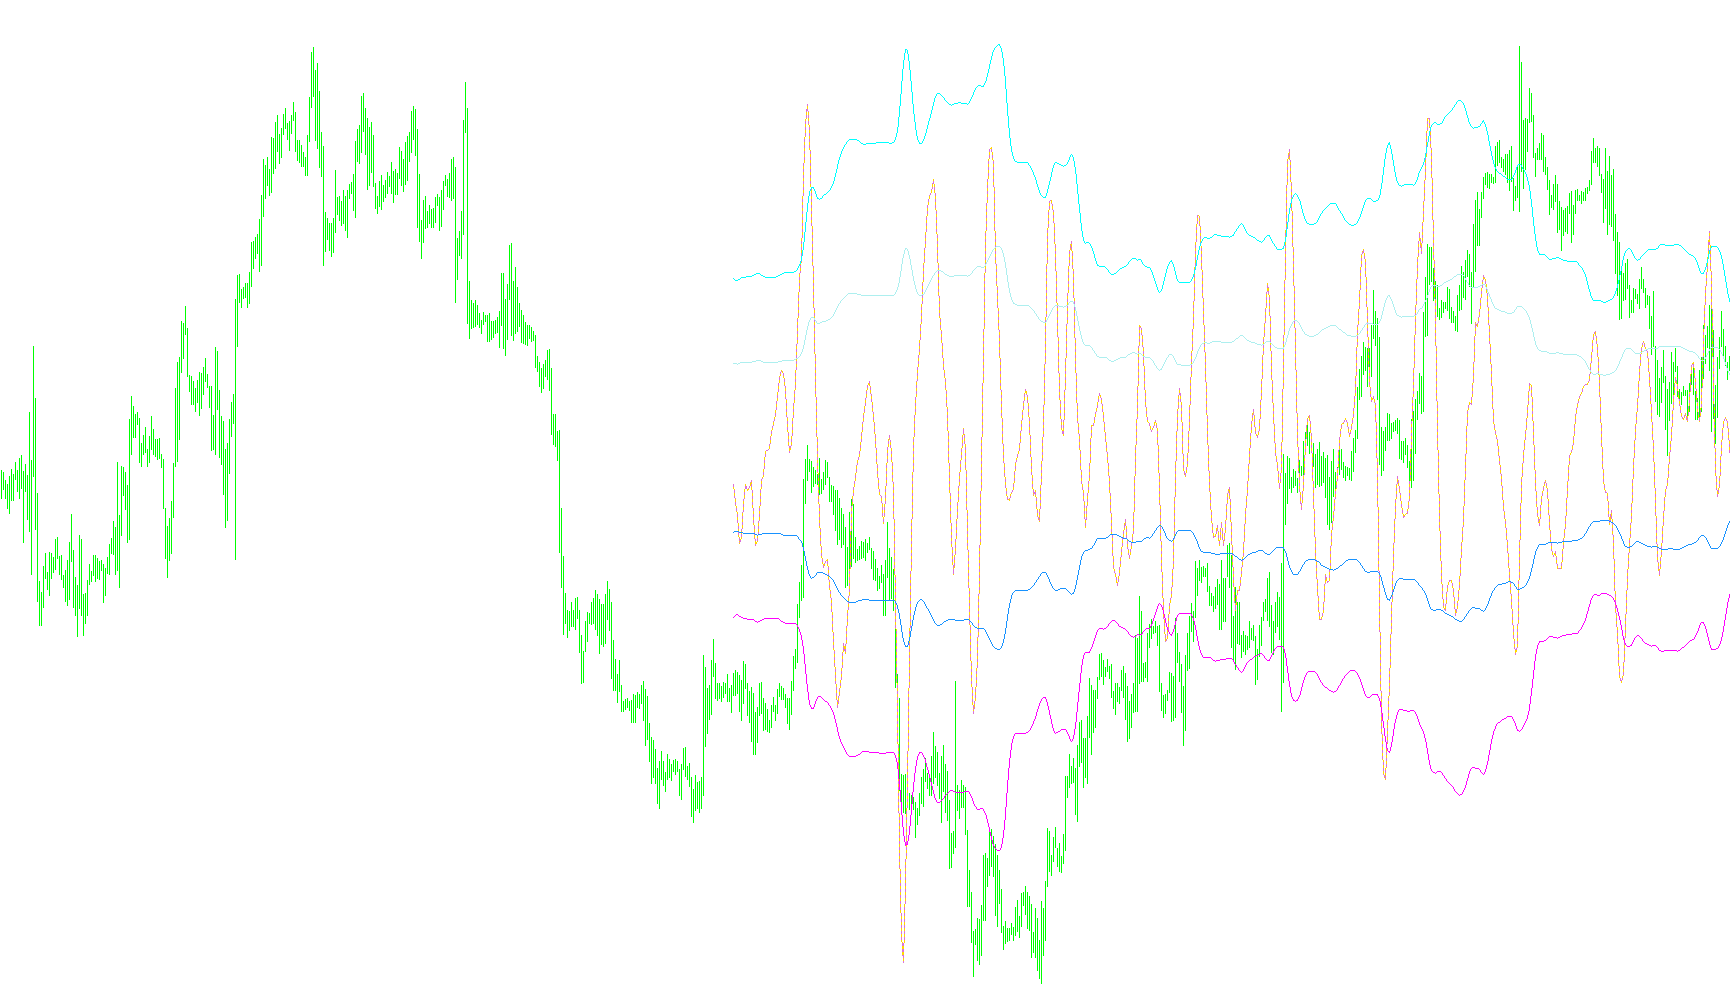
Overview of Indicator Logic
This script functions as a custom technical analysis tool designed to process historical price data and generate multiple visual data streams in a separate window. Rather than relying on simple moving averages, it utilizes a sophisticated weighted calculation to interpret market trends and volatility.
Core Mathematical Processing
The logic is built upon three primary layers of calculation:
1. Weighted Price Analysis At its foundation, the script uses a specific mathematical formula that examines a sequence of 56 historical price points (closing prices). Each of these prices is assigned a unique weight—some positive and some negative. By multiplying each price by its designated coefficient and summing them up, the script generates a "base value." This method allows the indicator to be more sensitive to specific past movements while filtering out general market noise.
2. Dynamic Averaging and Offsetting The script does not look at these base values in isolation. It performs an iterative calculation across a window of 52 bars. It calculates an average of these weighted results and then compares the current immediate value against this historical average. This comparison helps identify whether the current price momentum is deviating from its recent norm.
3. Variance and Volatility Mapping Beyond simple trend tracking, the script calculates the "variance" (the spread or deviation) of the data within that 52-bar window. By calculating the square root of this variance, it determines a volatility metric. This metric is then used to generate symmetrical lines—essentially creating a "channel" or "envelope" around the primary trend line.
Visual Outputs
The script populates six distinct visual buffers, which translate the underlying math into different graphical elements:
- Primary Trend & Dots: The core calculation provides two primary lines (one being a dotted line) that represent the smoothed price momentum.
- Volatility Channels: Based on the variance calculation, the script generates four additional lines. These are scaled at multipliers of +1, -1, +2, and -2 relative to the volatility metric.
Summary for the User
In non-technical terms, this indicator attempts to "smooth out" the jagged movement of price action using a complex weighted formula. Once smoothed, it calculates how much the price is currently fluctuating compared to its recent history. It then draws a central trend line accompanied by several surrounding lines that expand or contract based on how volatile the market is behaving at that moment.
//+------------------------------------------------------------------+
//|                                                        RBCI2.mq4 |
//|             Finware.ru 2003  . Indicator rewritten by CrazyChart |
//|                                    mailto:newcomer2003@yandex.ru |
//+------------------------------------------------------------------+
//double CrazyChart (int i,int shift);
#property copyright "Finware.ru 2003. Indicator rewritten by CrazyChart"
#property link      "mailto:newcomer2003@yandex.ru"
#define COMPANY_NAME "MyCompany Ltd."
#property indicator_separate_window
#property indicator_buffers 6
#property indicator_color1 Red
#property indicator_color2 Red
#property indicator_color3 Blue
#property indicator_color4 Aqua
#property indicator_color5 Crimson
#property indicator_color6 Gold
//---- input parameters
extern int       CountBars=500;
extern int       ExtParam2;
extern int       ExtParam3;
extern double reddd;
//---- buffers
double ExtMapBuffer1[];
double ExtMapBuffer2[];
double ExtMapBuffer3[];
double ExtMapBuffer4[];
double ExtMapBuffer5[];
double ExtMapBuffer6[];
//+------------------------------------------------------------------+
//| Custom indicator initialization function                         |
//+------------------------------------------------------------------+
int init()
  {
//---- indicators
   string short_name;
   IndicatorBuffers(6);
   SetIndexStyle(0,DRAW_LINE);
   SetIndexBuffer(0,ExtMapBuffer1);
   SetIndexEmptyValue(0,0.0);
   SetIndexDrawBegin(0,55);
   SetIndexStyle(1,DRAW_LINE,STYLE_DOT,1,Orchid);
   SetIndexBuffer(1,ExtMapBuffer2);
   SetIndexEmptyValue(1,0.0);
   SetIndexDrawBegin(1,55);
   SetIndexStyle(2,DRAW_LINE);
   SetIndexBuffer(2,ExtMapBuffer3);
   SetIndexEmptyValue(2,0.0);
   SetIndexDrawBegin(2,55);
   SetIndexStyle(3,DRAW_LINE);
   SetIndexBuffer(3,ExtMapBuffer4);
   SetIndexEmptyValue(3,0.0);
   SetIndexDrawBegin(3,55);
   SetIndexStyle(4,DRAW_LINE);
   SetIndexBuffer(4,ExtMapBuffer5);
   SetIndexEmptyValue(4,0.0);
   SetIndexDrawBegin(4,55);
   SetIndexStyle(5,DRAW_LINE);
   SetIndexBuffer(5,ExtMapBuffer6);
   SetIndexEmptyValue(5,0.0);
   SetIndexDrawBegin(5,55);
   IndicatorDigits(MarketInfo(Symbol(),MODE_DIGITS));
   IndicatorShortName("RBCI2");
//----
   return(0);
  }
//+------------------------------------------------------------------+
//| Custor indicator deinitialization function                       |
//+------------------------------------------------------------------+
int deinit()
  {
//---- TODO: add your code here
//----
   return(0);
  }
//+------------------------------------------------------------------+
//| Ìîÿ ôóíêöèÿ âû÷èñëÿåò ïåðåìåííóþ ñ öèôðîâûì ôèëüòðîì             |
//+------------------------------------------------------------------+
double CrazyChart (int i,int shift)
//function that counts Sum of 55 bars
  {
   double RBCI2;
   RBCI2=
   -35.5198140000*Close[i+0+shift]
   -29.3302904200*Close[i+1+shift]
   -18.4253122700*Close[i+2+shift]
   -5.3409716410*Close[i+3+shift]
   +7.0224246110*Close[i+4+shift]
   +16.1743143600*Close[i+5+shift]
   +20.6539163900*Close[i+6+shift]
   +20.3238589400*Close[i+7+shift]
   +16.2679056100*Close[i+8+shift]
   +10.3508317200*Close[i+9+shift]
   +4.5956464710*Close[i+10+shift]
   +0.5816210219*Close[i+11+shift]
   -0.9556878591*Close[i+12+shift]
   -0.2188650350*Close[i+13+shift]
   +1.8617718350*Close[i+14+shift]
   +4.0429772970*Close[i+15+shift]
   +5.2336026320*Close[i+16+shift]
   +4.8503271170*Close[i+17+shift]
   +2.9598818100*Close[i+18+shift]
   +0.1813422994*Close[i+19+shift]
   -2.5916583950*Close[i+20+shift]
   -4.5352277420*Close[i+21+shift]
   -5.1799911240*Close[i+22+shift]
   -4.5414039780*Close[i+23+shift]
   -3.0665332280*Close[i+24+shift]
   -1.4306935910*Close[i+25+shift]
   -0.2740625440*Close[i+26+shift]
   +0.0259294264*Close[i+27+shift]
   -0.5361336393*Close[i+28+shift]
   -1.6274205570*Close[i+29+shift]
   -2.7320093940*Close[i+30+shift]
   -3.3584444990*Close[i+31+shift]
   -3.2210950120*Close[i+32+shift]
   -2.3321664220*Close[i+33+shift]
   -0.9758039283*Close[i+34+shift]
   +0.4132087314*Close[i+35+shift]
   +1.4199522360*Close[i+36+shift]
   +1.7965291580*Close[i+37+shift]
   +1.5408713520*Close[i+38+shift]
   +0.8768248011*Close[i+39+shift]
   +0.1561692145*Close[i+40+shift]
   -0.2796045774*Close[i+41+shift]
   -0.2243863077*Close[i+42+shift]
   +0.3279264464*Close[i+43+shift]
   +1.1886385970*Close[i+44+shift]
   +2.0574048450*Close[i+45+shift]
   +2.6265630350*Close[i+46+shift]
   +2.6969364910*Close[i+47+shift]
   +2.2285276520*Close[i+48+shift]
   +1.3534844570*Close[i+49+shift]
   +0.3088511323*Close[i+50+shift]
   -0.6383119873*Close[i+51+shift]
   -1.2763116980*Close[i+52+shift]
   -1.5134175380*Close[i+53+shift]
   -1.3771978870*Close[i+54+shift]
   -1.6154244060*Close[i+55+shift];
   return(RBCI2);
  }
//+------------------------------------------------------------------+
//|                                                                  |
//+------------------------------------------------------------------+
int start()
  {
   int    limit,counted_bars=IndicatorCounted(),min,i;
   if (CountBars>=Bars) CountBars=Bars;
   SetIndexDrawBegin(0,Bars-CountBars);
   SetIndexDrawBegin(1,Bars-CountBars);
   SetIndexDrawBegin(2,Bars-CountBars);
   SetIndexDrawBegin(3,Bars-CountBars);
   SetIndexDrawBegin(4,Bars-CountBars);
   SetIndexDrawBegin(5,Bars-CountBars);
//----
   double RBCI2;
   double Value1;
   int Value2=52;
   double Value4,Value5,Value6,Value7,Value8,Value9;
   //  reddd = CrazyChart(2,1); //c hf,jnfkj!!!!!!!!!!!!!!!!!
   if (counted_bars<0) return(-1);
//---- last counted bar will be recounted
   if (counted_bars>0) counted_bars--;
//----
   limit=Bars-counted_bars;
   for(i=1;i<=0;i++) ExtMapBuffer1[Bars-i]=0.0;
     for(i=limit;i>=0;i--)
     {
      // CountBars i+shift+55
        for(int shift=0;shift<=Value2-1;shift++)
        {
         Value4=Value4-CrazyChart(i,shift);
        }
      Value1=-CrazyChart(i,0);
      Value5=Value4/Value2;
      Value6=0;
      ExtMapBuffer1[i]=-Value5+Value1;// "RBCI2");
      ExtMapBuffer2[i]=-Value5+Value1; //"Dots")
        for(shift=0;shift<=Value2-1;shift++) {
         Value6=Value6 + (-CrazyChart(i,shift)-Value5)*(-CrazyChart(i,shift)-Value5);
        }
      Value8=Value6/(Value2-1);
      Value9=MathSqrt(Value8);
      ExtMapBuffer3[i]= +Value9;//,"LINE");
      ExtMapBuffer4[i]= -1*Value9;//Plot4(-Value9,"LINE");
      ExtMapBuffer5[i]=+2*Value9;//,"LINE");
      ExtMapBuffer6[i]=-2*Value9;//,"LINE");
      Value4=0;
      Value6=0;
     }
//----
   return(0);
  }
//+------------------------------------------------------------------+
Comments