RD-ForecastOsc_001
Download script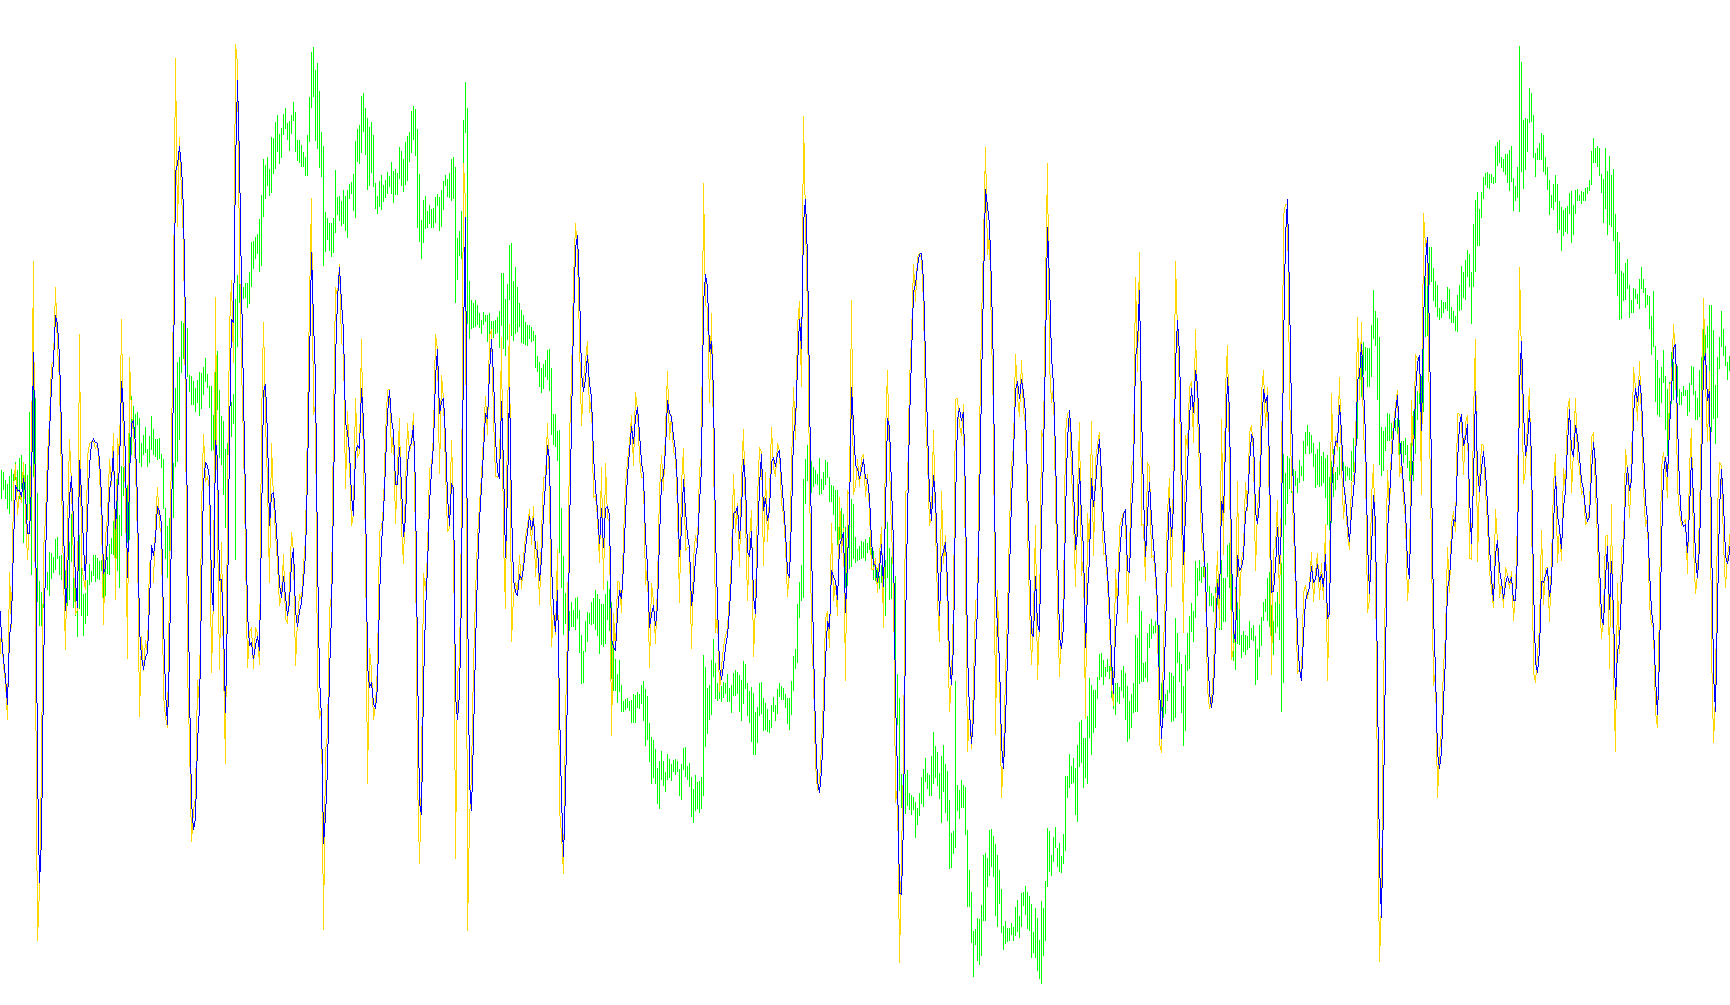
This tool is designed as a visual indicator for trading platforms to help analyze price momentum and predict potential market directions based on historical data. Instead of simply showing where the price has been, it attempts to project a smoother "forecast" of market movement using mathematical modeling.
How the Logic Works
The script operates through three primary stages of calculation:
1. Weighted Data Collection The tool begins by looking back at a specific number of historical price points (defined by the "Regress" setting). Rather than treating all historical data equally, it applies a weighted calculation to these prices. This ensures that the data most relevant to current trends has a significant impact on the final result, filtering out minor "noise" in the market.
2. Forecasting the Momentum Once the weighted data is gathered, the script calculates a "Forecasted Oscillator." This is a mathematical representation of where the price momentum is heading. It determines the relationship between current prices and the weighted historical averages to create a smoothed line. This helps traders see the underlying trend more clearly than a standard price chart might allow.
3. Trend Smoothing and Signal Generation To make the data even more readable, the script applies an advanced smoothing technique (similar to a T3 moving average). It takes the forecasted values and processes them through a series of multi-layered calculations to eliminate erratic jumps or "wiggles."
Summary for the User
The result is a dual-line indicator:
- The Primary Line: Represents the smoothed forecast of the market's momentum.
- The Secondary Line: Acts as a refined signal based on that forecast, helping to identify whether the current trend is accelerating or decelerating.
By combining historical weighting with predictive smoothing, this script aims to provide a clearer picture of market direction, allowing you to see potential trends more fluidly than by looking at raw price action alone.
//+------------------------------------------------------------------+
//|                                                 forecast osc.mq4 |
//|                Copyright © 2005, Nick Bilak, beluck[AT]gmail.com |
//|                                    http://metatrader.50webs.com/ |
//+------------------------------------------------------------------+
#property copyright "Copyright © 2005, Nick Bilak"
#property link      "http://metatrader.50webs.com/"

#property indicator_separate_window

#property indicator_buffers 2
#property indicator_level1 0

#property indicator_color1 SteelBlue
#property indicator_color2 Red


//---- input parameters
extern int       Regress= 15;
extern int       T3= 3;
extern double    B= 0.7;

//---- buffers
double Osc[];
double Osct3[];

double HiSig[];
double LoSig[];


//+------------------------------------------------------------------+
//| Custom indicator initialization function                         |
//+------------------------------------------------------------------+
int init()
{
   SetIndexStyle(0,DRAW_LINE);
   SetIndexBuffer(0,Osc);

   SetIndexEmptyValue(0,0);
   SetIndexStyle(1,DRAW_LINE);
   SetIndexBuffer(1,Osct3);

   return(0);
}

//+------------------------------------------------------------------+
//| Custor indicator deinitialization function                       |
//+------------------------------------------------------------------+
int deinit()
{
   return(0);
}

//+------------------------------------------------------------------+
//| Custom indicator iteration function                              |
//+------------------------------------------------------------------+
int start()
{
   int counted_bars= IndicatorCounted(),
       limit;

   if (counted_bars<0) return(-1);
   if (counted_bars>0) counted_bars--;

   limit= Bars - counted_bars;

   ForecastOsc(0, limit, Osc, Osct3, Regress, T3, B);

   return (0);
}


//+------------------------------------------------------------------+
//| Calc forecast buffers  from lastbar down to offset               |
//+------------------------------------------------------------------+
void ForecastOsc(int offset, int lastbar, double &osc[], double &osct3[], int regress, int t3, double b)
{
   int shift, length, warmup= 30;
   double b2=b*b,
            b3=b2*b,
            c1=-b3,
            c2=(3*(b2+b3)),
            c3=-3*(2*b2+b+b3),
            c4=(1+3*b+b3+3*b2),
            n = 1 + 0.5*(t3-1),
            w1 = 2 / (n + 1),
            w2 = 1 - w1,
            wt,forecastosc,t3_fosc,sum,
            e1,e2,e3,e4,e5,e6,tmp,tmp2;

   lastbar= MathMin(Bars-warmup-regress, lastbar);

   for (shift= lastbar+warmup; shift>=offset; shift--)   {

      length= regress;
      sum = 0;
      for (int i = length; i>0; i--) {
         tmp = length+1;
         tmp = tmp/3;
         tmp2 = i;
         tmp = tmp2 - tmp;
         sum = sum + tmp*Close[shift+length-i];
      }
      tmp = length;

      wt = sum*6/(tmp*(tmp+1));

      forecastosc= (Close[shift]-wt)/wt*100;

      e1 = w1*forecastosc + w2*e1;
      e2 = w1*e1 + w2*e2;
      e3 = w1*e2 + w2*e3;
      e4 = w1*e3 + w2*e4;
      e5 = w1*e4 + w2*e5;
      e6 = w1*e5 + w2*e6;

      t3_fosc = c1*e6 + c2*e5 + c3*e4 + c4*e3;

      if (shift<=lastbar) {   // don't put swing in cycle into the signal buffers
         osc[shift] = forecastosc;
         osct3[shift] = t3_fosc;
      }

    }

   return(0);
}
Comments