RBCI2
Download script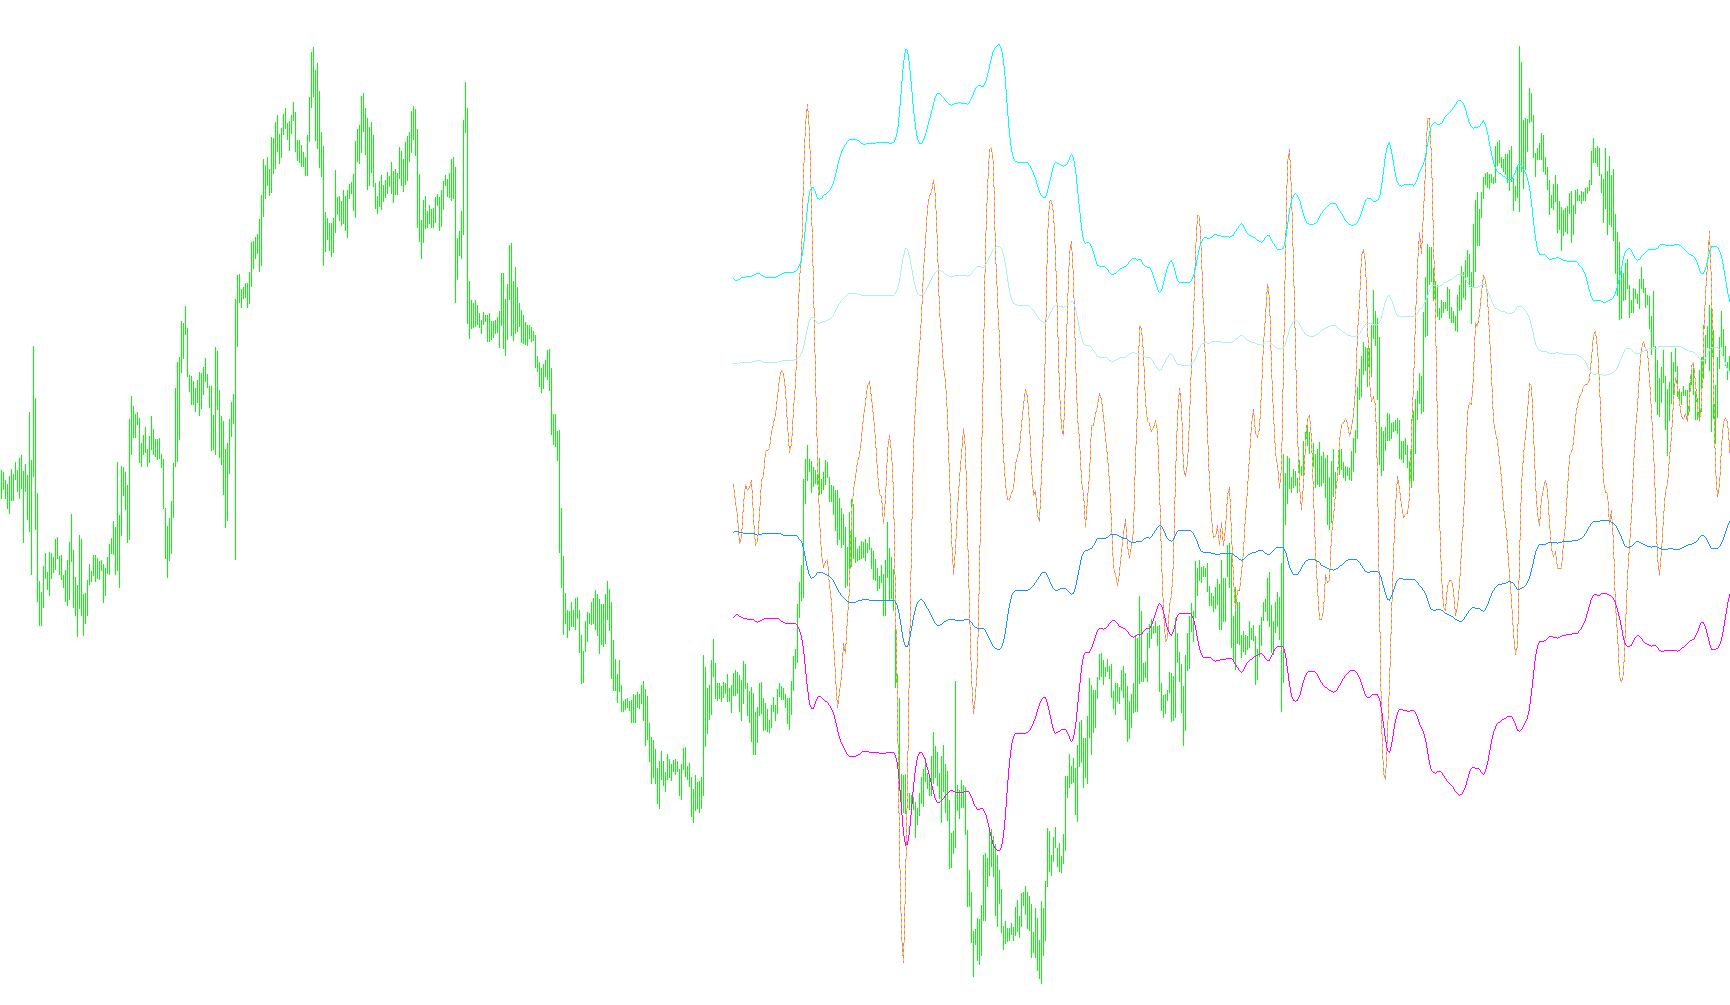
This technical script is designed as a custom market indicator for the MetaTrader platform. Its primary purpose is to analyze price movements by applying complex mathematical weighting to historical data to identify trends and volatility.
Core Logic Overview
The logic of this script revolves around three main phases: weighted calculation, averaging, and deviation measurement.
1. Weighted Price Analysis (The "CrazyChart" Function) At the heart of the script is a specific mathematical formula that looks back at the last 56 price bars. Instead of treating every bar equally, the script assigns a unique numerical "weight" to each individual bar. These weights range from positive to negative values, allowing the indicator to prioritize certain historical data points over others. By multiplying these weights against the closing prices and summing them up, the script produces a raw value that represents a sophisticated view of recent market momentum.
2. Data Smoothing and Averaging Once the individual weighted values are calculated, the script performs a multi-step averaging process:
- It calculates the average of these weighted values over a specific window (52 bars).
- It then compares the most recent weighted value against this 52-bar average.
- The difference between the current "instant" value and the long-term average determines the primary movement lines shown on your chart.
3. Volatility and Deviation Tracking Beyond just showing the direction of the trend, the script calculates "variance." It measures how much the individual weighted values fluctuate away from the calculated average.
- The script squares these differences to emphasize larger swings in price.
- It then takes the square root of these squared values to derive a standard deviation-style figure.
- This result is used to generate additional lines on the chart, which represent the "boundaries" or intensity of the price movement.
Visual Output
The script generates six different data buffers (lines) on a separate window:
- Trend Lines: These show the primary direction and position of the market based on the weighted average calculation.
- Boundary/Volatility Lines: These provide a visual representation of the price "spread." By plotting these at different multiples (such as double the standard deviation), the script helps traders visualize the area where the price is expected to oscillate, providing a sense of the current market's "stretch" or stability.
In summary, this tool transforms raw price data into a smoothed trend line while simultaneously mapping out the volatility boundaries by calculating how much the price tends to deviate from its own moving average.
//+------------------------------------------------------------------+
//|                                                        RBCI2.mq4 |
//|             Finware.ru 2003  . Indicator rewritten by CrazyChart |
//|                                    mailto:newcomer2003@yandex.ru |
//+------------------------------------------------------------------+
//double CrazyChart (int i,int shift);
#property copyright "Finware.ru 2003. Indicator rewritten by CrazyChart"
#property link      "mailto:newcomer2003@yandex.ru"
#define COMPANY_NAME "MyCompany Ltd."
#property indicator_separate_window
#property indicator_buffers 6
#property indicator_color1 Red
#property indicator_color2 Red
#property indicator_color3 Blue
#property indicator_color4 Aqua
#property indicator_color5 Crimson
#property indicator_color6 Gold
//---- input parameters
extern int       CountBars = 500;
extern int       ExtParam2;
extern int       ExtParam3;
extern double reddd;
//---- buffers
double ExtMapBuffer1[];
double ExtMapBuffer2[];
double ExtMapBuffer3[];
double ExtMapBuffer4[];
double ExtMapBuffer5[];
double ExtMapBuffer6[];
//+------------------------------------------------------------------+
//| Custom indicator initialization function                         |
//+------------------------------------------------------------------+
int init()
  {
//---- indicators
string short_name;
   IndicatorBuffers(6);
   SetIndexStyle(0,DRAW_LINE);
   SetIndexBuffer(0,ExtMapBuffer1);
   SetIndexEmptyValue(0,0.0);
   SetIndexDrawBegin(0,55);
   SetIndexStyle(1,DRAW_LINE,STYLE_DOT,1,Orchid);
   SetIndexBuffer(1,ExtMapBuffer2);
   SetIndexEmptyValue(1,0.0);
   SetIndexDrawBegin(1,55);
   SetIndexStyle(2,DRAW_LINE);
   SetIndexBuffer(2,ExtMapBuffer3);
   SetIndexEmptyValue(2,0.0);
   SetIndexDrawBegin(2,55);
   SetIndexStyle(3,DRAW_LINE);
   SetIndexBuffer(3,ExtMapBuffer4);
   SetIndexEmptyValue(3,0.0);
   SetIndexDrawBegin(3,55);
   SetIndexStyle(4,DRAW_LINE);
   SetIndexBuffer(4,ExtMapBuffer5);
   SetIndexEmptyValue(4,0.0);
   SetIndexDrawBegin(4,55);
   SetIndexStyle(5,DRAW_LINE);
   SetIndexBuffer(5,ExtMapBuffer6);
   SetIndexEmptyValue(5,0.0);
   SetIndexDrawBegin(5,55);
   IndicatorDigits(MarketInfo(Symbol(),MODE_DIGITS));
   IndicatorShortName("RBCI2");

//----

return(0);
  }
//+------------------------------------------------------------------+
//| Custor indicator deinitialization function                       |
//+------------------------------------------------------------------+
int deinit()
  {
//---- TODO: add your code here

//----
   return(0);
  }
//+------------------------------------------------------------------+
//| Ìîÿ ôóíêöèÿ âû÷èñëÿåò ïåðåìåííóþ ñ öèôðîâûì ôèëüòðîì             |
//+------------------------------------------------------------------+
double CrazyChart (int i,int shift)
//function that counts Sum of 55 bars
{
      double RBCI2;
      RBCI2=
-35.5198140000*Close[i+0+shift]
-29.3302904200*Close[i+1+shift]
-18.4253122700*Close[i+2+shift]
-5.3409716410*Close[i+3+shift]
+7.0224246110*Close[i+4+shift]
+16.1743143600*Close[i+5+shift]
+20.6539163900*Close[i+6+shift]
+20.3238589400*Close[i+7+shift]
+16.2679056100*Close[i+8+shift]
+10.3508317200*Close[i+9+shift]
+4.5956464710*Close[i+10+shift]
+0.5816210219*Close[i+11+shift]
-0.9556878591*Close[i+12+shift]
-0.2188650350*Close[i+13+shift]
+1.8617718350*Close[i+14+shift]
+4.0429772970*Close[i+15+shift]
+5.2336026320*Close[i+16+shift]
+4.8503271170*Close[i+17+shift]
+2.9598818100*Close[i+18+shift]
+0.1813422994*Close[i+19+shift]
-2.5916583950*Close[i+20+shift]
-4.5352277420*Close[i+21+shift]
-5.1799911240*Close[i+22+shift]
-4.5414039780*Close[i+23+shift]
-3.0665332280*Close[i+24+shift]
-1.4306935910*Close[i+25+shift]
-0.2740625440*Close[i+26+shift]
+0.0259294264*Close[i+27+shift]
-0.5361336393*Close[i+28+shift]
-1.6274205570*Close[i+29+shift]
-2.7320093940*Close[i+30+shift]
-3.3584444990*Close[i+31+shift]
-3.2210950120*Close[i+32+shift]
-2.3321664220*Close[i+33+shift]
-0.9758039283*Close[i+34+shift]
+0.4132087314*Close[i+35+shift]
+1.4199522360*Close[i+36+shift]
+1.7965291580*Close[i+37+shift]
+1.5408713520*Close[i+38+shift]
+0.8768248011*Close[i+39+shift]
+0.1561692145*Close[i+40+shift]
-0.2796045774*Close[i+41+shift]
-0.2243863077*Close[i+42+shift]
+0.3279264464*Close[i+43+shift]
+1.1886385970*Close[i+44+shift]
+2.0574048450*Close[i+45+shift]
+2.6265630350*Close[i+46+shift]
+2.6969364910*Close[i+47+shift]
+2.2285276520*Close[i+48+shift]
+1.3534844570*Close[i+49+shift]
+0.3088511323*Close[i+50+shift]
-0.6383119873*Close[i+51+shift]
-1.2763116980*Close[i+52+shift]
-1.5134175380*Close[i+53+shift]
-1.3771978870*Close[i+54+shift]
-1.6154244060*Close[i+55+shift];
return (RBCI2);
  }

int start()
  {
   int    limit,counted_bars=IndicatorCounted(),min,i;
    if (CountBars>=Bars) CountBars=Bars;
   SetIndexDrawBegin(0,Bars-CountBars);
   SetIndexDrawBegin(1,Bars-CountBars);
   SetIndexDrawBegin(2,Bars-CountBars);
   SetIndexDrawBegin(3,Bars-CountBars);
   SetIndexDrawBegin(4,Bars-CountBars);
   SetIndexDrawBegin(5,Bars-CountBars);

   double RBCI2;
   double Value1;
   int Value2 = 52;
   double Value4,Value5,Value6,Value7,Value8,Value9;

   //  reddd = CrazyChart(2,1); //c hf,jnfkj!!!!!!!!!!!!!!!!!


   if (counted_bars<0) return(-1);
//---- last counted bar will be recounted
   if (counted_bars>0) counted_bars--;

   limit=Bars-counted_bars;
   for(i=1;i<=0;i++) ExtMapBuffer1[Bars-i]=0.0;

   for (i=limit;i>=0;i--) {
   // CountBars i+shift+55
      for (int shift=0;shift<=Value2-1;shift++) {
         Value4 = Value4-CrazyChart(i,shift);
      }

      Value1 = -CrazyChart(i,0);
      Value5 = Value4 / Value2;
      Value6 = 0;
      ExtMapBuffer1[i]=-Value5+Value1;// "RBCI2");
      ExtMapBuffer2[i]=-Value5+Value1; //"Dots")
      for (shift=0;shift<=Value2-1;shift++) {
         Value6 = Value6 + (-CrazyChart(i,shift)-Value5)*(-CrazyChart(i,shift)-Value5);
      }
      Value8 = Value6/(Value2-1);
      Value9 = MathSqrt(Value8);
      ExtMapBuffer3[i]= +Value9;//,"LINE");
      ExtMapBuffer4[i]= -1*Value9;//Plot4(-Value9,"LINE");
      ExtMapBuffer5[i]=+2*Value9;//,"LINE");
      ExtMapBuffer6[i]=-2*Value9;//,"LINE");
      Value4=0;
      Value6=0;
}
//----
   return(0);
  }
//+------------------------------------------------------------------+
Comments