RD-BT2Stop_v1
Download script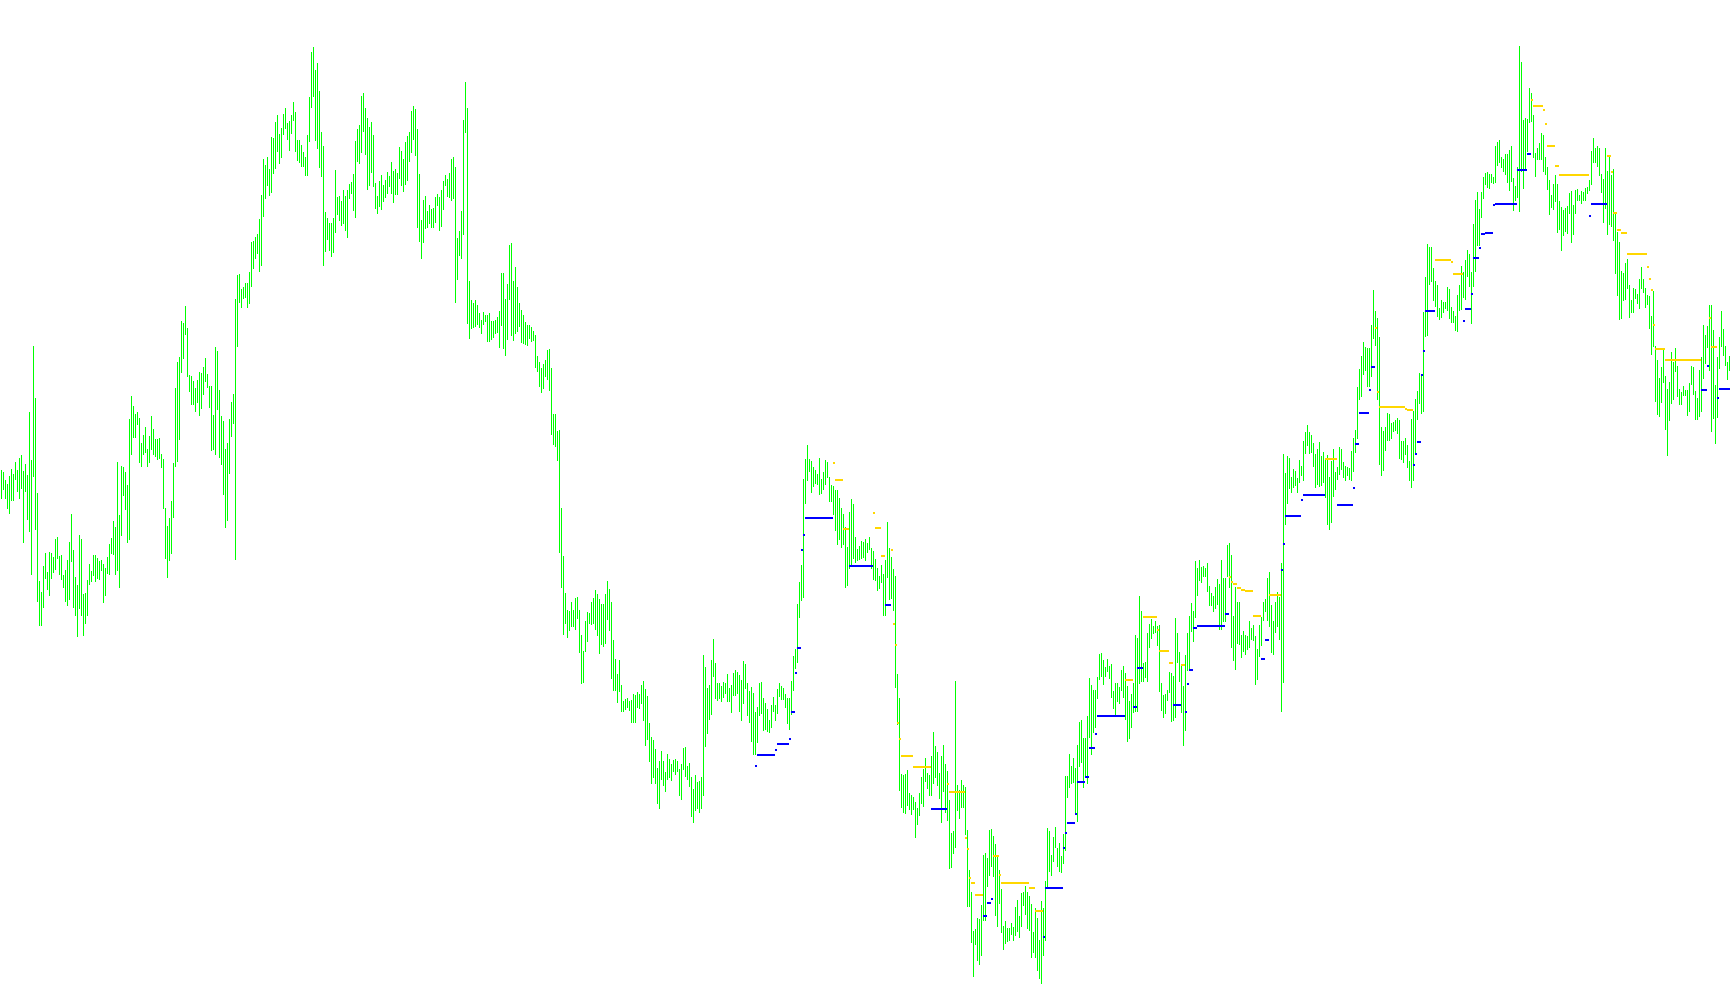
The BrainTrend1Stop tool is designed to help traders visualize and follow the prevailing direction of the market by identifying primary trends and providing a dynamic reference point for price movement. Instead of just looking at raw price fluctuations, this script calculates a "buffer zone" based on recent market volatility to determine when a trend has truly shifted.
How it Works
The logic follows a systematic process to filter out minor market noise and highlight significant directional changes:
- Volatility Measurement: The script first analyzes a specific number of previous candles (defined by the user) to calculate the "Average Range." It looks at the distance between the highs and lows of those candles. By doing this, the tool understands how much the price typically swings in the current market environment.
- Trend Detection: Based on that volatility, it establishes a threshold. If the market is moving upward, the script tracks the highest points reached; if it is moving downward, it tracks the lowest points.
- Dynamic Adjustment: The tool doesn't just look at a fixed price. It calculates a "Value" based on the current trend and the volatility. For example, in an uptrend, it sets a boundary slightly below the current high. If the price drops significantly enough to break through this calculated boundary, the script recognizes that the trend has likely reversed.
- Visual Representation: The logic continuously updates as new data comes in:
- When the market is in an uptrend, it plots a specific signal (represented by blue markers) to show the current trajectory.
- When the market shifts into a downtrend, it switches to a different signal (represented by red markers) to alert the user of the change in momentum.
Key Takeaways for Traders
Essentially, this script acts as a "trend stabilizer." Rather than reacting to every small tick or minor price wiggle, it waits for the price to move enough to justify a trend change based on recent history. It provides a clearer picture of whether the market is currently favoring the bulls (buyers) or the bears (sellers), helping traders stay aligned with the primary flow of the market.
/*-----------------------------+
|			       |
| Shared by www.Aptrafx.com    |
|			       |
+------------------------------*/

//+-----------------------------------------------------------------------+
//|                                                   BrainTrend1Stop.mq4 |
//|                                   Copyright © 2005. Alejandro Galindo |
//|                                                   http://elCactus.com |
//+-----------------------------------------------------------------------+

#property indicator_chart_window
#property indicator_buffers 2
#property indicator_color1 Red
#property indicator_color2 Blue

//---- input parameters
extern int AveragePeriod= 10;
extern int Reg= 1;

//---- buffers
double Buffer1[];
double Buffer2[];


//+------------------------------------------------------------------+
//| Custom indicator initialization function                         |
//+------------------------------------------------------------------+
int init()
{
   //---- indicator line
   IndicatorBuffers(2);

   SetIndexStyle(0,DRAW_ARROW);
   SetIndexBuffer(0,Buffer1);
   SetIndexArrow(0,158);

   SetIndexStyle(1,DRAW_ARROW);
   SetIndexBuffer(1,Buffer2);
   SetIndexArrow(1,158);

   //----
   return(0);
}

//+------------------------------------------------------------------+
//| BrainTrend1Stop                                                  |
//+------------------------------------------------------------------+
int start()
{

   int i,shift,counted_bars=IndicatorCounted();
   double value=0, price=0, trend=0, dK=0, AvgRange=0, WATR=0;
   int bar=0;
   int CountBars= 500;
   if (CountBars>=Bars) CountBars=Bars;

   SetIndexDrawBegin(0,Bars-CountBars+11+1);
   SetIndexDrawBegin(1,Bars-CountBars+11+1);

   //---- initial zero
   AvgRange=0;
   for (i=1;i<=AveragePeriod;i++)
   {
      dK = 1+(AveragePeriod-i)/AveragePeriod;
      AvgRange=AvgRange+ dK*MathAbs(High[i]-Low[i]);
   }

   if (Point>=0.01) { WATR = (AvgRange/AveragePeriod)*Point; }
   else { WATR = AvgRange/AveragePeriod; }

   if (Close[Bars-1] > Open[Bars-1])
   {
      value = Close[Bars - 1] * (1 - WATR);
      trend = 1;
      Buffer2[Bars-1]=value;
   }

   if (Close[Bars-1] < Open[Bars-1])
   {
      value = Close[Bars - 1] * (1 + WATR);
      trend = -1;
      Buffer1[Bars-1]=value;
   }


   bar=CountBars-11-1;
   while(bar>=0)
   {

      Buffer1[bar]=0;   // fixed, was: Buffer1[shift]=0;
      Buffer2[bar]=0;   // fixed, was: Buffer2[shift]=0;

      if (Reg==2)
      {
         AvgRange=0;
         for (i=1;i<=AveragePeriod;i++)
         {
            dK = 1+(AveragePeriod-i)/AveragePeriod;
            AvgRange=AvgRange+ dK*MathAbs(High[bar + i]-Low[bar + i]);
         }
         if (Point>=0.01) { WATR = (AvgRange/AveragePeriod)*Point; }
         else { WATR = AvgRange/AveragePeriod; }

      }

      if (trend >= 0) {

         if (Close[bar] > price) { price = Close[bar]; }
         value = price * (1 - WATR);

         if (Close[bar] < value)
         {
             price = Close[bar];
             value = price * (1 + WATR);
             trend = -1;
         }
       }
       else
       if (trend <= 0) {

            if (Close[bar] < price) { price = Close[bar]; }
            value = price * (1 + WATR);

            if (Close[bar] > value)
            {
                price = Close[bar];
               value = price * (1 - WATR);
               trend = 1;
            }
       }

      if (trend == -1) { Buffer1[bar]=value; }
      if (trend == 1) { Buffer2[bar]=value; }

      bar--;
   }

   return(0);
}

//+------------------------------------------------------------------+
Comments