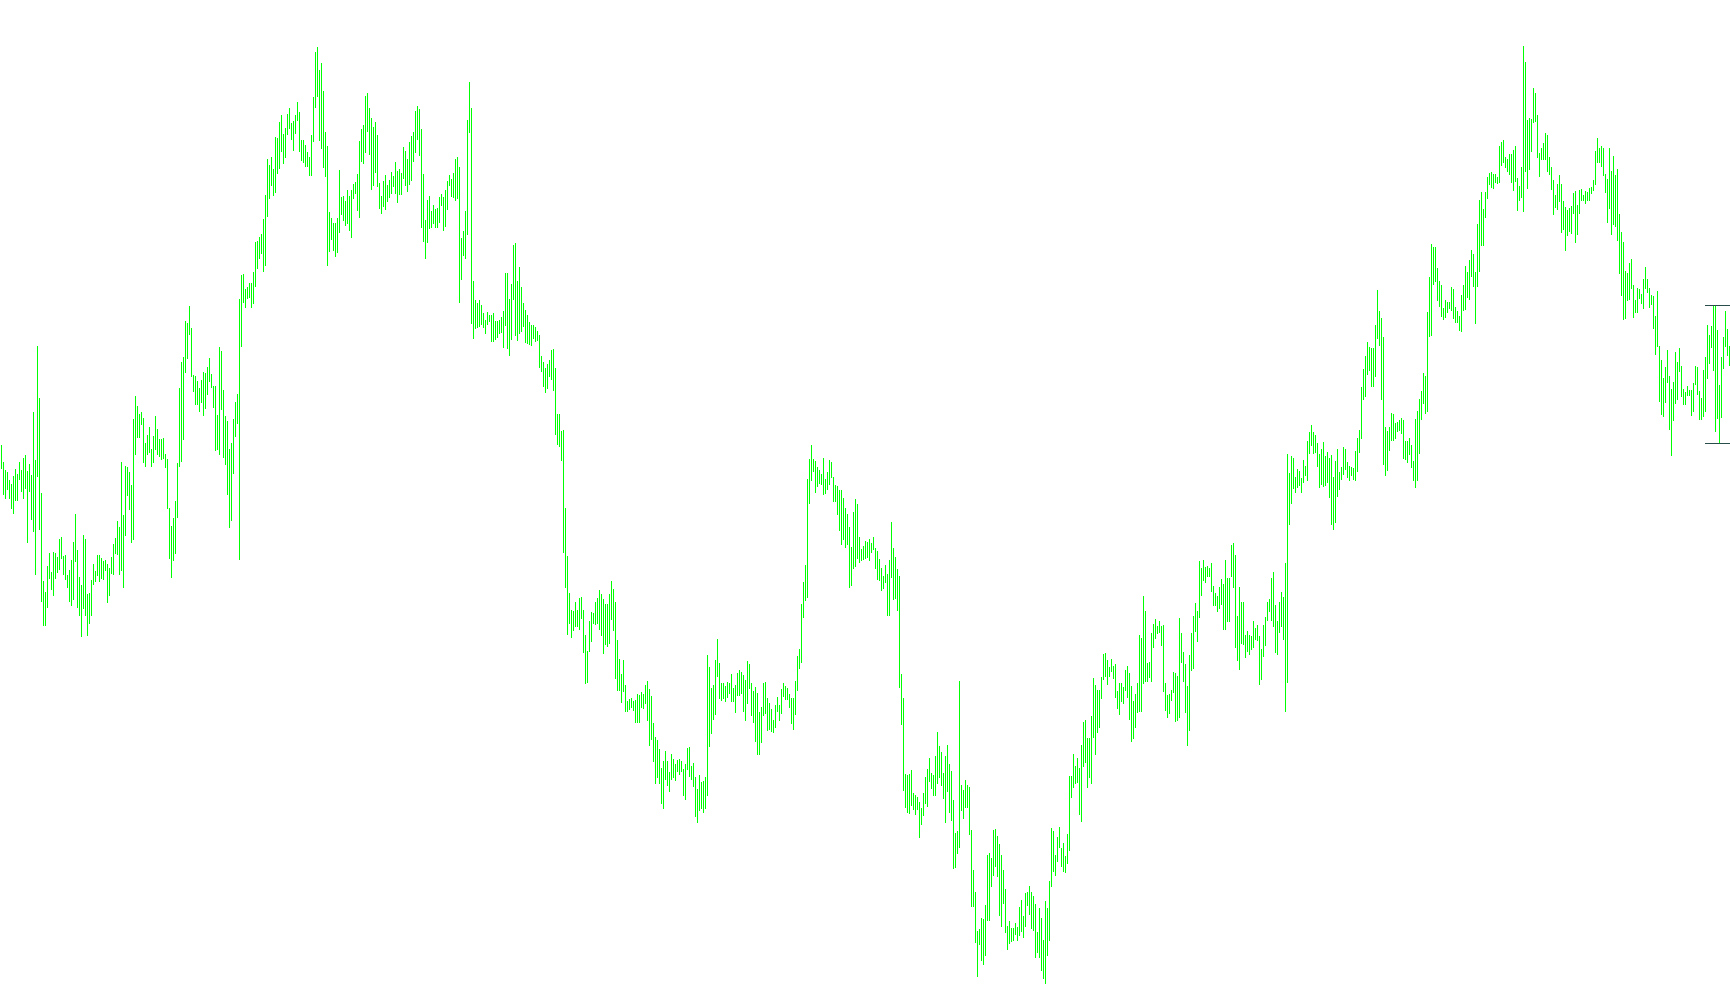
Price_BarsM2_MTF_v1
Indicator

Price_BarsM2_MTF_v1

This indicator projects high-level price action data, specifically capturing the open, close, high, and low extremes of a superior timeframe onto the current chart.

Price_Bars_MTF
Indicator

Price_Bars_MTF

This indicator maps and visualizes the opening, closing, high, and low price boundaries of a specified higher timeframe onto the current chart for concurrent structural analysis.

Price_Distribution
Indicator

Price_Distribution

This indicator identifies specific time-based price ranges and visualizes the frequency of price action concentration through a bucketed distribution histogram.

Price_Line_Alert
Indicator

Price_Line_Alert

This indicator projects horizontal boundary lines based on current spread volatility and triggers audio alerts when market price penetrates the specified pip distance of these calculated thresholds.

Price_main
Indicator

Price_main

This indicator identifies structural momentum shifts by detecting simultaneous high and low price equilibrium points within Heiken Ashi price action.

Price_Monitor-v2
Indicator

Price_Monitor-v2

This indicator renders real-time arrow objects that track and project the current Ask/Bid price movement based on temporal bar intervals.

price_O-Cl
Indicator

price_O-Cl

This indicator visualizes the raw price movement of each individual candle by plotting positive and negative real-body expansion as a dual-color histogram.

price_prevCl-O
Indicator

price_prevCl-O

This indicator quantifies price movement by calculating the arithmetic difference between current open prices and previous closing prices, visualized as a directional histogram.

price_prevCl-O_Difference2_cw
Indicator

price_prevCl-O_Difference2_cw

This indicator calculates the absolute point difference between the current candle's open price and the previous candle's closing price to display real-time directional volatility.

Price_Range
Indicator

Price_Range

This indicator quantifies the point-based displacement of high, low, and closing prices relative to the opening price over a fixed historical window.

Price_Range_hhll
Indicator

Price_Range_hhll

This indicator calculates the normalized point-based deviation of the highest, lowest, and closing prices relative to a specific historical opening price over a defined lookback period.

Price_Range_HLClMd
Indicator

Price_Range_HLClMd

The indicator quantifies relative price deviations by calculating the distance between the session opening price and its historical high, low, and closing extremes over a fixed period.

Price_Range_HLClMdz
Indicator

Price_Range_HLClMdz

This indicator quantifies the variance between current high, low, and closing prices relative to a historical opening benchmark, normalized against their collective midpoint.

Price_Range_HLClMdzlv
Indicator

Price_Range_HLClMdzlv

This indicator calculates the deviation of high, low, and closing prices from a dynamic midpoint established by the historical price range relative to the opening price.

Price_v1
Indicator

Price_v1

This indicator recalculates price action into a modified candlestick format by mapping high-low extremes and open-close values to filter out market noise.

Price_v2
Indicator

Price_v2

This indicator transforms standard price action into Heiken Ashi candles by smoothing out price fluctuations to reveal underlying trend direction and volatility.

Priliv
Indicator

Priliv

iMA

This indicator projects trend momentum by calculating the rate of change between weighted moving averages across current, adjacent, and subsequent higher timeframes.

Priliv_001
Indicator

Priliv_001

iMA

This indicator calculates the variance between current and offset Linear Weighted Moving Averages across multiple timeframes to identify momentum shifts.

Priliv_s
Indicator

Priliv_s

iMA

This indicator calculates the momentum velocity of trends across three distinct temporal horizons by measuring the delta between linear weighted moving averages at varying historical offsets.

Priliv_sw
Indicator

Priliv_sw

iMA

This indicator calculates and visualizes trend velocity across multiple temporal scales by measuring the differential shift of Linear Weighted Moving Averages.

Priliv_s_v1
Indicator

Priliv_s_v1

iMA

This indicator calculates and visualizes trend velocity across multiple timeframes by measuring the differential displacement of linear weighted moving averages.

Indicator

Priliv_v1

iMA
Indicator

Priliv_v2

iMA
PrintText
Indicator

PrintText

A sequential graphical script that renders multi-colored text labels across various chart zones, executes an automated countdown timer with audio feedback, and performs a final color-cycling status notification.

pro
Indicator

pro

iMAiMAOnArray

This indicator quantifies the percentage difference between fast and slow exponential moving averages to identify momentum shifts and crossover signals.

Pro4x Pivot Lines
Indicator

Pro4x Pivot Lines

This indicator dynamically plots traditional floor pivots, Camarilla range levels, and subdivided midpoint zones based on historical daily price action.

Pro4x Pivot Lines_v1
Indicator

Pro4x Pivot Lines_v1

This indicator dynamically plots daily pivot levels, Camarilla range boundaries, and fractional midpoints using yesterday's price action to identify key supply and demand zones.

proba demark
Indicator

proba demark

Identifies structural trend reversals by detecting consecutive three-bar price fluctuations where both closing and extreme values align in a specific direction.

proba demark2
Indicator

proba demark2

Identifies localized price structural shifts by detecting consecutive multi-bar increases or decreases in both high and low boundaries across a historical deep-scan range.

Probability Density Function
Indicator

Probability Density Function

iStochastic

This indicator quantifies market momentum by mapping the frequency distribution of Stochastic values into a normalized histogram to visualize price velocity and density.

Indicator

ProbMeter_v1.1

iCCIiMACDiADXiMA
Indicator

Proboy_zIG_demo

Indicator

Profit (ZigZag)

Indicator

profitcalc_graphical

ProfitChart
Indicator

ProfitChart

This indicator calculates and visualizes the cumulative price action variance across multiple currency pairs to determine synchronized bullish and bearish momentum.

profitgraphBUY
Indicator

profitgraphBUY

This indicator monitors and visualizes the real-time floating profit of up to seven individual buy orders in pips within a separate window.

profitgraphSELL
Indicator

profitgraphSELL

This indicator quantifies the price distance of active sell orders relative to current market asks across multiple positions.

ProfitReachedSnippet
Indicator

ProfitReachedSnippet

This script utilizes global variables to persist a profit-achieved state across sessions, preventing new trade execution once a specific gain threshold is met.

profitsignalalert~
Indicator

profitsignalalert~

iBandsiMACD

This indicator identifies high-velocity market entries by correlating accelerated MACD rate changes against Bollinger Band expansion and minimum price volatility thresholds.

profit_and_drawdown
Indicator

profit_and_drawdown

Visualizes the real-time cumulative profit and drawdown of all active open positions on a separate graphical window.

Indicator

Project1

PROvidets
Indicator

PROvidets

This script identifies a specific historical timestamp and calculates linear regression coefficients based on the closing prices of the preceding bars to determine price trends.

prusax_v6
Indicator

prusax_v6

This indicator visualizes the mathematical midpoint and directional variance between price extremes and body centers to identify structural balance shifts.

prusax_v61
Indicator

prusax_v61

The logic maps candle body dynamics and price extremes to distinct histogram zones by isolating high-low boundaries based on bullish and bearish price action.

prusax_v61_v1
Indicator

prusax_v61_v1

This indicator visualizes directional momentum by mapping bullish and bearish extremes against real-time candle body dynamics.

prusax_v8
Indicator

prusax_v8

This indicator quantifies directional pressure by calculating the delta between upper-range price expansion and lower-range compression across each candle.

Indicator

PSAR_2c_MTF_cw

iSAR
Indicator

PSAR_2c_MTF_sw

iSAR
Indicator

PSar_MTF_sw

iSAR
PS_Calculator
Indicator

PS_Calculator

This tool calculates multiple corresponding lot sizes and real-time risk exposures based on predefined stop-loss thresholds relative to total account equity.