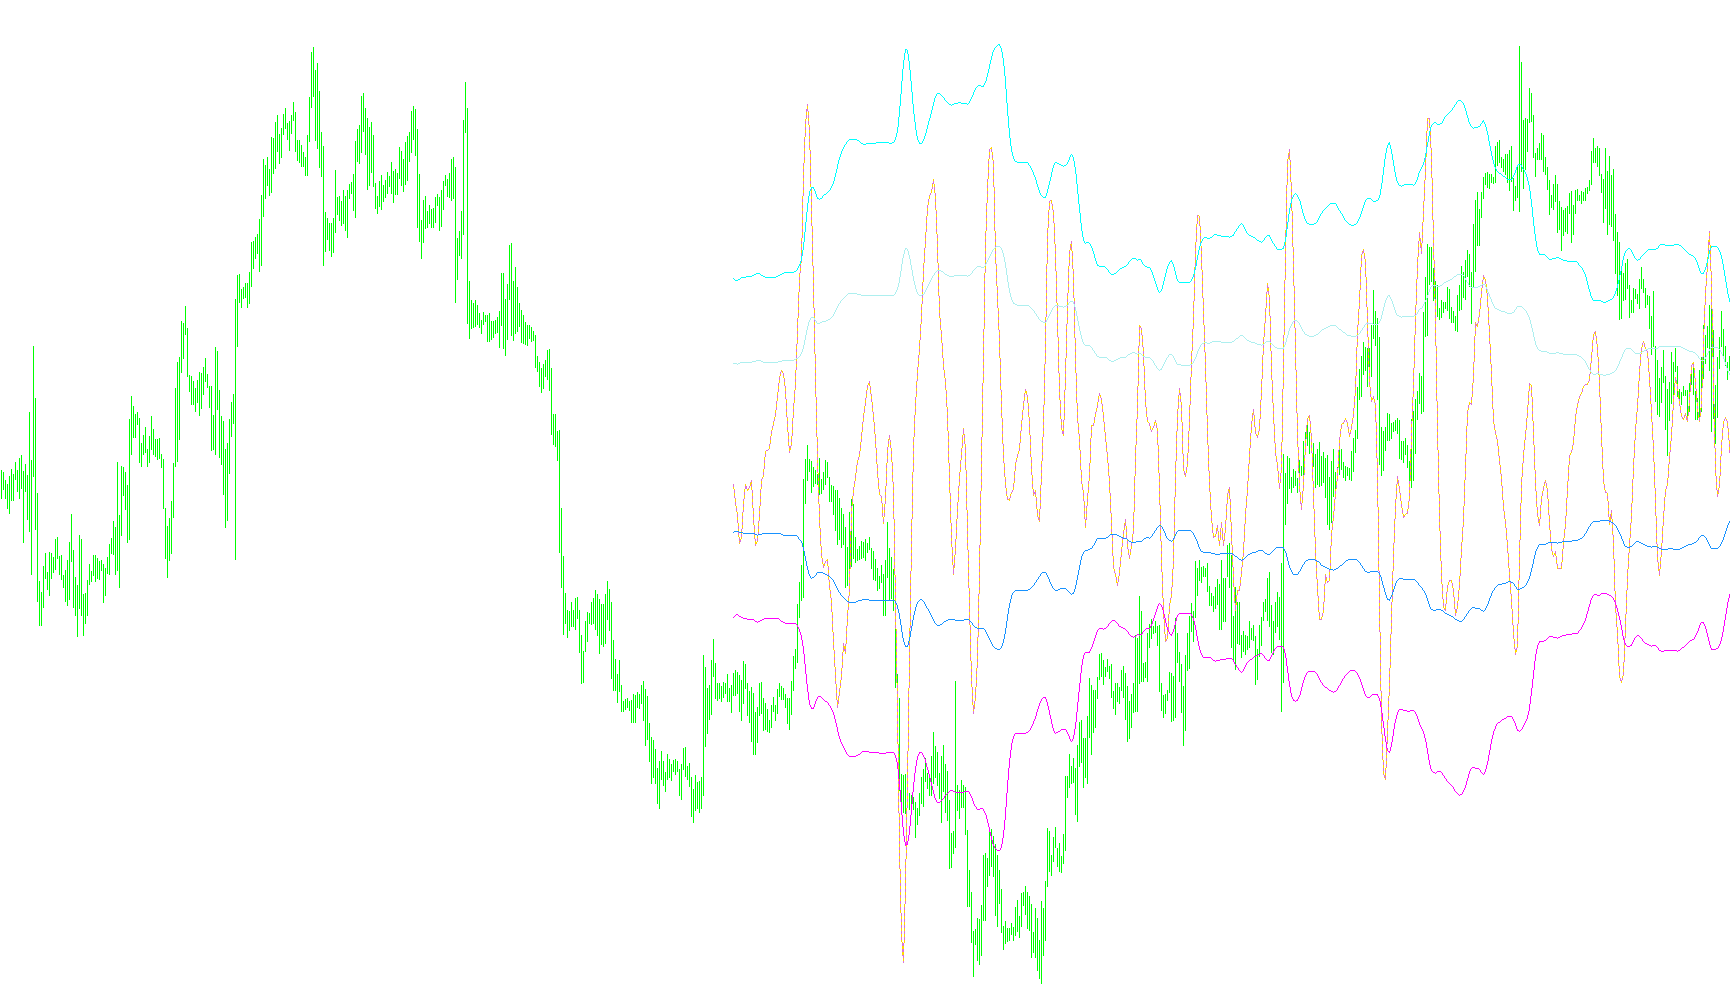
This script is a specialized technical analysis tool designed to provide traders with a visual representation of price momentum and volatility. It operates by performing complex mathematical calculations on historical price data to create several distinct visual indicators within a separate window on the trading platform.
Core Calculation Logic
The foundation of this tool is a custom weighted calculation based on the closing prices of the last 55 bars. Instead of using a simple moving average where every day has equal weight, this script assigns a specific unique multiplier to each of the previous 55 periods. This means that some recent price points have a much stronger influence on the final result than others, allowing the indicator to be highly sensitive to specific historical patterns.
Data Processing and Smoothing
Once the primary weighted value is established, the script performs several layers of secondary processing:
- Averaging and Offsetting: The tool looks back over a window of 52 periods to calculate an average of these weighted values. It then compares the current weighted value against this long-term average to determine the "distance" or deviation from the norm.
- Standard Deviation Analysis: The script calculates the variance across those same 52 periods. By taking the square root of this variance, it identifies the volatility of the price movement. This allows the tool to measure how much the price is "swinging" relative to its average behavior.
Visual Outputs
The logic produces six different data streams, which are displayed to the user in various styles (such as solid lines and dotted lines) to represent different aspects of market behavior:
- Primary Trend Lines: These visualize the relationship between the current weighted price and its historical average. They show the immediate direction of the market movement.
- Volatility Boundaries: The script uses the standard deviation results to plot upper and lower "bounds." By multiplying these values (e.g., by a factor of 2), it creates a visual channel. These lines act as dynamic zones; when price action moves significantly toward or beyond these boundaries, it often indicates extreme market conditions or potential reversal points.
Summary for the User
In essence, this script filters out "noise" from the market by using a weighted historical lens. It then identifies where the current price sits in relation to its average history and measures how violently that price is moving. For a trader, this provides a visual map of both the current trend direction and the intensity of the market's volatility.
//+------------------------------------------------------------------+
//|                                                        RBCI2.mq4 |
//|             Finware.ru 2003  . Indicator rewritten by CrazyChart |
//|                                    mailto:newcomer2003@yandex.ru |
//+------------------------------------------------------------------+
//double CrazyChart (int i,int shift);
#property copyright "Finware.ru 2003. Indicator rewritten by CrazyChart"
#property link      "mailto:newcomer2003@yandex.ru"
#define COMPANY_NAME "MyCompany Ltd."
#property indicator_separate_window
#property indicator_buffers 6
#property indicator_color1 Red
#property indicator_color2 Red
#property indicator_color3 Blue
#property indicator_color4 Aqua
#property indicator_color5 Crimson
#property indicator_color6 Gold
//---- input parameters
extern int       CountBars = 500;
extern int       ExtParam2;
extern int       ExtParam3;
extern double reddd;
//---- buffers
double ExtMapBuffer1[];
double ExtMapBuffer2[];
double ExtMapBuffer3[];
double ExtMapBuffer4[];
double ExtMapBuffer5[];
double ExtMapBuffer6[],val4[];
//+------------------------------------------------------------------+
//| Custom indicator initialization function                         |
//+------------------------------------------------------------------+
int init()
  {
//---- indicators
string short_name;
   IndicatorBuffers(7);
   SetIndexStyle(0,DRAW_LINE);
   SetIndexBuffer(0,ExtMapBuffer1);
   SetIndexEmptyValue(0,0.0);
   SetIndexDrawBegin(0,55);
   SetIndexStyle(1,DRAW_LINE,STYLE_DOT,1,Orchid);
   SetIndexBuffer(1,ExtMapBuffer2);
   SetIndexEmptyValue(1,0.0);
   SetIndexDrawBegin(1,55);
   SetIndexStyle(2,DRAW_LINE);
   SetIndexBuffer(2,ExtMapBuffer3);
   SetIndexEmptyValue(2,0.0);
   SetIndexDrawBegin(2,55);
   SetIndexStyle(3,DRAW_LINE);
   SetIndexBuffer(3,ExtMapBuffer4);
   SetIndexEmptyValue(3,0.0);
   SetIndexDrawBegin(3,55);
   SetIndexStyle(4,DRAW_LINE);
   SetIndexBuffer(4,ExtMapBuffer5);
   SetIndexEmptyValue(4,0.0);
   SetIndexDrawBegin(4,55);
   SetIndexStyle(5,DRAW_LINE);
   SetIndexBuffer(5,ExtMapBuffer6);
   SetIndexEmptyValue(5,0.0);
   SetIndexDrawBegin(5,55);
   IndicatorDigits(MarketInfo(Symbol(),MODE_DIGITS));
   IndicatorShortName("RBCI2");
   SetIndexBuffer(6,val4);

//----

return(0);
  }
//+------------------------------------------------------------------+
//| Custor indicator deinitialization function                       |
//+------------------------------------------------------------------+
int deinit()
  {
//---- TODO: add your code here

//----
   return(0);
  }
//+------------------------------------------------------------------+
//| Ìîÿ ôóíêöèÿ âû÷èñëÿåò ïåðåìåííóþ ñ öèôðîâûì ôèëüòðîì             |
//+------------------------------------------------------------------+
double CrazyChart (int i,int shift)
//function that counts Sum of 55 bars
{
      double RBCI2;
      RBCI2=
-35.5198140000*Close[i+0+shift]
-29.3302904200*Close[i+1+shift]
-18.4253122700*Close[i+2+shift]
-5.3409716410*Close[i+3+shift]
+7.0224246110*Close[i+4+shift]
+16.1743143600*Close[i+5+shift]
+20.6539163900*Close[i+6+shift]
+20.3238589400*Close[i+7+shift]
+16.2679056100*Close[i+8+shift]
+10.3508317200*Close[i+9+shift]
+4.5956464710*Close[i+10+shift]
+0.5816210219*Close[i+11+shift]
-0.9556878591*Close[i+12+shift]
-0.2188650350*Close[i+13+shift]
+1.8617718350*Close[i+14+shift]
+4.0429772970*Close[i+15+shift]
+5.2336026320*Close[i+16+shift]
+4.8503271170*Close[i+17+shift]
+2.9598818100*Close[i+18+shift]
+0.1813422994*Close[i+19+shift]
-2.5916583950*Close[i+20+shift]
-4.5352277420*Close[i+21+shift]
-5.1799911240*Close[i+22+shift]
-4.5414039780*Close[i+23+shift]
-3.0665332280*Close[i+24+shift]
-1.4306935910*Close[i+25+shift]
-0.2740625440*Close[i+26+shift]
+0.0259294264*Close[i+27+shift]
-0.5361336393*Close[i+28+shift]
-1.6274205570*Close[i+29+shift]
-2.7320093940*Close[i+30+shift]
-3.3584444990*Close[i+31+shift]
-3.2210950120*Close[i+32+shift]
-2.3321664220*Close[i+33+shift]
-0.9758039283*Close[i+34+shift]
+0.4132087314*Close[i+35+shift]
+1.4199522360*Close[i+36+shift]
+1.7965291580*Close[i+37+shift]
+1.5408713520*Close[i+38+shift]
+0.8768248011*Close[i+39+shift]
+0.1561692145*Close[i+40+shift]
-0.2796045774*Close[i+41+shift]
-0.2243863077*Close[i+42+shift]
+0.3279264464*Close[i+43+shift]
+1.1886385970*Close[i+44+shift]
+2.0574048450*Close[i+45+shift]
+2.6265630350*Close[i+46+shift]
+2.6969364910*Close[i+47+shift]
+2.2285276520*Close[i+48+shift]
+1.3534844570*Close[i+49+shift]
+0.3088511323*Close[i+50+shift]
-0.6383119873*Close[i+51+shift]
-1.2763116980*Close[i+52+shift]
-1.5134175380*Close[i+53+shift]
-1.3771978870*Close[i+54+shift]
-1.6154244060*Close[i+55+shift];
return (RBCI2);
  }

int start()
  {
   int    limit,counted_bars=IndicatorCounted(),min,i;
    if (CountBars>=Bars) CountBars=Bars;
   SetIndexDrawBegin(0,Bars-CountBars);
   SetIndexDrawBegin(1,Bars-CountBars);
   SetIndexDrawBegin(2,Bars-CountBars);
   SetIndexDrawBegin(3,Bars-CountBars);
   SetIndexDrawBegin(4,Bars-CountBars);
   SetIndexDrawBegin(5,Bars-CountBars);

   double RBCI2;
   double Value1;
   int Value2 = 52;
   double Value4,Value5,Value6,Value7,Value8,Value9;

   //  reddd = CrazyChart(2,1); //c hf,jnfkj!!!!!!!!!!!!!!!!!


   if (counted_bars<0) return(-1);
//---- last counted bar will be recounted
   if (counted_bars>0) counted_bars--;

   limit=Bars-counted_bars;

   for (i=limit;i>=0;i--) {
   // CountBars i+shift+55
      val4[i]=CrazyChart(i,0);
      for (int shift=0;shift<=Value2-1;shift++) {
         //Value4 = Value4-CrazyChart(i,shift);
         Value4 = Value4-val4[i+shift];
      }

      Value1 = -val4[i];
      Value5 = Value4 / Value2;
      Value6 = 0;
      ExtMapBuffer1[i]=-Value5+Value1;// "RBCI2");
      ExtMapBuffer2[i]=-Value5+Value1; //"Dots")
      for (shift=0;shift<=Value2-1;shift++) {
         //Value6 = Value6 + (-CrazyChart(i,shift)-Value5)*(-CrazyChart(i,shift)-Value5);
         Value6 = Value6 + (-val4[i+shift]-Value5)*(-val4[i+shift]-Value5);
      }
      Value8 = Value6/(Value2-1);
      Value9 = MathSqrt(Value8);
      ExtMapBuffer3[i]= +Value9;//,"LINE");
      ExtMapBuffer4[i]= -1*Value9;//Plot4(-Value9,"LINE");
      ExtMapBuffer5[i]=+2*Value9;//,"LINE");
      ExtMapBuffer6[i]=-2*Value9;//,"LINE");
      Value4=0;
      Value6=0;
}
//----
   return(0);
  }
//+------------------------------------------------------------------+
Comments