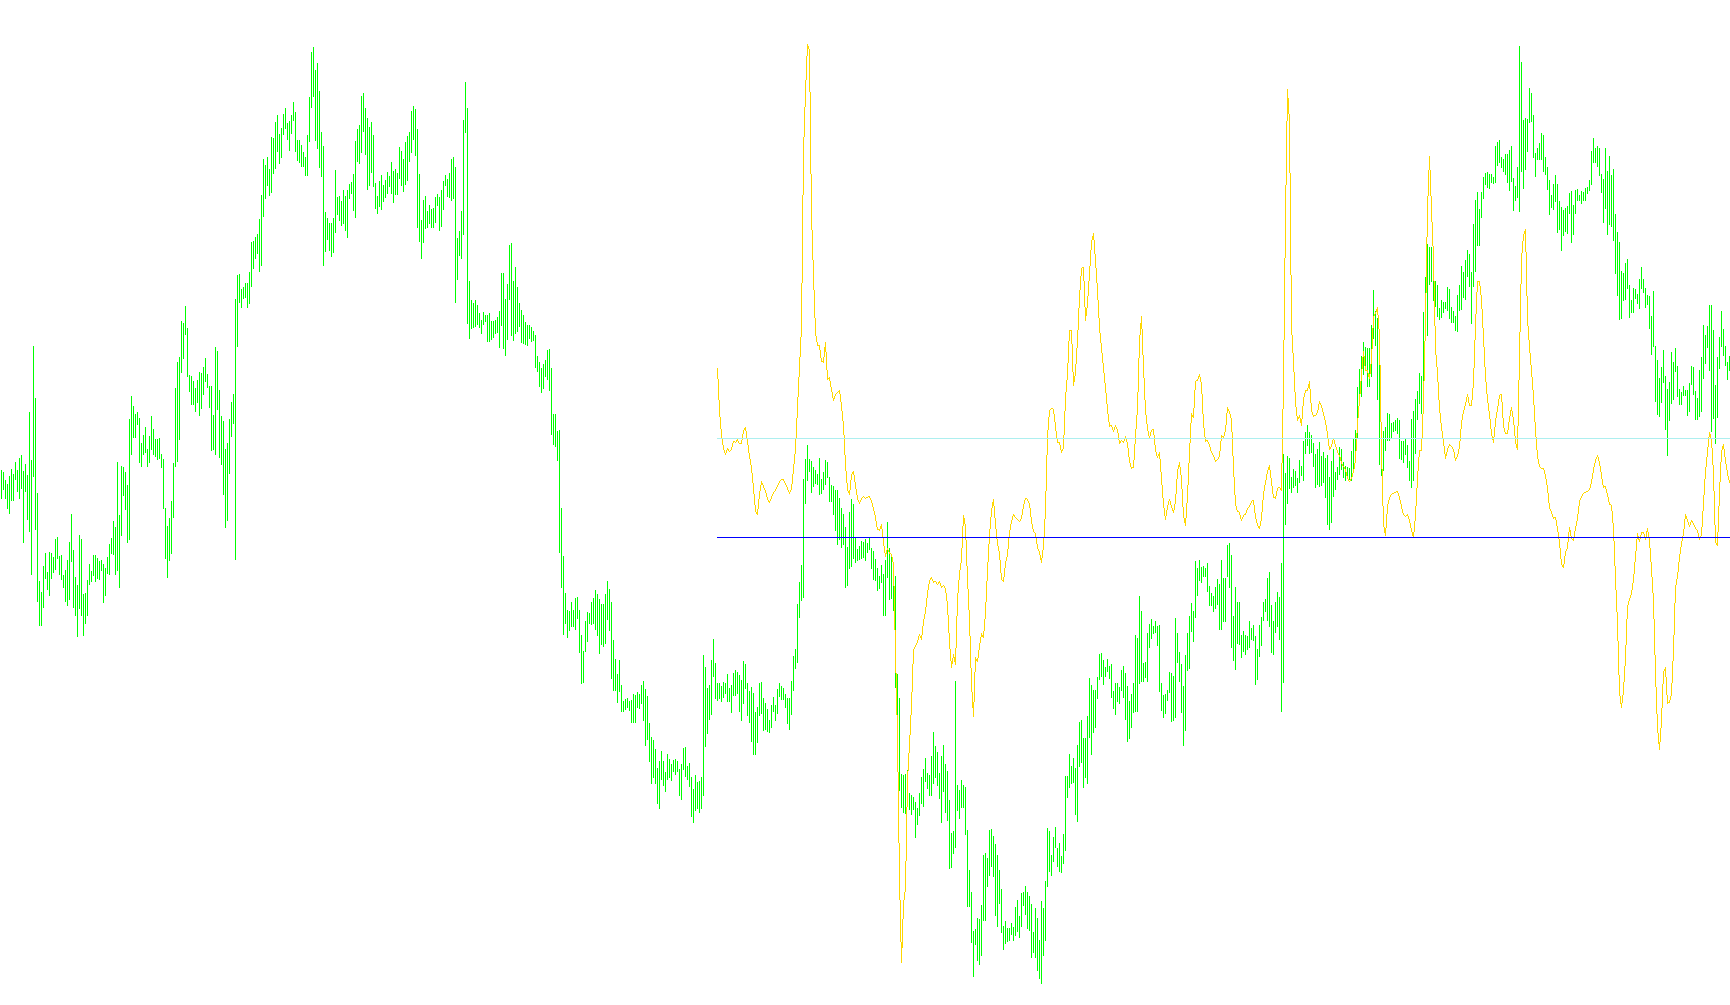
Rads HAS-1
Indicator

Rads HAS-1

iMAiMAOnArray

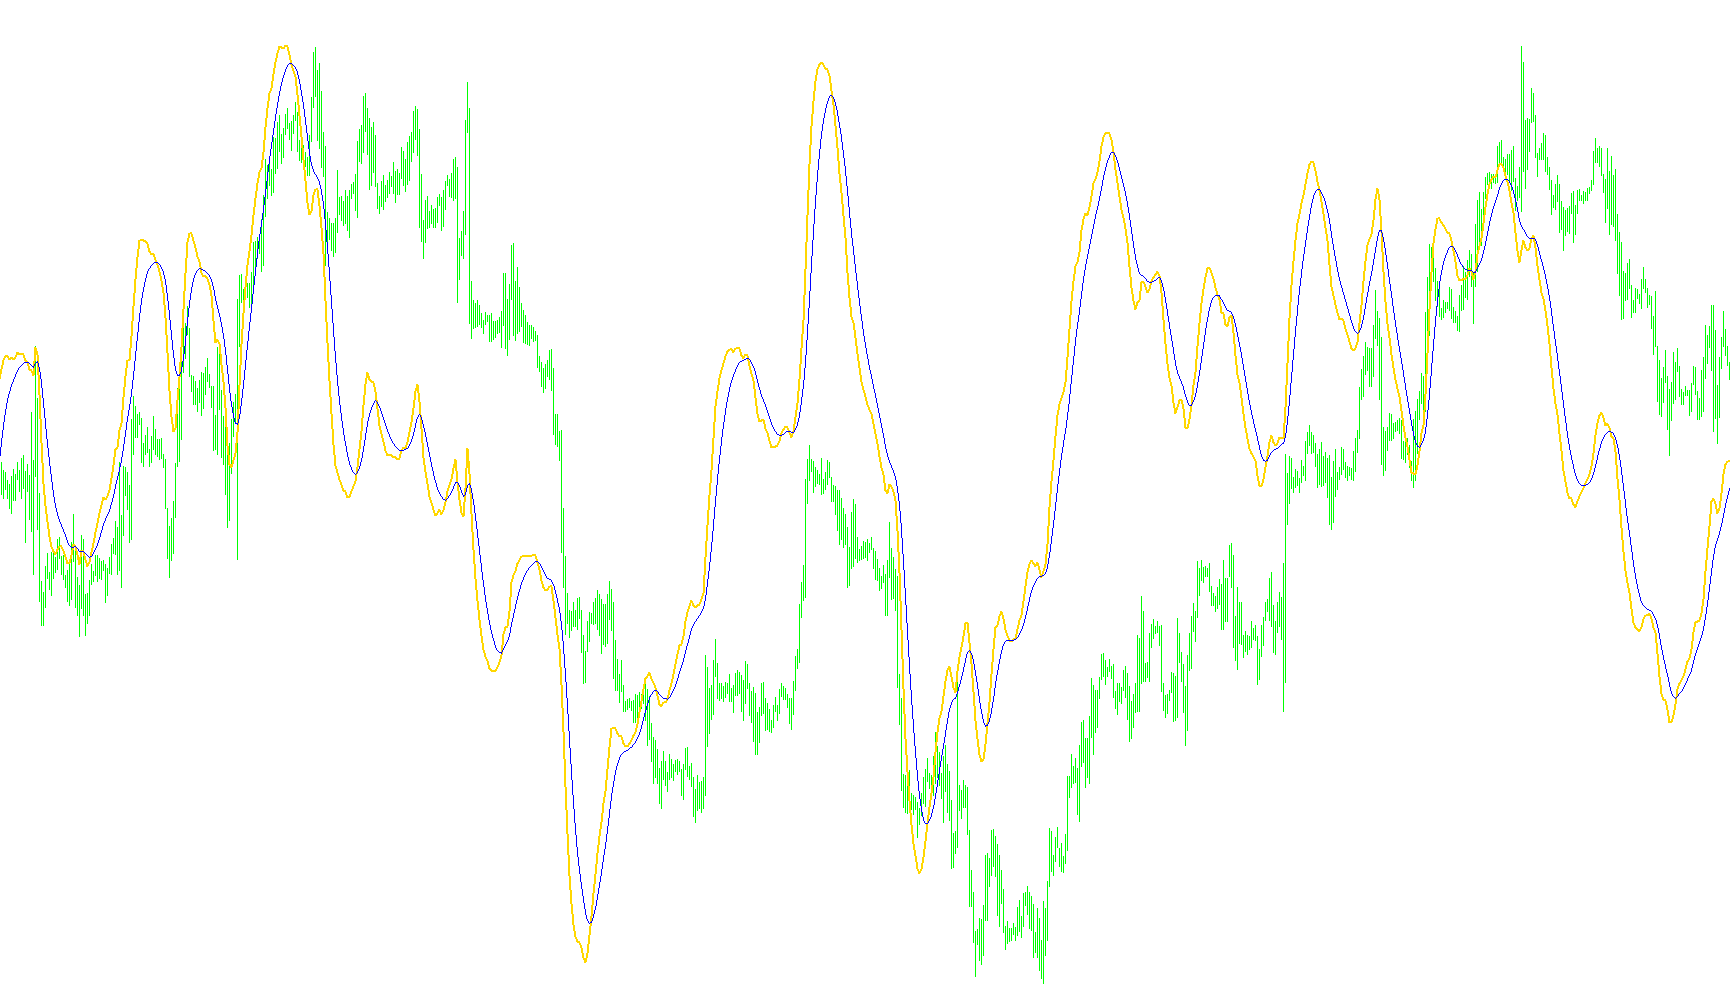
This indicator synthesizes smoothed moving average data with Heiken Ashi price reconstruction to filter market noise and highlight underlying trend momentum.

Rads MACD
Indicator

Rads MACD

iMA

This indicator calculates the difference between two weighted exponential moving averages to identify trend reversals via histogram polarity shifts.

Rads MACD_v1
Indicator

Rads MACD_v1

iMA

This indicator calculates the variance between two weighted exponential moving averages and visualizes directional momentum shifts via a dual-color histogram.

Rads MTF HAS Bar A 2tf
Indicator

Rads MTF HAS Bar A 2tf

This indicator visualizes synchronized trend direction by comparing smoothed Heiken-Ashi price action across multiple correlated timeframes simultaneously.

Rads MTF HAS Bar A
Indicator

Rads MTF HAS Bar A

This indicator visualizes concurrent bullish and bearish trends across four distinct higher timeframes by monitoring the relationship between smoothed Heiken Ashi open and close values.

Rads MTF HAS Bar B
Indicator

Rads MTF HAS Bar B

This indicator visualizes synchronized bullish and bearish momentum across four distinct higher timeframes by plotting smoothed Heiken Ashi price actions into a consolidated trend matrix.

Rads SMAC-D crossover alert
Indicator

Rads SMAC-D crossover alert

This script triggers real-time notifications when the primary and secondary SMAC-D indicator lines perform a bullish or bearish crossover.

Rads SMAC-D
Indicator

Rads SMAC-D

iMAiMAOnArray

This indicator calculates a MACD derivative by subtracting two exponential moving averages of weighted prices and applying a smoothed signal line.

Rads stoch Bar A
Indicator

Rads stoch Bar A

iStochastic

This indicator visualizes the relative momentum alignment across four distinct timeframes by plotting stochastic signal crossovers in a unified separate window.

Rads T3 Stochastic-3
Indicator

Rads T3 Stochastic-3

iStochastic

This indicator applies a triple exponential moving average filter to standard stochastic values to reduce market noise and identify high-probability momentum trends.

Rads Wall-4
Indicator

Rads Wall-4

iMA

The indicator visualizes momentum dynamics by contrasting fast and slow Exponential Moving Averages derived from price close, open, and median values to identify trend structural shifts.

Rads_T3_Stochastic-3_obosx_alert
Indicator

Rads_T3_Stochastic-3_obosx_alert

iStochastic

This indicator applies a triple-smoothed T3 moving average filter to standard Stochastic values to eliminate market noise and trigger alerts upon overbought or oversold threshold crossings.

RainbowMMA
Indicator

RainbowMMA

iMA

This indicator maps eight exponential moving averages across progressively expanding timeframes to visualize overarching trend dynamics and price momentum.

RainbowMMA_01
Indicator

RainbowMMA_01

iMA

This indicator visualizes a multi-layered sequence of exponential moving averages with staggered periods to identify overarching trend momentum and price convergence.

RainbowMMA_02
Indicator

RainbowMMA_02

iMA

This indicator plots a series of eight multi-period exponential moving averages to visualize structural price momentum and trend confluence.

RainbowMMA_03
Indicator

RainbowMMA_03

iMA

This indicator maps multiple exponential moving averages with incrementally increasing periods to visualize trend velocity and price equilibrium.

RainbowMMA_04
Indicator

RainbowMMA_04

iMA

This indicator visualizes a multi-layered sequence of exponential moving averages to identify momentum shifts and structural trend transitions through ribbon convergence.

RainbowMMA_05
Indicator

RainbowMMA_05

iMA

This indicator visualizes a multi-layered sequence of exponential moving averages with varying periods to identify trend curvature and momentum shifts.

RainbowMMA_06
Indicator

RainbowMMA_06

iMA

This indicator visualizes price momentum and trend direction by plotting a series of eight distinct exponential moving averages with progressively increasing periods.

RainbowMMA_07
Indicator

RainbowMMA_07

iMA

This indicator renders a multi-layered stack of six Exponential Moving Averages with staggered periods to visualize trend momentum and structural fluidity.

RainbowMMA_08
Indicator

RainbowMMA_08

iMA

This indicator renders a multi-layered ribbon of eight distinct Exponential Moving Averages with incrementally increasing periods to visualize trend momentum and structural density.

RainbowMMA_09
Indicator

RainbowMMA_09

iMA

This indicator visualizes price momentum by plotting a series of multi-period Exponential Moving Averages to identify trend direction and structural confluence.

RainbowMMA_10
Indicator

RainbowMMA_10

iMA

This indicator visualizes a multi-layered sequence of progressively increasing Exponential Moving Averages to identify trend curvature and price momentum.

RainbowMMA_11
Indicator

RainbowMMA_11

iMA

This indicator synthesizes a multi-layered ensemble of exponential moving averages to visualize momentum trends and structural price fluidity.

RainbowOsMA
Indicator

RainbowOsMA

iMAiMAOnArray

This indicator visualizes price momentum by calculating the difference between two exponential moving averages and applying a signal smoothing layer with specific threshold-based color transitions.

RainbowOsMA_v1
Indicator

RainbowOsMA_v1

iMAiMAOnArray

This indicator calculates a dual-EMA differential signal and applies a threshold filtering logic to isolate significant momentum shifts into distinct visual histogram components.

RandomNumbers1
Indicator

RandomNumbers1

A comprehensive utility providing algorithmic generation of pseudo-random integers, floating-point values, and multi-layered alphanumeric strings using bitwise flag filtering.

Range bar generator v2
Indicator

Range bar generator v2

This indicator dynamically generates high-fidelity offline timeframe data by mathematically interpolating source price action into custom periodic bars with real-time synchronization and low-latency CPU overhead.

Range
Indicator

Range

This indicator visualizes the comparative volatility of the current candle range against the preceding period to distinguish between expanding, contracting, and stagnant price movement.
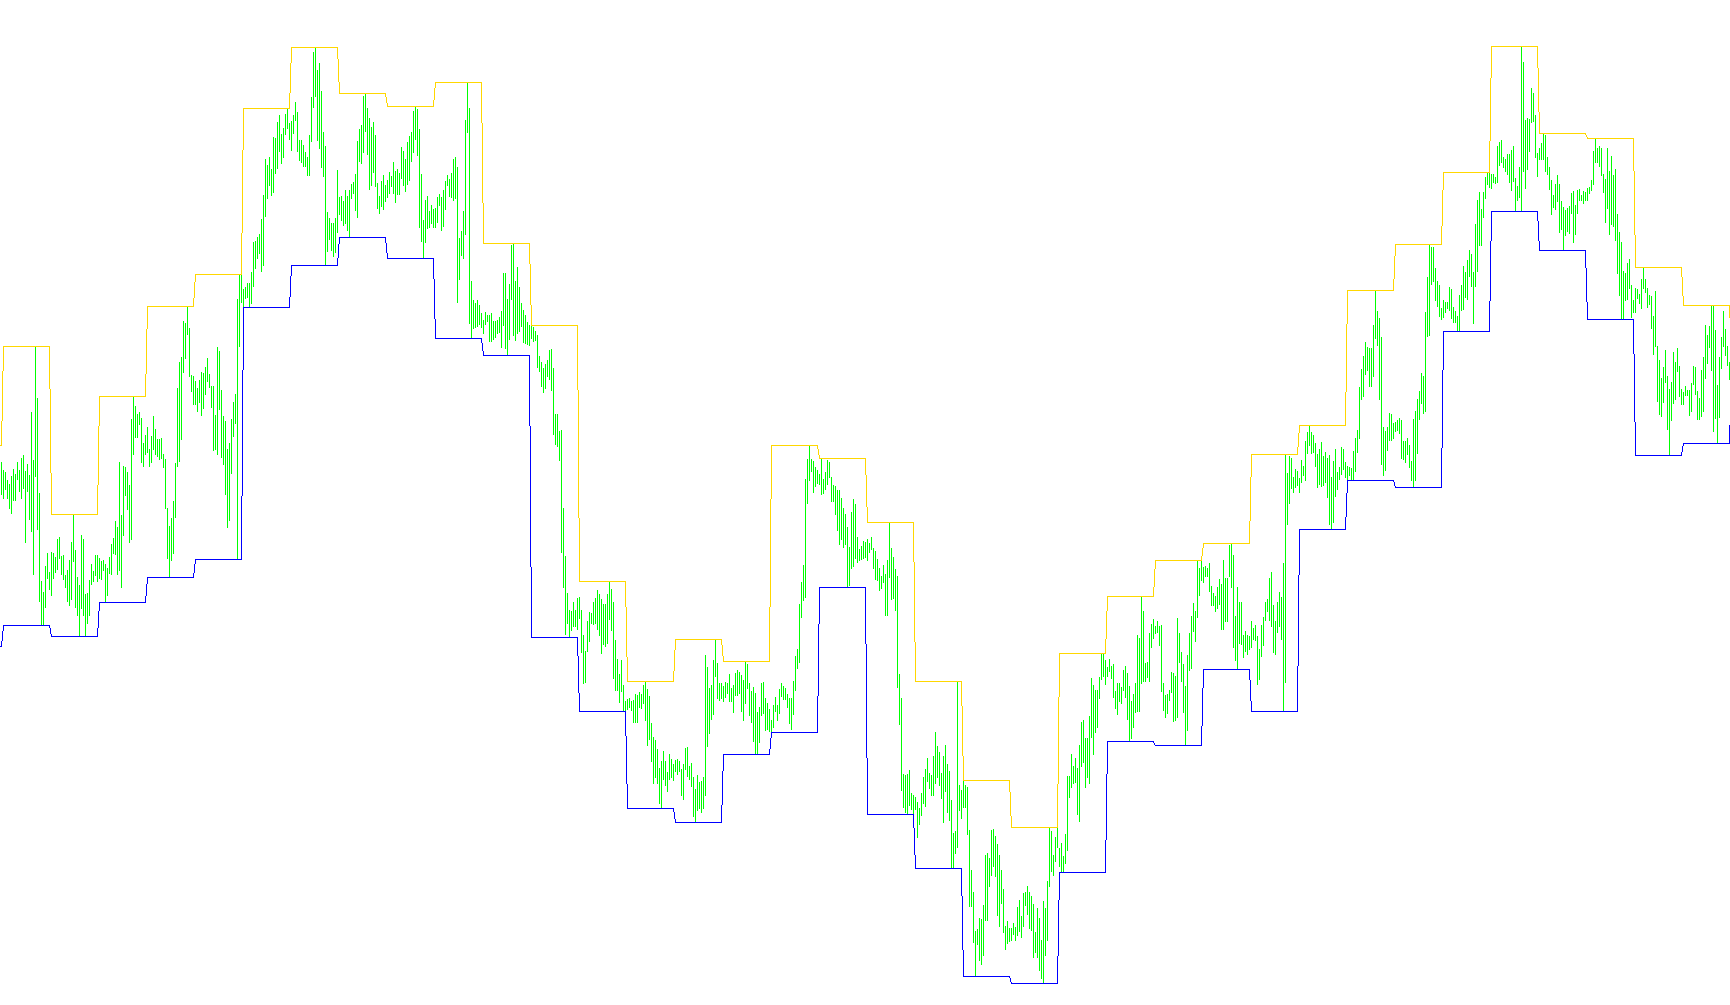
RangerBB
Indicator

RangerBB

iMAiMAOnArrayiStdDevOnArray

This indicator calculates a synthetic price deviation by summing the difference between closing prices and moving averages of high and low extremes, then overlaying a Bollinger Band envelope on the resulting signal.

Range_stop_&_reverse
Indicator

Range_stop_&_reverse

This indicator tracks price extremes to define dynamic support and resistance zones, signaling potential reversals when the market breaks beyond a predefined point range.

Range_v1
Indicator

Range_v1

This indicator visually distinguishes between expanding, contracting, and neutral price volatility by comparing the current candle's range against the previous period.

Range_v2.2
Indicator

Range_v2.2

This indicator synchronizes and visualizes Open, High, Low, and Close price data from a higher timeframe onto the current chart for concurrent analysis.

Range_v2.2m
Indicator

Range_v2.2m

This indicator maps high, low, open, and close price boundaries from a user-defined higher timeframe onto the current chart for structural context.

Range_v2.2_v2
Indicator

Range_v2.2_v2

This indicator maps high, low, open, and close price data from a higher temporal resolution onto the current chart to visualize structural boundaries.

Range_v2
Indicator

Range_v2

This indicator projects higher timeframe price extremes onto the current chart to delineate structural ceilings and floors based on historical range data.

Range_v2_001
Indicator

Range_v2_001

This indicator maps and overlays historical price extremes and opening values from a higher temporal scale onto the current chart to visualize structural boundaries.

Range_v3
Indicator

Range_v3

This indicator visualizes the expansion or contraction of price range magnitude by comparing the current candle's high-low spread against its immediate predecessor.

RapidRSI
Indicator

RapidRSI

This indicator replaces standard moving average smoothing with a raw summation of positive and negative price fluctuations to identify extreme momentum shifts more aggressively.

RAVI FX Fisher
Indicator

RAVI FX Fisher

iATRiMA

This indicator calculates a normalized momentum value by scaling the difference between two Linear Weighted Moving Averages against their respective ATR volatility, optionally applying an Inverse Fibonacci Transform for smoother trend identification.

RAVI FX Fisher2
Indicator

RAVI FX Fisher2

iATRiMA

This indicator transforms the spread between two Linear Weighted Moving Averages into a hyperbolic tangent function to normalize price momentum and volatility into an oscillatory range.

RAVI FX Fisher2_v1
Indicator

RAVI FX Fisher2_v1

iATRiMA

This indicator quantifies price velocity by calculating the exponential transformation of linear weighted moving average differentials normalized against volatility.

RAVI FX Fisher_001
Indicator

RAVI FX Fisher_001

iATRiMA

This indicator quantifies price velocity by calculating the normalized difference between fast and slow linear weighted moving averages, optionally applying a hyperbolic tangent transformation to stabilize extreme variance.

RAVI FX Fisher_v1
Indicator

RAVI FX Fisher_v1

iATRiMA

This indicator quantifies price momentum by calculating the normalized variance between two linear weighted moving averages adjusted by Average True Range volatility.

RAVI FX Fisher_v2
Indicator

RAVI FX Fisher_v2

iATRiMA

This indicator calculates a normalized momentum value by processing the relative distance between fast and slow linear weighted moving averages adjusted by volatility, then maps it onto a hyperbolic tangent curve.

RAVI FX Fisher_v3
Indicator

RAVI FX Fisher_v3

iATRiMA

This indicator normalizes the distance between two linear weighted moving averages relative to volatility, then applies a hyperbolic tangent transformation to map momentum into a bounded range.

RAVI FX Fisher_v4
Indicator

RAVI FX Fisher_v4

iATRiMA

This indicator quantifies price velocity by normalizing the spread between a fast and slow linear weighted moving average against their respective average true ranges, mapped through a hyperbolic tangent function.

RAVI FX Fisher_v5
Indicator

RAVI FX Fisher_v5

iATRiMA

This indicator quantifies relative price velocity by normalizing the spread between linear weighted moving averages against average true range volatility and mapping the result onto a hyperbolic tangent curve.

RAVI FX
Indicator

RAVI FX

iATRiMA

This indicator transforms the normalized price momentum between two linear weighted moving averages into a bounded distribution to identify trend extremes.

RAVI
Indicator

RAVI

iMA

This indicator calculates the percentage deviation between two Simple Moving Averages and visualizes bullish or bearish momentum shifts based on price velocity exceeding predefined threshold boundaries.