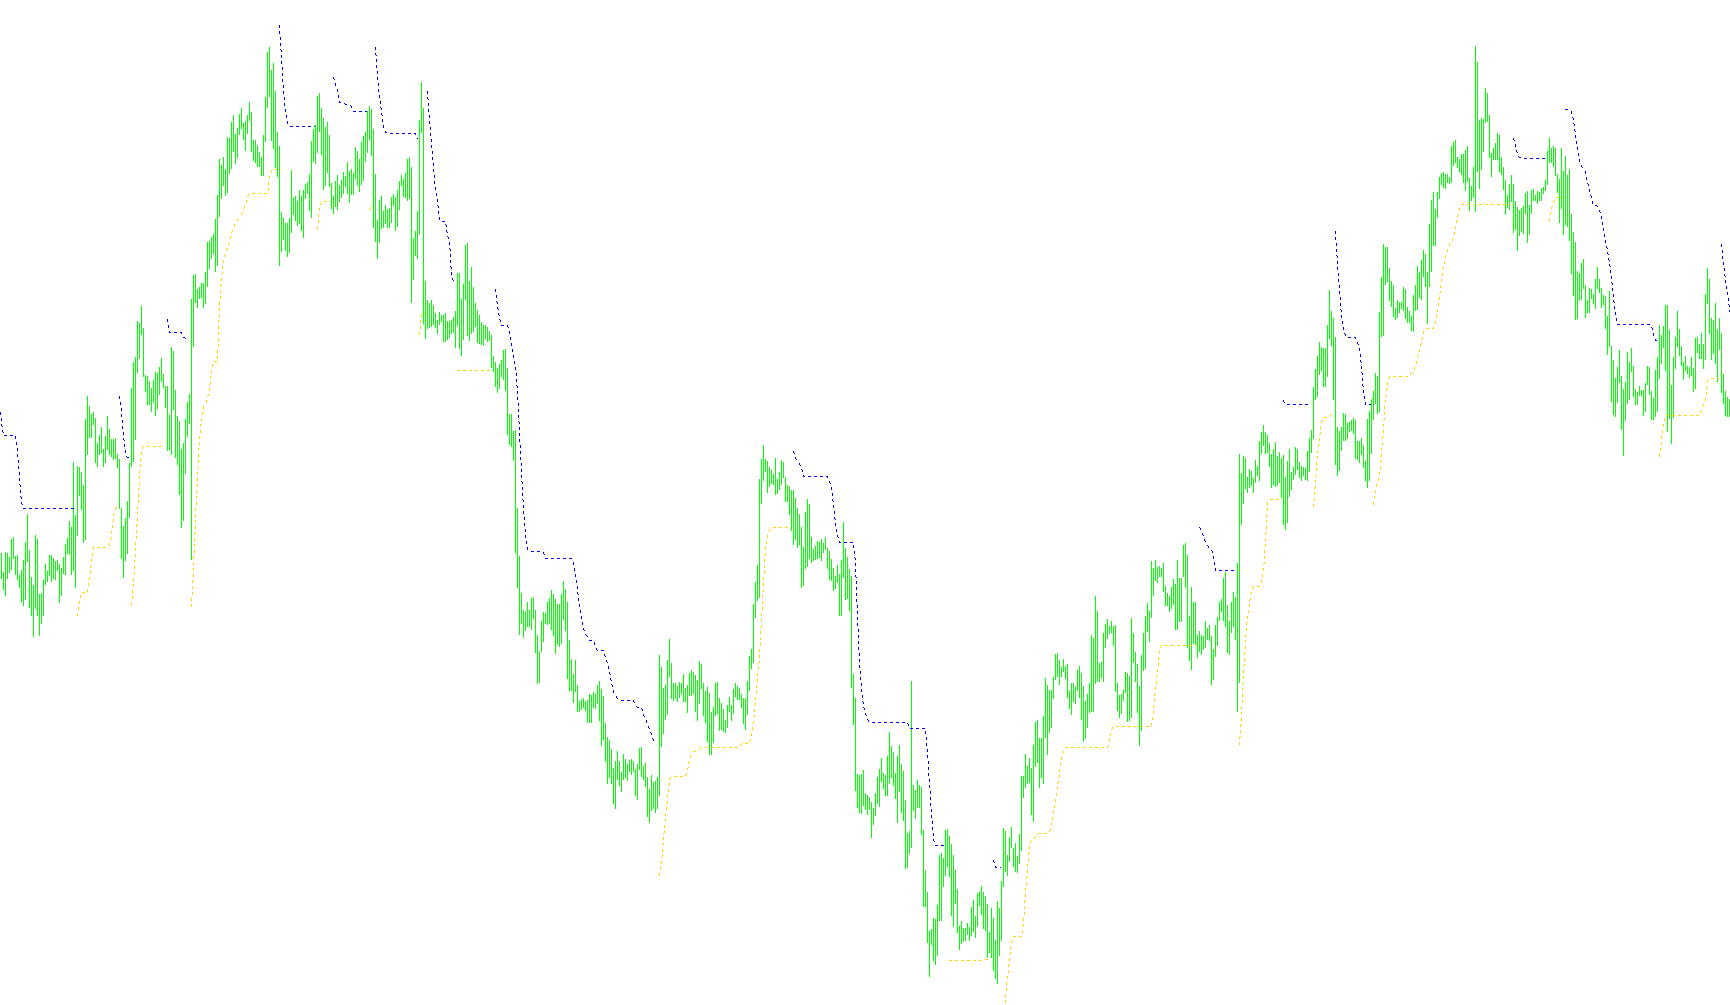
TSI Signals
Indicator

TSI Signals

This indicator generates visual signals by identifying precise momentum shifts when the True Strength Index crosses its respective signal line.

TSI Signals_v1
Indicator

TSI Signals_v1

This indicator identifies bullish and bearish reversals by detecting momentum shifts where the True Strength Index crosses its smoothed signal line.

TSI Signals_v3
Indicator

TSI Signals_v3

Identifies bullish and bearish reversals by detecting precise crossovers between the True Strength Index line and its smoothed signal component.

TSI-Osc(4AUG05)
Indicator

TSI-Osc(4AUG05)

iMAOnArray

This indicator calculates a momentum ratio by dividing the double exponentially smoothed price change by its absolute magnitude to identify trend strength and exhaustion.

TSI-Osc
Indicator

TSI-Osc

iMAOnArray

The indicator calculates the relative strength of price momentum by determining the ratio between double-smoothed exponential moving averages of raw price changes and their absolute values.

TSI-OscM
Indicator

TSI-OscM

iMAiMAOnArray

This indicator quantifies price velocity by calculating a triple-smoothed momentum ratio against its absolute magnitude to identify trend exhaustion and reversals.

TSI-Osc_001
Indicator

TSI-Osc_001

iMAOnArray

The indicator calculates the percentage of directed momentum over absolute volatility by applying multi-layered Exponential Moving Averages to price fluctuations.

TSI-Osc_v1
Indicator

TSI-Osc_v1

iMAOnArray

This indicator quantifies market velocity by calculating the ratio between a double-smoothed momentum value and its absolute magnitude to identify trend strength and exhaustion.

TSI-Osc_v2
Indicator

TSI-Osc_v2

iMAOnArray

This indicator calculates a normalized momentum ratio by dividing the double-smoothed exponential moving average of price changes by the double-smoothed exponential moving average of their absolute values.

TSI-Osc_v3
Indicator

TSI-Osc_v3

iMAOnArray

This indicator calculates a smoothed ratio between the double-exponential moving average of price momentum and its absolute magnitude to identify directional strength.

TSI
Indicator

TSI

iMAOnArray

This indicator calculates the True Strength Index by determining the ratio between the double exponentially smoothed momentum and its absolute magnitude to highlight trend velocity.

TSI_MACD
Indicator

TSI_MACD

iMACDiMAOnArray

This indicator calculates a True Strength Index variant by normalizing the smoothed difference of MACD values against their absolute moving averages to reveal momentum intensity.

TSI_v1
Indicator

TSI_v1

iMAOnArray

This indicator calculates a percentage-based oscillator by determining the ratio between the double exponential moving average of price momentum and its absolute counterpart.

TSI_v2
Indicator

TSI_v2

iMAOnArray

This indicator calculates a normalized momentum value by determining the ratio between double exponentially smoothed price changes and their absolute magnitude.

TSR_custom
Indicator

TSR_custom

The indicator projects an upper and lower corridor by applying a weighted historical average range factor to the local high and low extremes over a customizable temporal lookback window.

TSSuperTrend
Indicator

TSSuperTrend

iATRiMA

This indicator identifies market direction by synthesizing various moving average smoothing techniques with ATR-based volatility offsets and specialized dual-thrust calculations.

TSSuperTrendSTS
Indicator

TSSuperTrendSTS

iATRiMA

This indicator dynamically maps market direction by calculating a smoothed price baseline adjusted by either ATR-based volatility or Dual Thrust range expansions to identify trend flips.

TTF - trigger factor
Indicator

TTF - trigger factor

This indicator quantifies market momentum by calculating the ratio between current high-low price ranges and historical extremes, smoothed through a multi-stage weighted moving average.

TTF - trigger factor_v1
Indicator

TTF - trigger factor_v1

The indicator quantifies price velocity by calculating the ratio between recent upward price expansion and historical downward contraction, smoothed through a multi-stage recursive filter.

TTF - trigger factor_v2
Indicator

TTF - trigger factor_v2

The indicator quantifies market sentiment by calculating the disparity between recent price expansion and historical range boundaries, smoothed through a multi-stage weighted recursive filter.

TTF(3AUG05)
Indicator

TTF(3AUG05)

This indicator calculates the relative strength between recent and historical price extremes to derive a smoothed momentum value.

TTF+-+MW
Indicator

TTF+-+MW

This indicator identifies extreme directional shifts by calculating the relative ratio between recent price expansion and historical volatility, smoothed through a multi-stage Fibonacci weighted recursive filter.

TTF+-+MW_v1
Indicator

TTF+-+MW_v1

This indicator quantifies market dominance by calculating the ratio of relative peak-to-trough volatility across shifted price windows, filtered through a triple-weighted Fibonacci expansion.

TTF+-+MW_v2
Indicator

TTF+-+MW_v2

This indicator calculates a momentum shift by comparing historical price extremes using Fibonacci coefficients and a multi-stage smoothing filter to identify overextended directional exhaustion.

TTF
Indicator

TTF

This indicator calculates a momentum value by comparing the differential of recent highs and lows against older price extremes, smoothed through a multi-stage recursive filter.

TTFsignal
Indicator

TTFsignal

This indicator quantifies market sentiment by calculating the relative ratio between recent price expansion and historical range, smoothed through a multi-stage polynomial filter to identify extreme volatility zones.

TTF_hist
Indicator

TTF_hist

This indicator calculates the dynamic equilibrium between recent and historical price extremes to derive a smoothed momentum histogram that identifies directional bias.

TTF_hist_v1
Indicator

TTF_hist_v1

The indicator calculates the ratio between recent bullish price expansion and historical bearish contraction to generate a smoothed momentum histogram.

TTF_look-ahead
Indicator

TTF_look-ahead

This indicator calculates a momentum ratio based on high-low price extremes using Fibonacci coefficients and a multi-stage smoothing filter to identify trend strength.

TTF_look-ahead_v1
Indicator

TTF_look-ahead_v1

This indicator quantifies market sentiment by calculating the ratio between recent and historical price extremes, processed through a weighted Fibonacci-based smoothing filter.

TTF_TR
Indicator

TTF_TR

The indicator quantifies market sentiment by calculating the percentage difference between current price extremes and historical structural pivots to identify trend dominance.

TTF_TR_v1
Indicator

TTF_TR_v1

This indicator quantifies market sentiment by calculating the relative ratio between recent price extremes and historical volatility windows to identify trend strength.

TTF_TR_v2
Indicator

TTF_TR_v2

This indicator quantifies market bias by calculating the percentage variance between recent price extremes and historical price ranges to identify shift in dominance.

ttm-trend-2
Indicator

ttm-trend-2

The indicator identifies directional bias by calculating Heikin-Ashi price transformations and applying a lookback buffer to maintain trend consistency through overlapping price action.

TTM-Trend-Map V1 color mod
Indicator

TTM-Trend-Map V1 color mod

This indicator aggregates TTM-Trend directional data across multiple concurrent timeframes and currency pairs into a singular visual dashboard for holistic market bias analysis.

TTM-Trend-Map V1
Indicator

TTM-Trend-Map V1

This indicator aggregates and visualizes synchronized trend directions across multiple currency pairs and timeframes simultaneously using the TTM-Trend logic.

ttm-trend
Indicator

ttm-trend

This indicator identifies directional trends by evaluating Heikin-Ashi price action and maintaining momentum signals through a look-back comparison of overlapping candle ranges.

TTM-Trend_003
Indicator

TTM-Trend_003

This indicator identifies trend direction by smoothing price action into Heikin-Ashi components and applying a recursive lookback to maintain color persistence during consolidation periods.

ttm-trend_v1
Indicator

ttm-trend_v1

This indicator identifies prevailing market direction by applying a recursive persistence logic to Heikin-Ashi price calculations, smoothing out noise to visualize trend continuity.

ttm-trend_v2
Indicator

ttm-trend_v2

This indicator identifies prevailing market direction by calculating Heikin-Ashi price averages and applying a multi-bar lookback to filter out non-conforming price fluctuations.

TTM
Indicator

TTM

iMA

This indicator identifies significant price breakouts by comparing closing prices against exponential moving average boundaries divided into ternary segments.

TTMStoch
Indicator

TTMStoch

This indicator calculates a multi-stage smoothed momentum metric by normalizing price action against high-low ranges and applying consecutive moving average filters.

TTM_v1
Indicator

TTM_v1

iMA

This indicator identifies bullish and bearish momentum by comparing price action against calculated price range thirds derived from Exponential Moving Averages of the high and low extremes.

TudorGirl_Vorticity_2
Indicator

TudorGirl_Vorticity_2

The indicator calculates the relative position of price action within a dynamic range to derive a logarithmic momentum value, identifying trend reversals through polarity shifts.

TudorGirl_Vorticity_2_001
Indicator

TudorGirl_Vorticity_2_001

This indicator calculates price momentum by mapping high-low price action into a normalized sigmoid space to identify trend reversals based on fluid dynamic pressure points.

tunnel
Indicator

tunnel

iMA

This indicator maps multiple Fibonacci-based price levels relative to a secondary EMA, generating real-time alerts when market prices intersect with these dynamic equilibrium zones.

tunnel_v1
Indicator

tunnel_v1

iMA

This indicator calculates dynamic support and resistance levels by projecting Fibonacci retracement distances from a secondary Exponential Moving Average base.

tunnel_v2
Indicator

tunnel_v2

iMA

This indicator projects symmetrical Fibonacci retracement levels based on a secondary Exponential Moving Average to identify price volatility boundaries and potential reversal points.

Turbo_JMA
Indicator

Turbo_JMA

This indicator utilizes a sophisticated non-linear filtering algorithm that employs logarithmic scaling and dynamic memory rings to minimize phase lag while maintaining smooth price trajectory tracking.

Turbo_JMACD
Indicator

Turbo_JMACD

iMAOnArray

This indicator calculates the momentum variance between two distinct Turbo Jurik Moving Averages based on typical price data, overlaid with a smoothed signal line.