UT_FAST_v2
Indicator

UT_FAST_v2

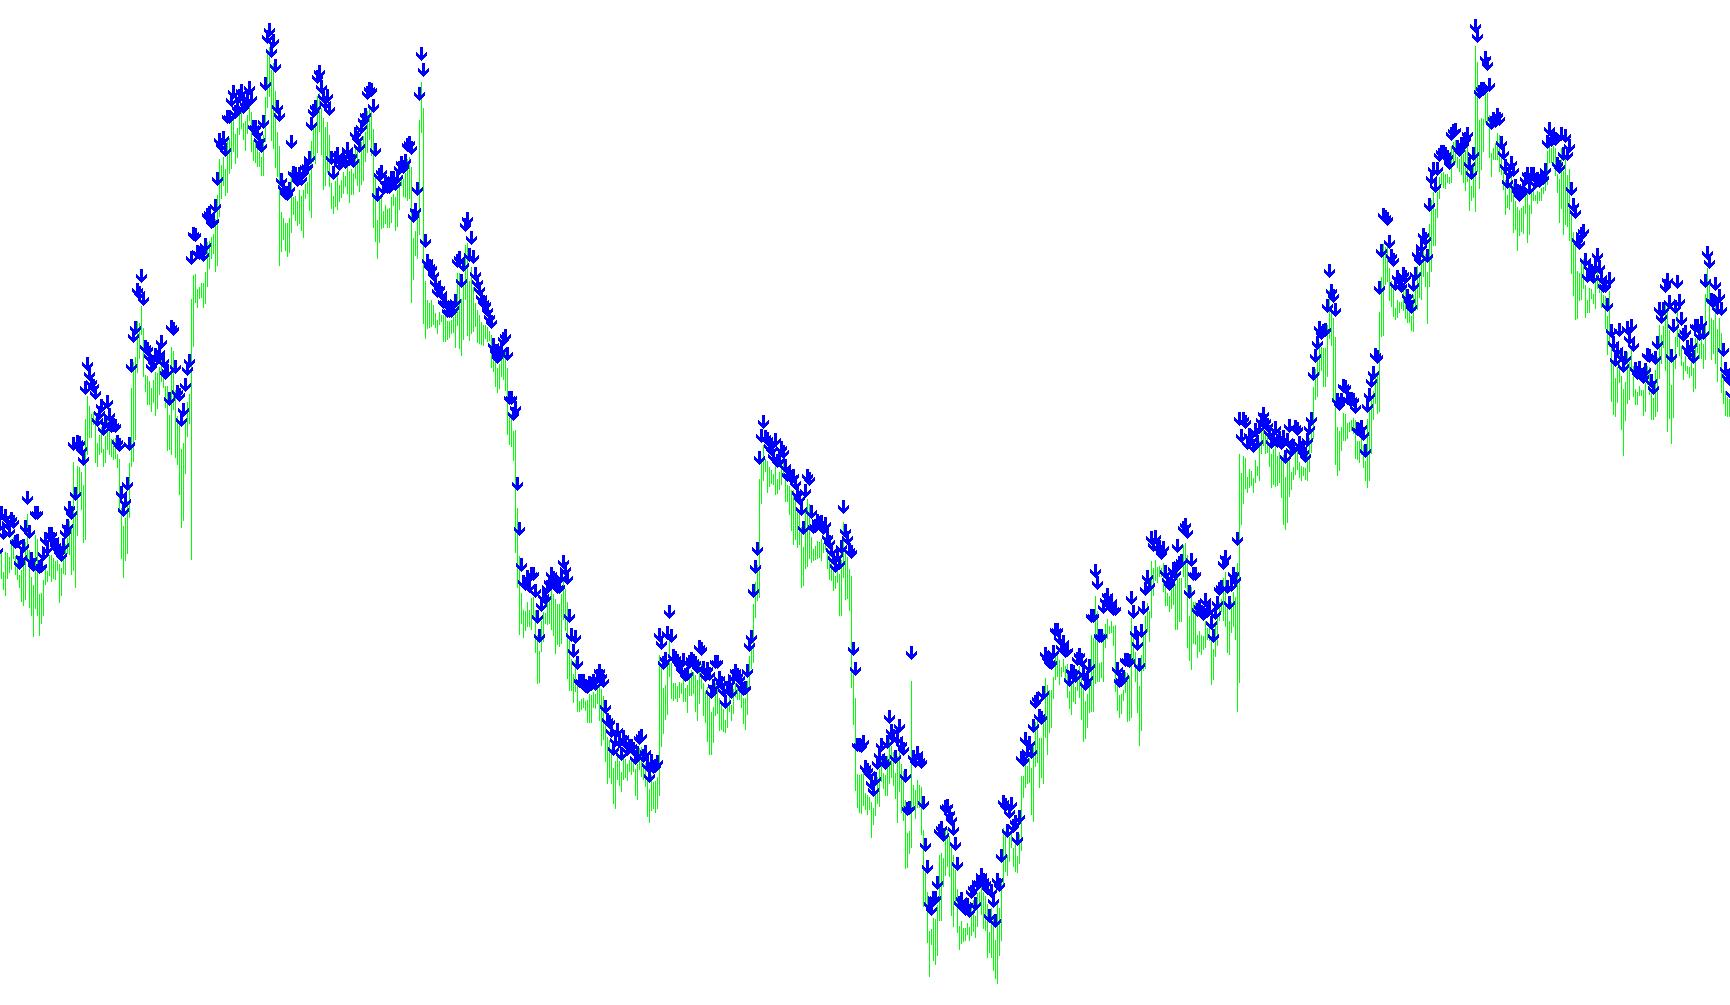
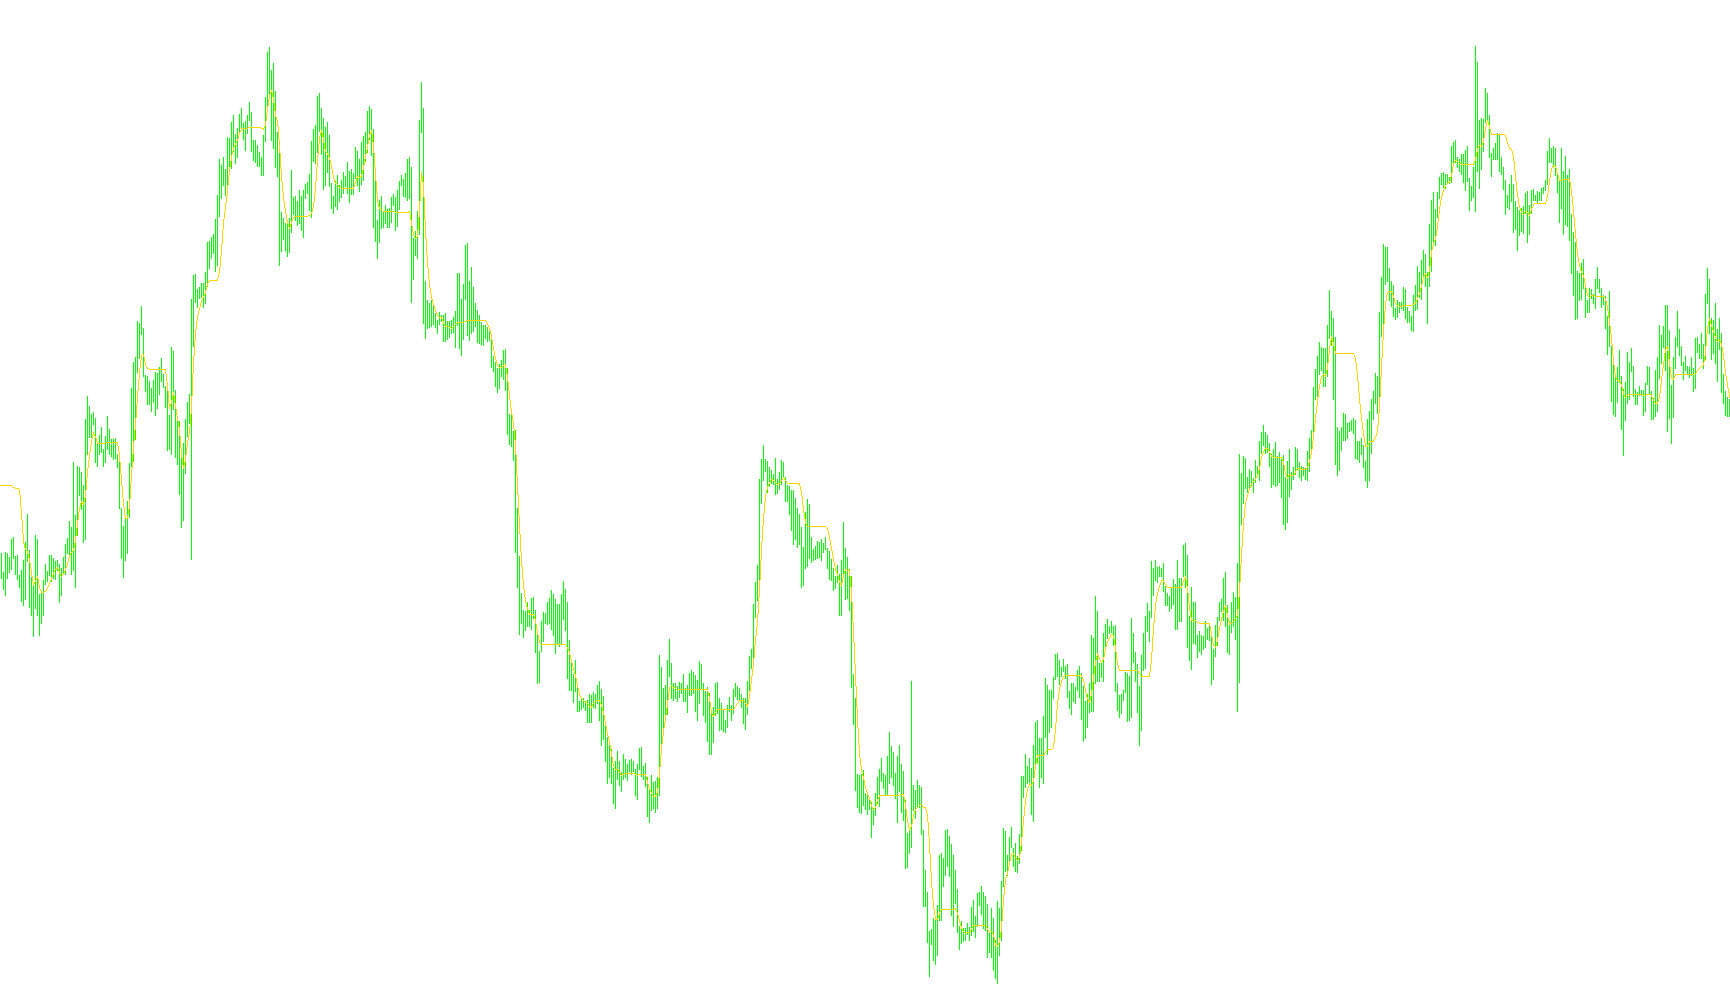
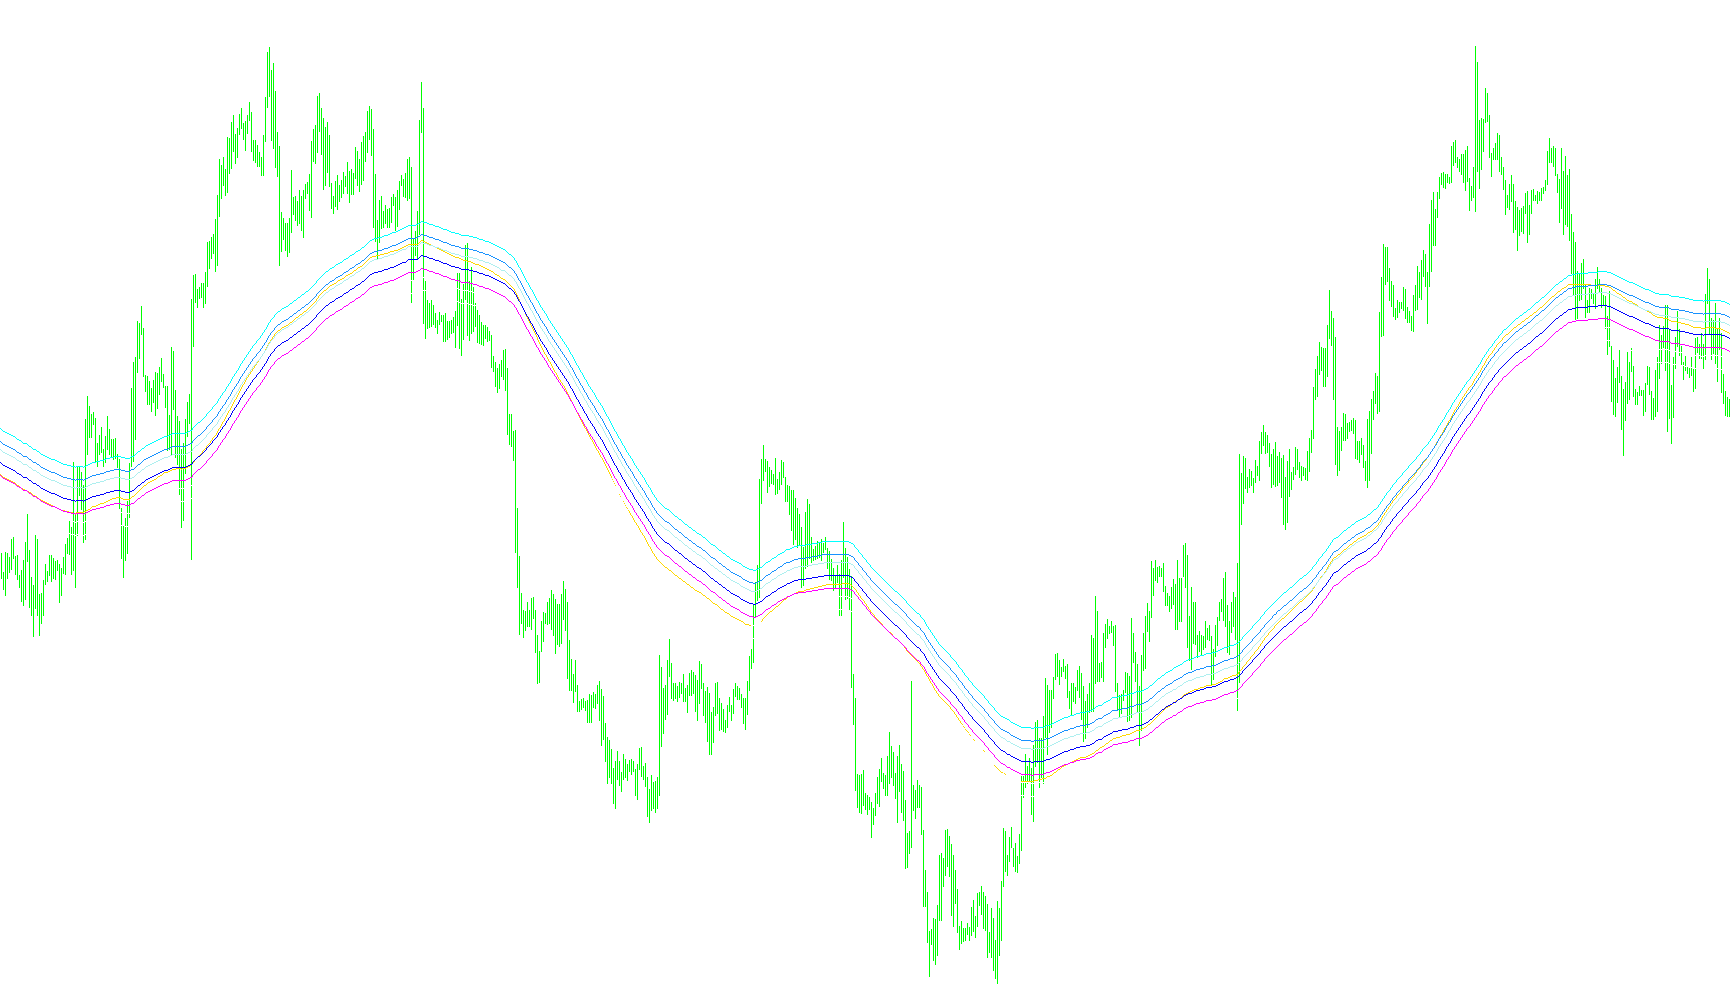
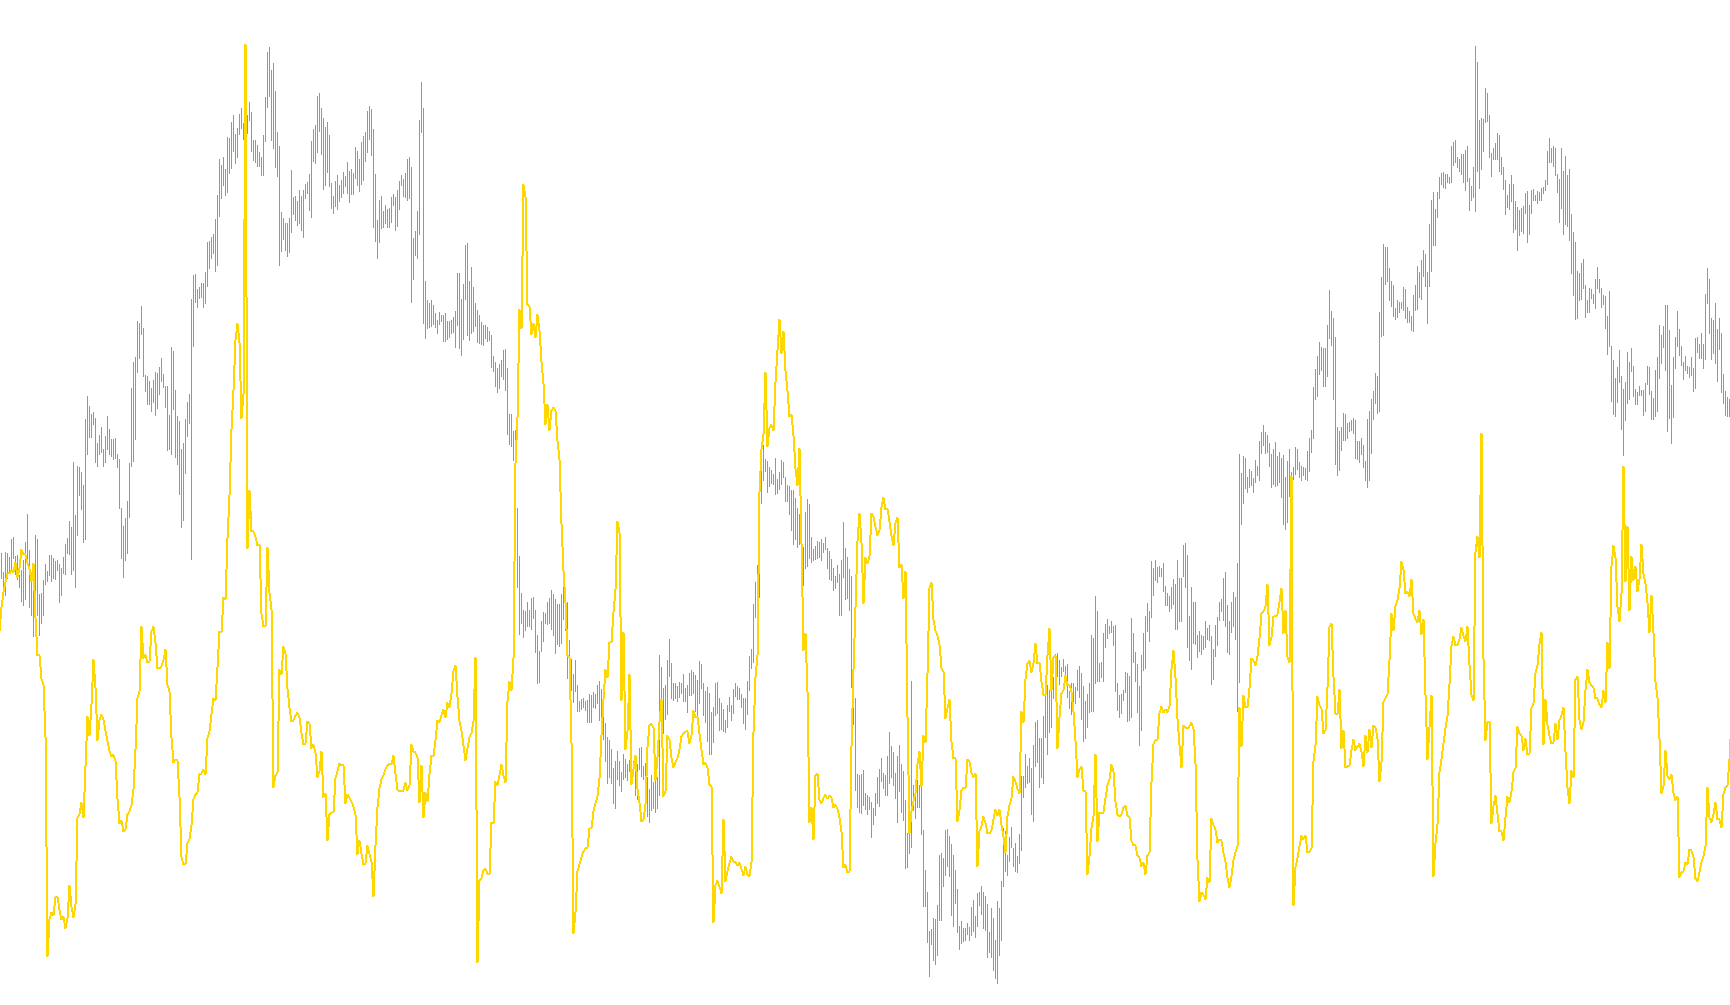
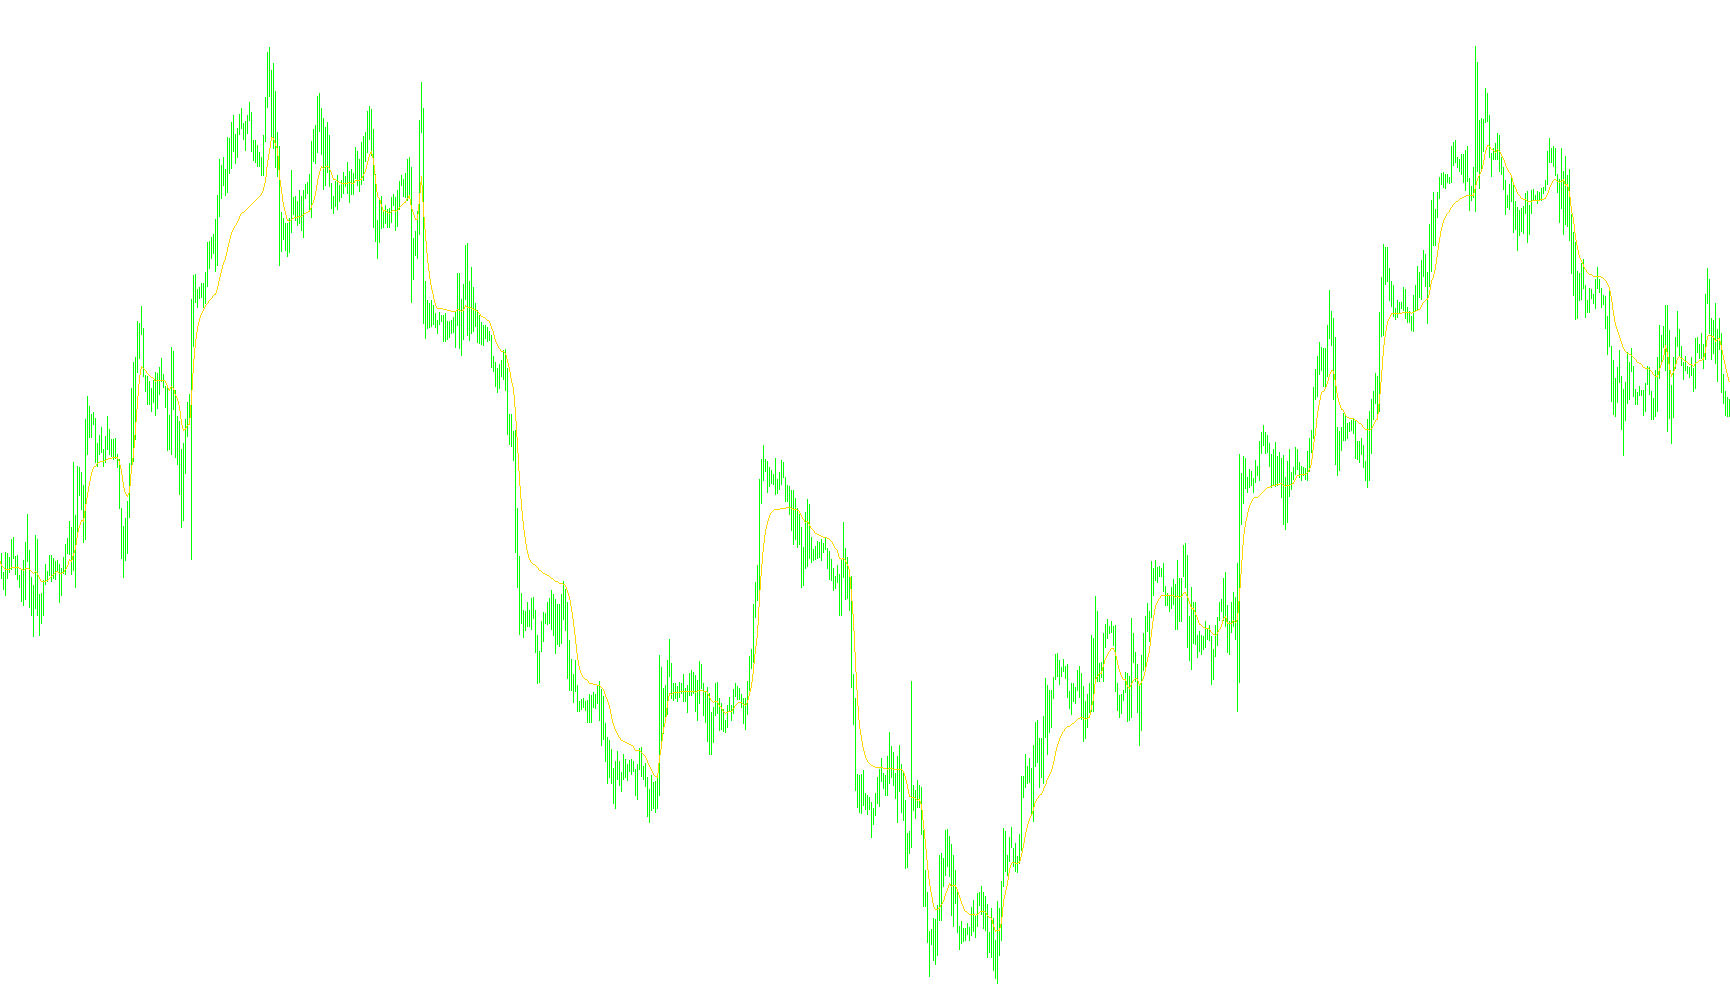
This indicator synthesizes Jurik Moving Average (JMA) algorithms with a secondary Lenars smoothing layer to provide non-linear price trend tracking and volatility-adjusted signal filtering.

UT_FAST_v3
Indicator

UT_FAST_v3

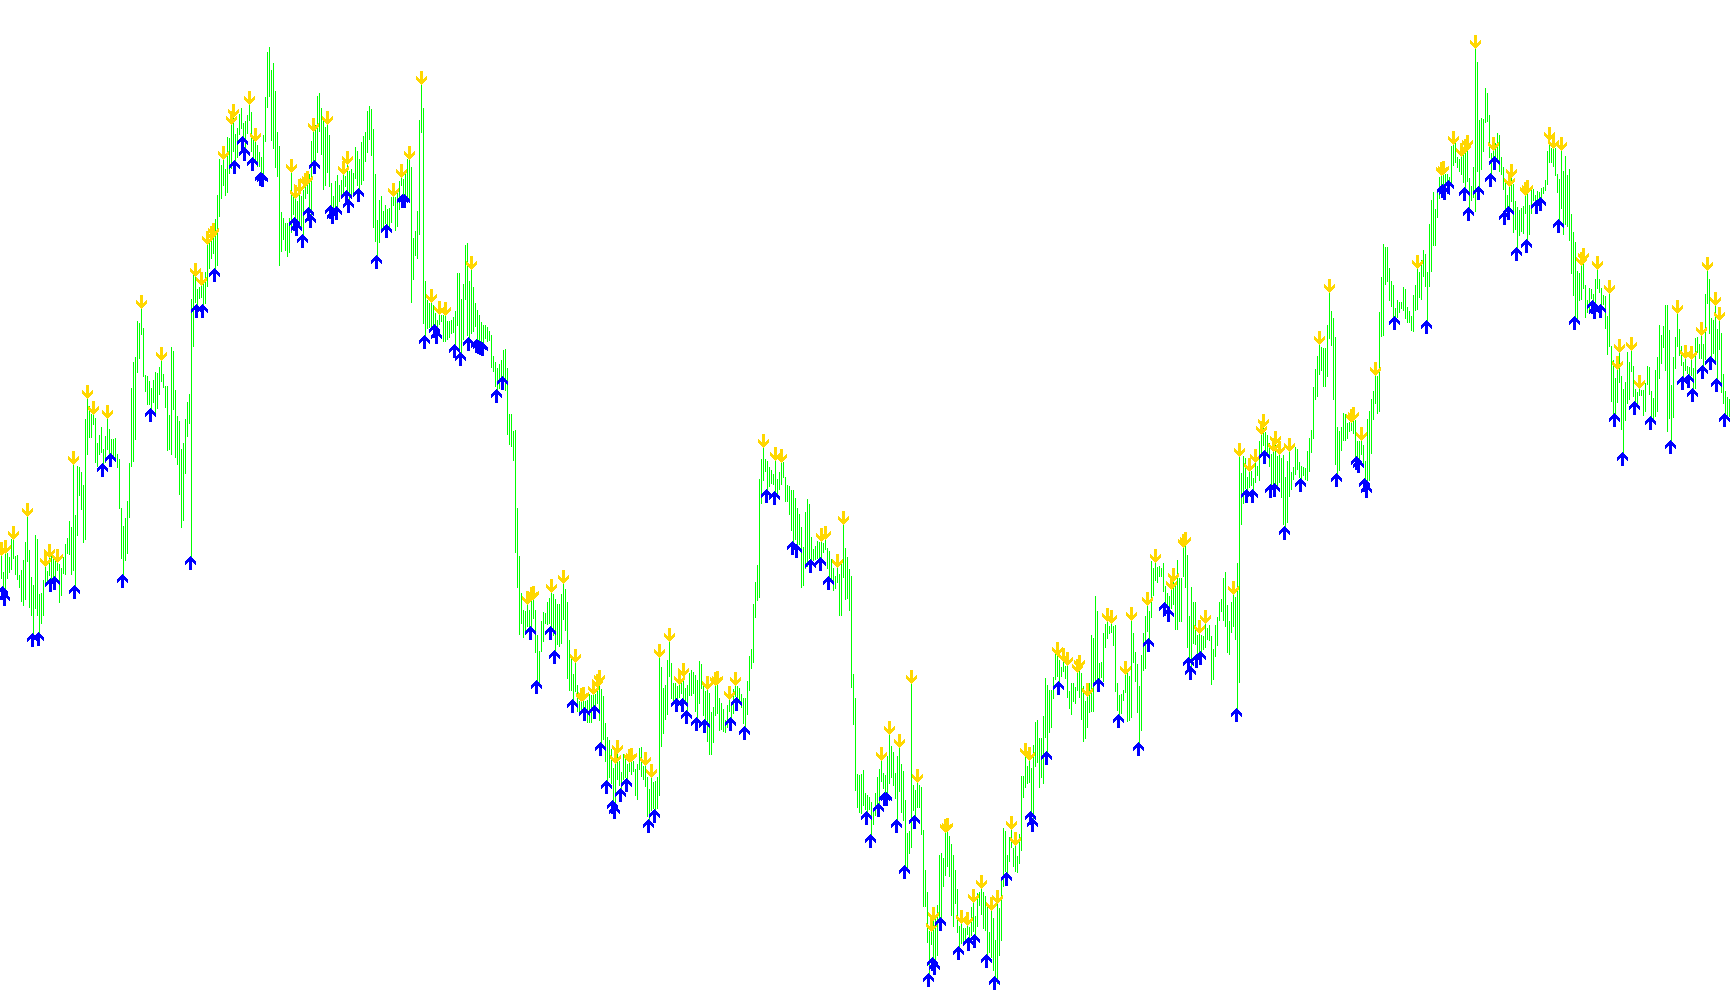
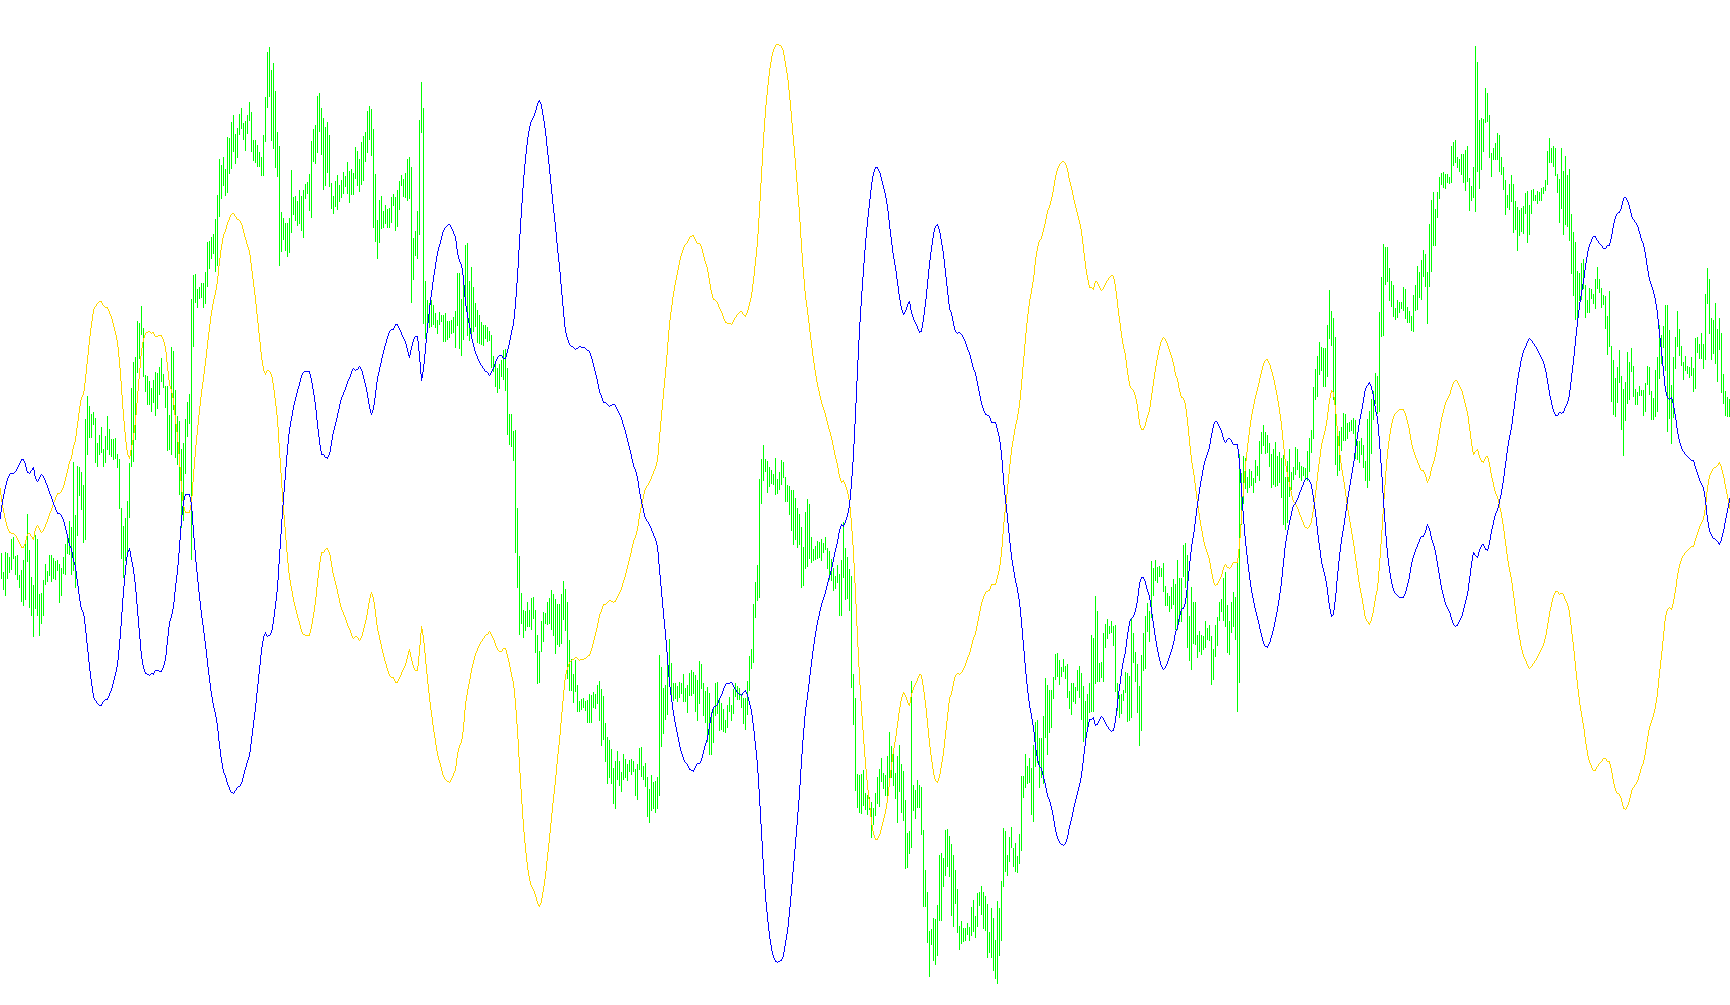
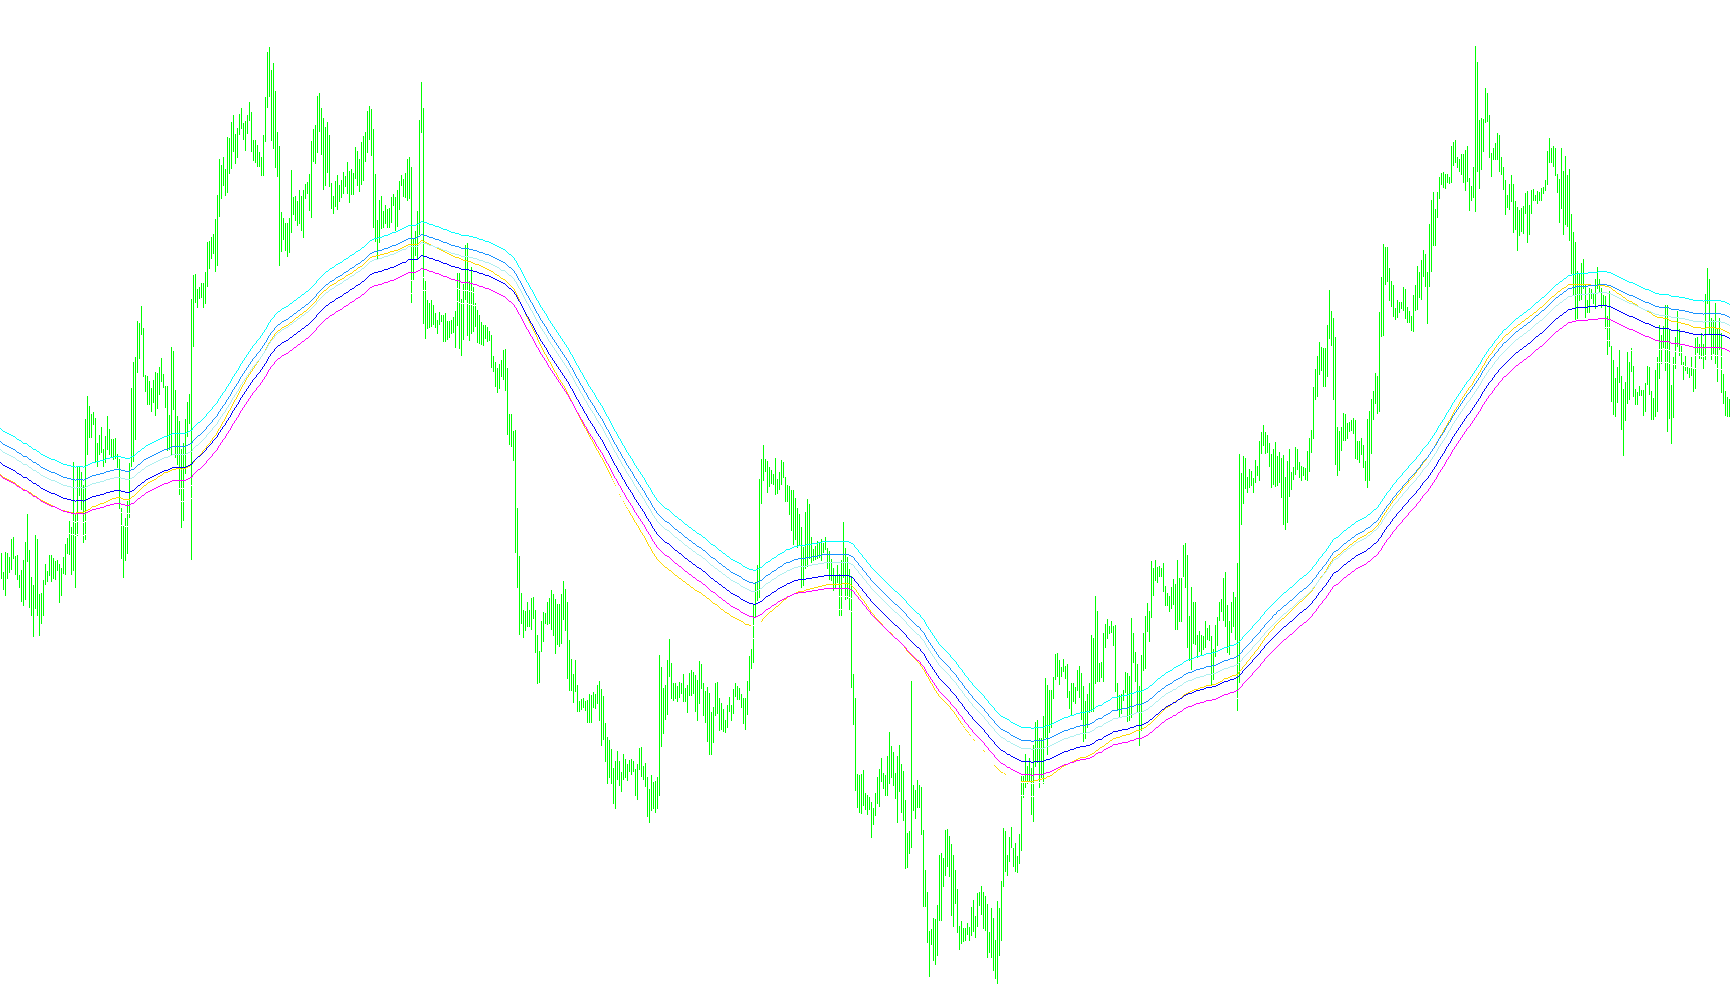
The logic utilizes a multi-layered non-linear smoothing algorithm that processes price data through dynamic power functions and recursive weight adjustments to filter high-frequency noise from underlying trend vectors.

Indicator

v+=-

iMAOnArray
V-T&B
Indicator

V-T&B

This indicator identifies potential trend exhaustion by detecting extended upper or lower wicks relative to a 10-bar average price range.

V-T&Bv6
Indicator

V-T&Bv6

This indicator detects high-momentum price reversals by identifying significant wick proportions that penetrate previous candle levels, filtered by an exponential moving average standard deviation threshold.

V-T&Bv6_v1
Indicator

V-T&Bv6_v1

This indicator identifies potential price exhaustion by detecting significant wicks relative to candle bodies coupled with specific standard deviation velocity thresholds.

V-T&Bv6_v2
Indicator

V-T&Bv6_v2

This indicator identifies potential trend reversals by detecting significant wick proportions relative to candle bodies combined with smoothed standard deviation volatility filters.

V-T&B_v1
Indicator

V-T&B_v1

Identifies potential trend exhaustion by detecting candles where wick proportions significantly exceed body size relative to a ten-bar average price range.

V-TBv6
Indicator

V-TBv6

Identifies potential trend exhaustion by filtering price action for significant wicks relative to body size while confirming extreme volatility via an EMA-based Standard Deviation threshold.

v35260_Colored
Indicator

v35260_Colored

iMAOnArray

This indicator calculates the rate of change between consecutive smoothed Heiken Ashi values and visualizes momentum shifts via a dual-histogram tracking system and an overlaid SMA signal line.

Indicator

Vahrokh-Gann-ICWR v0.1.1 beta5_alert

iRSI
valasholic13 BreakOutch
Indicator

valasholic13 BreakOutch

This indicator calculates daily pivot levels based on the previous period's high, low, and closing prices to identify multi-stage breakout zones and target coordinates.

valasholic13 BreakOutch_v1
Indicator

valasholic13 BreakOutch_v1

This indicator identifies daily price pivot points and dynamically projects tiered support, resistance, and target zones based on previous session high-low volatility.

valasholic13 BreakOutch_v2
Indicator

valasholic13 BreakOutch_v2

This indicator calculates daily pivot points and dynamic support/resistance levels based on previous high, low, and closing prices to identify breakout zones and target coordinates.

valasholic13 BreakOutch_v3
Indicator

valasholic13 BreakOutch_v3

This indicator calculates daily pivot points and dynamic support/resistance levels to identify high-probability breakout entries and targets based on previous day's price extremes.

valasssp
Indicator

valasssp

iMACDiMAiRSIiStochastic

This indicator identifies high-probability trade entries by synchronizing EMA trends across M30, H1, H4, and D1 timeframes while validating momentum via RSI and MACD crossovers.

Indicator

vanman1.0

iMA
Var Mov Avg
Indicator

Var Mov Avg

This indicator calculates an adaptive moving average that dynamically adjusts its sensitivity based on the ratio of price displacement to cumulative volatility noise.

Var Mov Avg2
Indicator

Var Mov Avg2

This indicator calculates a dynamic moving average that adjusts its responsiveness based on the ratio of price volatility to local noise, generating directional signals when momentum exceeds a defined threshold.

Var Mov Avg3
Indicator

Var Mov Avg3

This indicator calculates a dynamic moving average by weighting price fluctuations against historical noise to identify significant momentum shifts and generate directional signal arrows.

Var Mov Avg_v1
Indicator

Var Mov Avg_v1

This indicator calculates an Adaptive Moving Average by weighing price changes against cumulative volatility noise to identify significant trend reversals via dynamic threshold triggers.

VarBreakInd
Indicator

VarBreakInd

Identifies and projects price volatility boundaries by calculating high and low extremes across specific pre-defined time windows to signal potential breakout entries.

Variator
Indicator

Variator

iMA

This indicator identifies trend direction by measuring the cumulative price variation of a moving average and signaling reversals through bullish or bearish candle flips during active momentum states.

VarMA_v1.1
Indicator

VarMA_v1.1

iMAOnArray

The logic utilizes an ADX-based momentum volatility filter to dynamically adjust the smoothing constant of a moving average, reacting to trend strength while neutralizing noise in stagnant markets.

Vasily Pip Sniper bar v3.1 alert
Indicator

Vasily Pip Sniper bar v3.1 alert

iMAiMAOnArray

This indicator identifies trend reversals by calculating the differential between dual moving average deviations and dynamic momentum offsets.

Indicator

Vasily Pip Sniper bar v3.1 alert_001

iMAiMAOnArray
Vasily Pip Sniper bar v3.1
Indicator

Vasily Pip Sniper bar v3.1

iMAiMAOnArray

The algorithm identifies directional shifts by calculating the differential between nested moving average deviations across dynamic, timeframe-adaptive periods.

Vasily_Pip_Sniper_v3.1
Indicator

Vasily_Pip_Sniper_v3.1

iMAiMAOnArray

This indicator calculates the differential between multi-layered moving average deviations to identify momentum shifts across varying timeframes.

Vasily_Pip_Sniper_v3.1Ratio
Indicator

Vasily_Pip_Sniper_v3.1Ratio

iMAiMAOnArray

This indicator calculates the relative momentum between two moving averages by computing the percentage difference of their respective linear regressions.

Vasily_Pip_Sniper_v3.1Ratio2xx
Indicator

Vasily_Pip_Sniper_v3.1Ratio2xx

iMAiMAOnArray

This indicator calculates the percentage divergence between smoothed moving averages and their derived linear components to identify momentum shifts across multiple timeframes.

VAZ2107U
Indicator

VAZ2107U

iMA

Identifies high-probability entry points by synchronizing 7/21 SMA crossovers with Gann HiLo Activator trend confirmation and open price positioning.

Vegas Currency Daily
Indicator

Vegas Currency Daily

iMA

This indicator projects symmetrical Fibonacci retracement levels around an Exponential Moving Average to identify potential price reversal and liquidity zones.

Vegas Tunnel
Indicator

Vegas Tunnel

This algorithm utilizes a multi-tiered take-profit framework anchored by envelope deviation thresholds to capture price oscillations within specific chronological windows.

Vegas1HR
Indicator

Vegas1HR

iMA

This indicator projects dynamic Fibonacci retracement levels based on the deviation from a primary 169-period Exponential Moving Average to identify structural support and resistance zones.

Vegas1HR_v1
Indicator

Vegas1HR_v1

iMA

This indicator projects a multi-layered Fibonacci retracement framework centered around a 169 EMA to identify high-probability price reversal and support/resistance levels.

Vegas1HR_v2
Indicator

Vegas1HR_v2

iMA

This indicator projects dynamic price zones based on a secondary EMA baseline using Fibonacci sequence offsets to identify potential liquidity areas and mean reversion levels.

Vegas1HR_v3
Indicator

Vegas1HR_v3

iMA

This indicator projects symmetric Fibonacci-based price levels around a primary Exponential Moving Average to identify potential liquidity zones and structural pivot points.

Velocity_v2
Indicator

Velocity_v2

iMAOnArray

This indicator quantifies price velocity by applying multiple layers of moving average smoothing to the raw point change between consecutive bars.

Velocity_v2_v1
Indicator

Velocity_v2_v1

iMAOnArray

This indicator calculates price change rates and applies multi-layered moving averages to smooth the underlying velocity into a nested signal for identifying trend momentum.

Indicator

Vertical Line

Indicator

Vertical Lines

Indicator

Vertical Line_v1

vForce_Like_Indy
Indicator

vForce_Like_Indy

iBearsPoweriADXiRSIiStochastic

This indicator identifies high-probability trend reversals by synchronizing bullish and bearish signals across Stochastic, RSI, ADX, MACD, Bull/Bear Power, Rate of Change, and Bollinger Bands.

VHF
Indicator

VHF

Quantifies the intensity of price expansion by calculating the ratio between the absolute range of highest and lowest highs over a period against the sum of sequential price movements.

Indicator

vHistory

Via
Indicator

Via

This indicator calculates a synthetic product of two currency pairs to identify price divergence and signal potential reversals based on spread-adjusted threshold breaches.

VIC_Currency_Manager
Indicator

VIC_Currency_Manager

An on-screen telemetry tool that aggregates real-time account metrics, trade distributions, and equity drawdown percentages into a unified visual interface.

VIDYA
Indicator

VIDYA

iStdDev

This indicator calculates a Variable Index Dynamic Average by scaling the smoothing coefficient based on the ratio of short-term to long-term standard deviations.

ViewOrdersProfit
Indicator

ViewOrdersProfit

The script iterates through active market positions to calculate and display a unified profit figure scaled to a standardized lot size.

VininI ConstTickHeikenAshi R
Indicator

VininI ConstTickHeikenAshi R

This indicator projects synthetic Heiken Ashi price action by merging smoothed tick-based volatility data with traditional candlestick arithmetic to filter market noise.