TSI-Osc(4AUG05)
Download script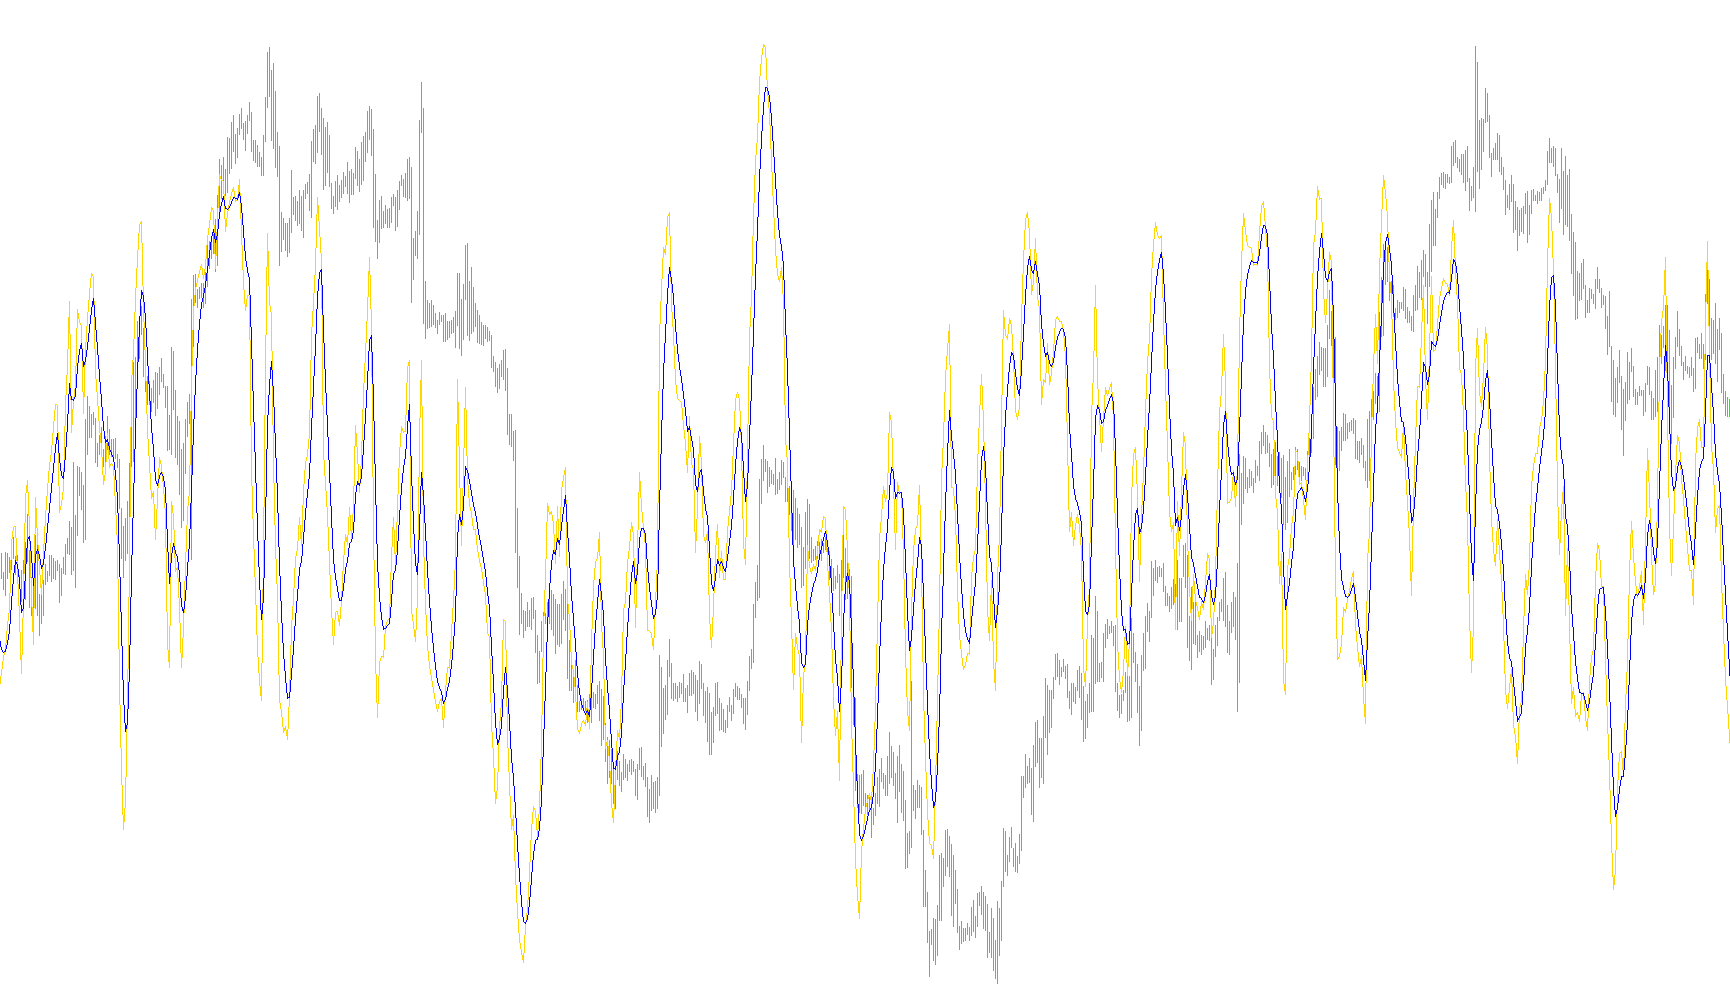
This indicator is designed to help traders identify the strength and direction of price trends by analyzing momentum. It works by comparing how much a price is moving in a specific direction against the total intensity of its movements, effectively "filtering out" the noise of minor fluctuations to provide a clearer picture of the market's pulse.
How it Works: The Core Logic
The script processes data through several layers of calculation to arrive at its final visual output:
1. Measuring Raw Momentum First, the tool looks at the immediate change between current prices and previous prices. This establishes the basic "momentum"—whether the price is moving up or down and by how much.
2. Analyzing Absolute Intensity Simultaneously, the script calculates the "absolute" value of that momentum. By ignoring whether the move was up or down and only looking at the magnitude (the size of the move), the tool can understand the overall volatility or energy present in the market regardless of direction.
3. Smoothing the Data Raw price data can be erratic. To make the information more readable, the script applies multiple layers of "Exponential Moving Averages" (EMA) to both the momentum and the absolute intensity. This acts like a high-quality filter, smoothing out jagged spikes and focusing on the underlying trend of the price action.
4. The TSI Calculation The final TSI (True Strength Index) value is generated by taking the smoothed momentum and dividing it by the smoothed absolute intensity. By multiplying this result by 100, the script produces a normalized number that represents the "True Strength" of the current trend.
5. The Signal Line Finally, the tool generates a Signal Line. This is a secondary, even smoother average of the TSI. Traders use this line to identify shifts in momentum; when the primary TSI line crosses over or under this Signal Line, it often suggests a potential change in the market's trend direction.
Summary for Traders
Instead of just looking at whether the price is going up or down, this indicator tells you how strongly it is moving in that direction relative to its recent history. It provides a dual-line visualization (the TSI and the Signal) to help identify when a trend is gaining strength, losing steam, or preparing for a potential reversal.
/*-----------------------------+
|			       |
| Shared by www.Aptrafx.com    |
|			       |
+------------------------------*/

//+------------------------------------------------------------------+
//|                                                          TSI.mq4 |
//|                      Copyright © 2005, MetaQuotes Software Corp. |
//|                                        http://www.metaquotes.net |
//+------------------------------------------------------------------+
#property copyright "Copyright © 2005, MetaQuotes Software Corp."
#property link      "http://www.metaquotes.net"

#property indicator_separate_window
#property indicator_buffers 2
#property indicator_color1 White
#property indicator_color2 Red
#property indicator_maximum 100
#property indicator_minimum -100
#property indicator_level1 0
//---- input parameters
extern int       First_R=8;
extern int       Second_S=5;
extern int       SignalPeriod=5;
extern int       Mode_Smooth=1;
//---- buffers
double TSI_Buffer[];
double SignalBuffer[];
double MTM_Buffer[];
double EMA_MTM_Buffer[];
double EMA2_MTM_Buffer[];
double ABSMTM_Buffer[];
double EMA_ABSMTM_Buffer[];
double EMA2_ABSMTM_Buffer[];
//+------------------------------------------------------------------+
//| Custom indicator initialization function                         |
//+------------------------------------------------------------------+
int init()
  {
//---- indicators
   IndicatorBuffers(8);
   SetIndexBuffer(2, MTM_Buffer);
   SetIndexBuffer(3, EMA_MTM_Buffer);
   SetIndexBuffer(4, EMA2_MTM_Buffer);
   SetIndexBuffer(5, ABSMTM_Buffer);
   SetIndexBuffer(6, EMA_ABSMTM_Buffer);
   SetIndexBuffer(7, EMA2_ABSMTM_Buffer);

   SetIndexStyle(0,DRAW_LINE);
   SetIndexBuffer(0,TSI_Buffer);
   SetIndexLabel(0,"TSI");
   SetIndexStyle(1,DRAW_LINE);
   SetIndexBuffer(1,SignalBuffer);
   SetIndexLabel(1,"Signal");
   IndicatorShortName("TSI"+"("+First_R+","+Second_S+","+SignalPeriod+")");

//----
   return(0);
  }
//+------------------------------------------------------------------+
//| Custor indicator deinitialization function                       |
//+------------------------------------------------------------------+
int deinit()
  {
//---- TODO: add your code here

//----
   return(0);
  }
//+------------------------------------------------------------------+
//| Custom indicator iteration function                              |
//+------------------------------------------------------------------+
int start()
  {
   int    counted_bars=IndicatorCounted();
   int limit,i;
   limit=Bars-counted_bars-1;
   for (i=Bars-1;i>=0;i--)
      {
      MTM_Buffer[i]=Close[i]-Close[i+1];//iMomentum(NULL,0,1,PRICE_CLOSE,i);
      ABSMTM_Buffer[i]=MathAbs(MTM_Buffer[i]);
      }

   for (i=Bars-1;i>=0;i--)
      {
      EMA_MTM_Buffer[i]=iMAOnArray(MTM_Buffer,0,First_R,0,MODE_EMA,i);
      EMA_ABSMTM_Buffer[i]=iMAOnArray(ABSMTM_Buffer,0,First_R,0,MODE_EMA,i);
      }

   for (i=Bars-1;i>=0;i--)
      {
      EMA2_MTM_Buffer[i]=iMAOnArray(EMA_MTM_Buffer,0,Second_S,0,MODE_EMA,i);
      EMA2_ABSMTM_Buffer[i]=iMAOnArray(EMA_ABSMTM_Buffer,0,Second_S,0,MODE_EMA,i);
      }

   for (i=limit;i>=0;i--)
      {
      TSI_Buffer[i]=100.0*EMA2_MTM_Buffer[i]/EMA2_ABSMTM_Buffer[i];
      }
   for (i=limit;i>=0;i--)
      {
      SignalBuffer[i]=iMAOnArray(TSI_Buffer,0,SignalPeriod,0,Mode_Smooth,i);
      }

//---- TODO: add your code here

//----
   return(0);
  }
//+------------------------------------------------------------------+
Comments