TSR_custom
Download script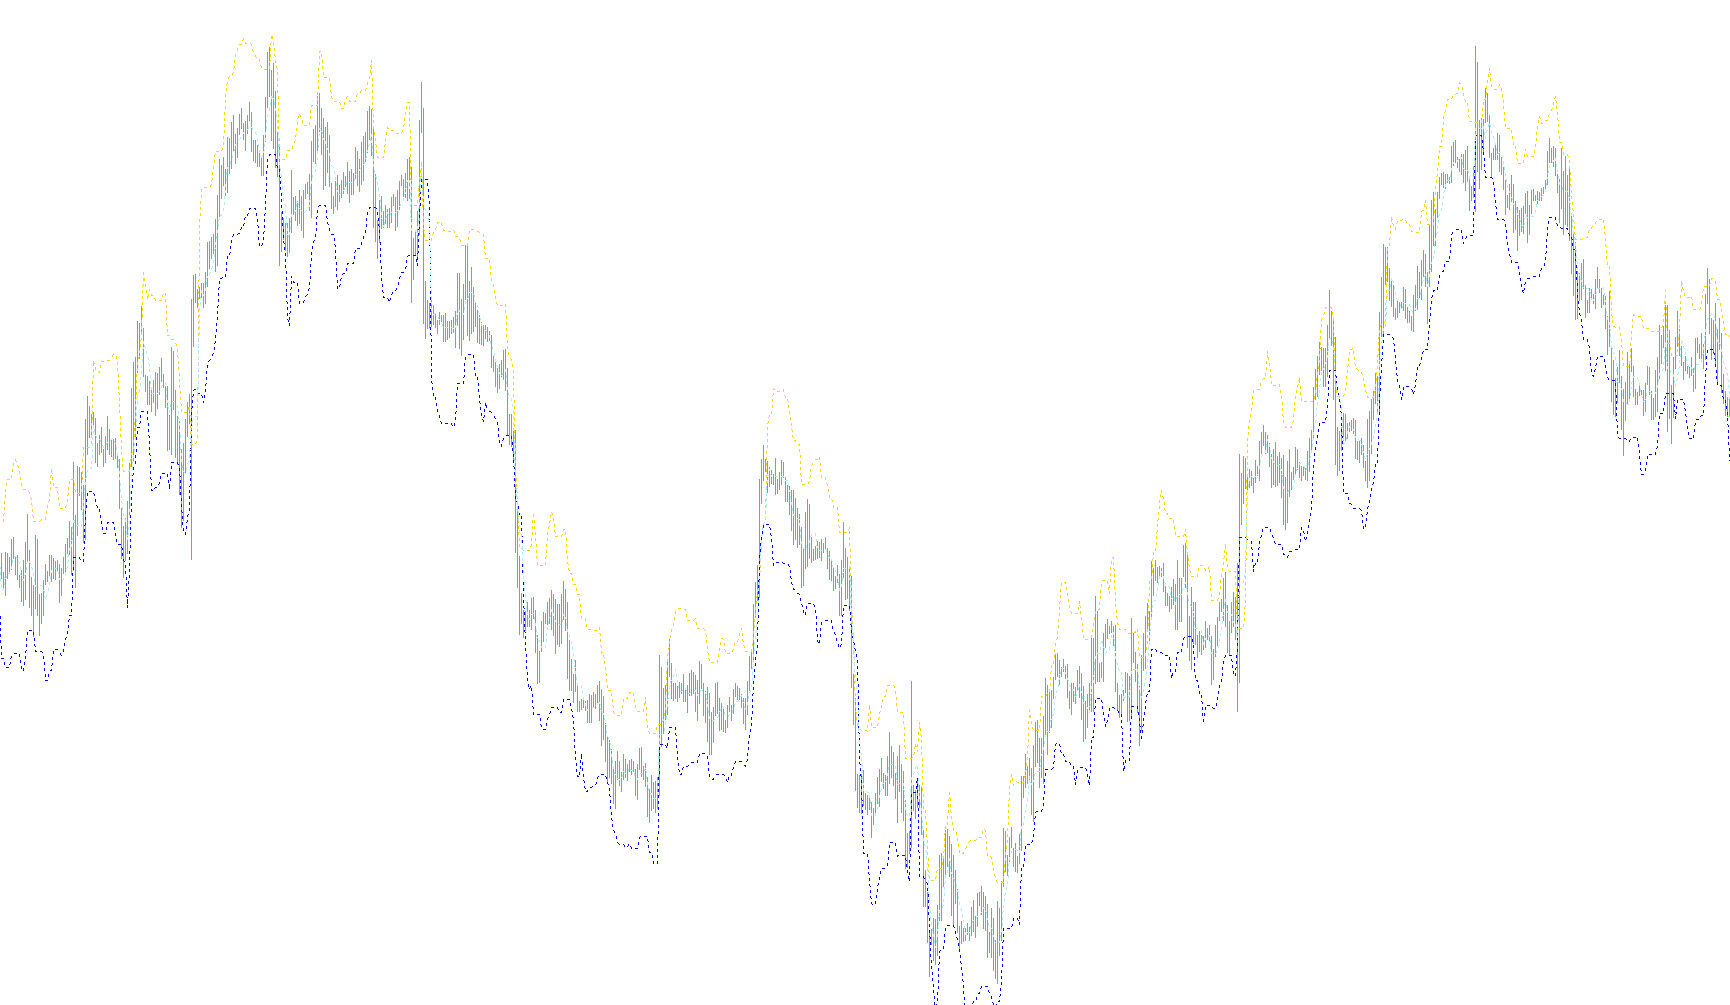
This script is a specialized technical analysis tool designed to help traders visualize price boundaries and volatility on their trading charts. By analyzing historical price action, it automatically calculates specific "channels" that represent potential zones of interest based on recent market behavior.
How the Logic Works
The tool operates by looking at two primary types of data: your current short-term price movement and your long-term historical averages. Here is the step-by-step breakdown of how it processes this information:
1. Defining the Lookback Window The script first looks at a specific window of time (defined by the "HoursLookBack" setting) to determine what the current day's highest and lowest prices are. This allows the tool to understand the immediate range in which the price is currently trading.
2. Calculating Volatility Factors To ensure the "channels" it draws are accurate, the script doesn't just look at today's movement in isolation. It performs a deep dive into historical data to calculate an average daily range. It examines several different timeframes (specifically looking back 1, 5, 10, and 20 days) to determine how much the price typically moves in a day. By averaging these figures, it creates a "Range Factor"—a consistent measurement of typical market volatility.
3. Mapping the Channels Once the script knows today's highs and lows, and it knows the typical daily volatility (the Range Factor), it builds three distinct visual lines on your chart:
- Upper Boundary: It takes today’s low price and adds a portion of the volatility factor to it.
- Lower Boundary: It takes today’s high price and subtracts a portion of the volatility factor from it.
- Average Center Line: It calculates the midpoint between these two boundaries, providing a "neutral" balance point for the current price action.
Summary of Visual Output
When you view this on a chart, the script provides a visual representation of where the price is currently operating relative to its normal volatility. Instead of just seeing raw high and low prices, you see a calculated corridor. The width of this corridor is controlled by a user-defined ratio, allowing you to widen or narrow the "safety zone" based on your specific trading style.
In simple terms: it tells you, "Based on how much this asset usually moves over the last several weeks, here is the expected boundary for today's price action."
#property indicator_chart_window
#property indicator_buffers 3
#property indicator_color1 SpringGreen
#property indicator_color2 OrangeRed
#property indicator_color3 White

extern double ChannelWidth=0.5;
extern double HoursLookBack=4.0;

double RangeUP[], RangeDOWN[], AvRange[];
double RangeFactor=0;
int currday,cnt,lookback;
double TodaysLow;
double TodaysHigh;

int init()
  {
   lookback = (HoursLookBack*60)/Period();

   SetIndexStyle(0,DRAW_LINE,STYLE_DOT);
   SetIndexBuffer(0,RangeUP);
   SetIndexStyle(1,DRAW_LINE,STYLE_DOT);
   SetIndexBuffer(1,RangeDOWN);
   SetIndexStyle(2,DRAW_LINE,STYLE_DOT);
   SetIndexBuffer(2,AvRange);

   IndicatorDigits(MarketInfo(Symbol(),MODE_DIGITS));
  }
//+------------------------------------------------------------------+
//| expert deinitialization function                                 |
//+------------------------------------------------------------------+
int deinit()
  {
//----

//----
   return(0);
  }
//+------------------------------------------------------------------+
//| expert start function                                            |
//+------------------------------------------------------------------+
int start()
  {
   Comment("Lookback hours = ",HoursLookBack,", Bars = ",lookback, " Channel width ratio = ",ChannelWidth);

   int counted_bars = IndicatorCounted();
   if(counted_bars < 0)
       return(-1);
   if(counted_bars > 0)
       counted_bars--;
   int limit = Bars - counted_bars-200;

   for(cnt = 0; cnt < limit ; cnt++)
     {
         currday=MathFloor(cnt*Period()/1440);

         //if(TimeDay(Time[cnt]) != TimeDay(Time[cnt+1]))
         //{
           double Range1=Range(1);
           double Range5=Range(5);
           double Range10=Range(10);
           double Range20=Range(20);
           double AverageRange=(Range1+Range5+Range10+Range20)/4;
           RangeFactor=AverageRange*ChannelWidth;
           RangeFactor=NormalizeDouble(RangeFactor,Digits);
         //}

         TodaysLow=Low[iLowest(NULL,0,MODE_LOW,lookback,cnt)];
         TodaysHigh=High[iHighest(NULL,0,MODE_HIGH,lookback,cnt)];

         RangeUP[cnt] = TodaysLow + RangeFactor;
         RangeDOWN[cnt] = TodaysHigh - RangeFactor;
         AvRange[cnt] = ((TodaysLow + RangeFactor)+(TodaysHigh - RangeFactor))/2;

    }
   }
//+------------------------------------------------------------------+

double Range (int Days)
{
   double DailyHigh,DailyLow,DailyRange,TotalRange,AR=0;

   for (int i=1;i<=Days;i++)
   {
         int WeekDay=TimeDayOfWeek(iTime(NULL, PERIOD_D1,i+currday));
         if (WeekDay != 0 || WeekDay != 6)
         {
            DailyHigh=iHigh(Symbol(),PERIOD_D1,i+currday);
            DailyLow=iLow(Symbol(),PERIOD_D1,i+currday);
            DailyRange=(DailyHigh-DailyLow);
            TotalRange=TotalRange+DailyRange;
         }
         else
         {
            Days=Days+1;
         }
   }

   AR=TotalRange/Days;
   AR=NormalizeDouble(AR,Digits);
   return(AR);
}
Comments