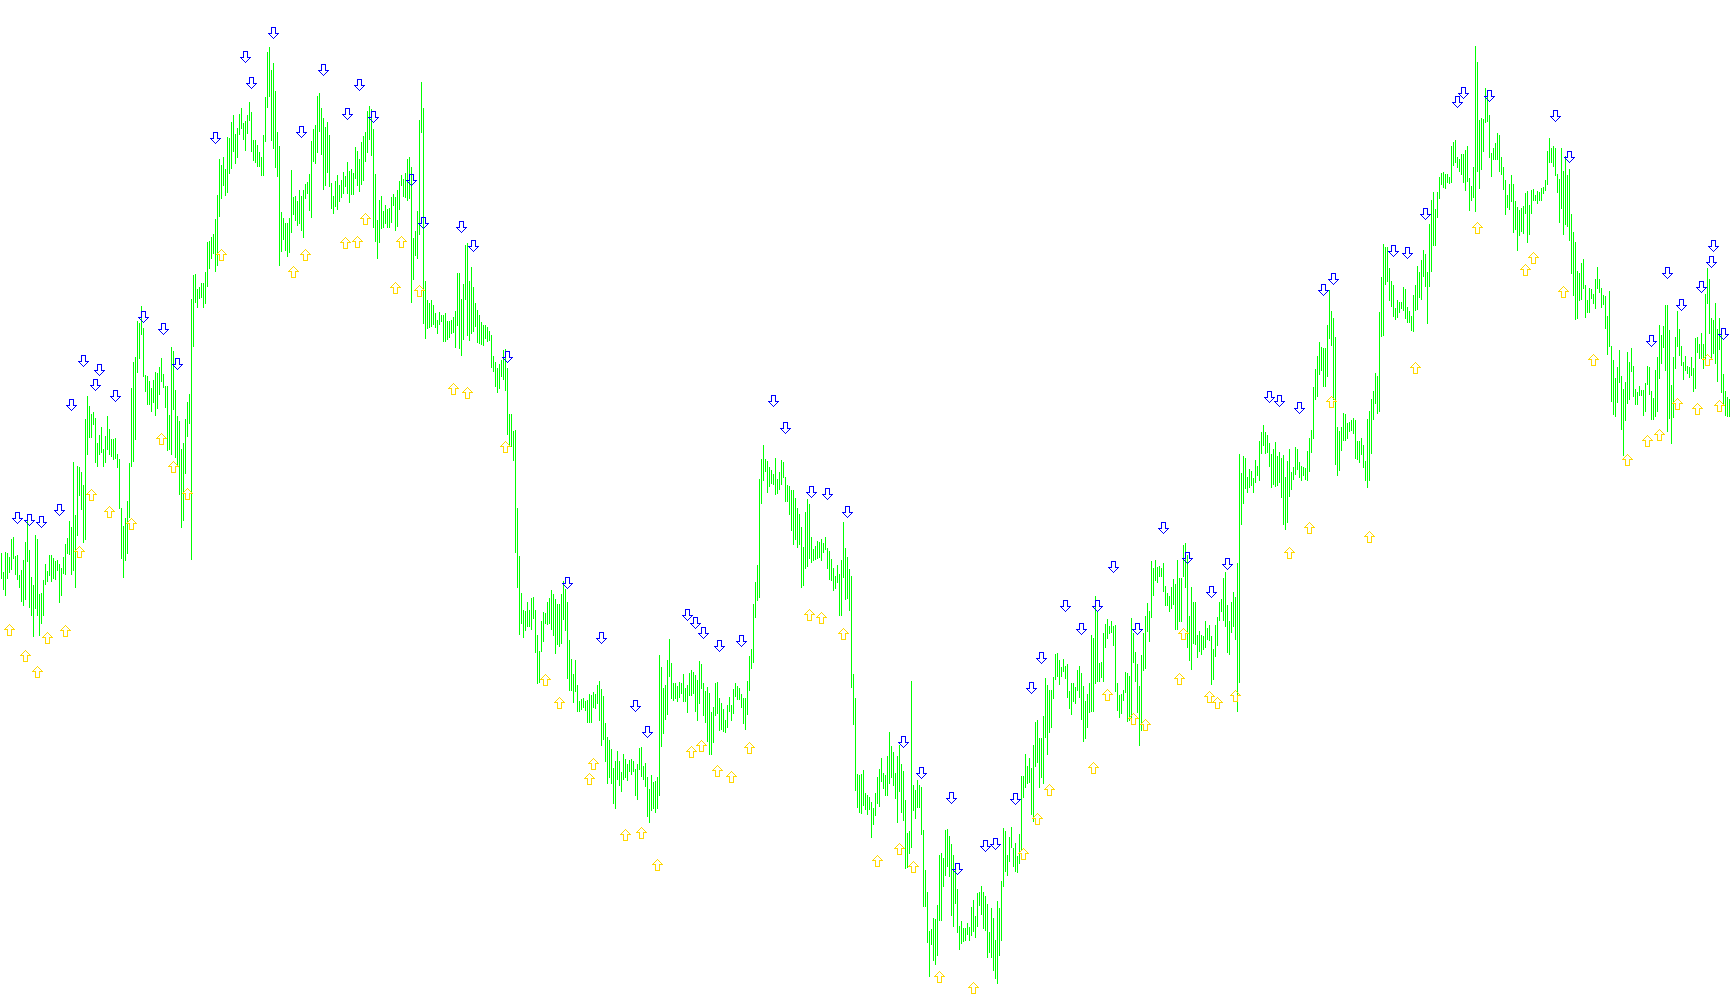
Triggerlines_003
Indicator

Triggerlines_003

This indicator identifies bullish momentum by calculating a Linear Weighted Moving Average and highlighting instances where current price weight exceeds its own smoothed linear acceleration.

TriggerLines_AlertEmailSounds
Indicator

TriggerLines_AlertEmailSounds

This indicator identifies trend shifts by calculating a weighted moving average of price closes and comparing it against a linear smoothed moving average to highlight momentum crossovers.

Indicator

Triggerlines_mtf

TriggerLines_SigAlertEmailSounds_cw
Indicator

TriggerLines_SigAlertEmailSounds_cw

iATR

This indicator identifies trend reversals by calculating the intersection of a weighted momentum value against a Linear Smoothed Moving Average (LSMA).

TriggerLines_SigAlertEmailSounds_sw
Indicator

TriggerLines_SigAlertEmailSounds_sw

iATR

This indicator identifies trend reversals by monitoring the crossover between a weighted linear moving average and its secondary smoothed velocity component.

Triggerlines_v1
Indicator

Triggerlines_v1

This indicator calculates a linearly weighted moving average and overlays it against a smoothed LSMA to identify trend momentum via conditional line visibility.

Triggerlines_v2
Indicator

Triggerlines_v2

This indicator identifies bullish momentum by plotting weighted price averages only when they exceed a specific linear smoothed moving average threshold.

Triggerlines_v3
Indicator

Triggerlines_v3

This indicator identifies bullish momentum by filtering price action where the weighted moving average exceeds its linear trend projection.

TriggerLines_v4
Indicator

TriggerLines_v4

This indicator identifies bullish momentum by calculating a linear weighted moving average and filtering for price action that exceeds its baseline.

Indicator

TripleCCI_Woodies-JMA

TripleCCI_Woodies
Indicator

TripleCCI_Woodies

iCCI

This indicator identifies directional momentum by synchronizing three distinct CCI periods to visualize trend persistence, entry opportunities, and rapid velocity shifts.

Indicator

TripleCCI_Woodies_v2

iCCI
Indicator

Trix log + alert

iMAiMAOnArray
Indicator

Trix log + alert_001

iMA
Trix log
Indicator

Trix log

iMA

This indicator calculates a smoothed momentum oscillator by applying triple exponential moving averages to the natural logarithm of price data.

Trix tape
Indicator

Trix tape

iMAiMAOnArray

This indicator visualizes price velocity by calculating the percentage change of a triple-smoothed exponential moving average and plotting trend direction through a comparative signal line.

TRIX-with-alert
Indicator

TRIX-with-alert

iMAiMAOnArray

This indicator calculates the percentage rate of change of a triple-smoothed exponential moving average to identify momentum shifts through crossover signals.

Trix
Indicator

Trix

iMAiMAOnArray

This indicator calculates the rate of change of a triple smoothed moving average to identify momentum shifts and generates automated alerts on signal crossovers.

Trix_002
Indicator

Trix_002

iMAiMAOnArray

This indicator calculates the percentage rate of change from a triple-smoothed exponential moving average to identify momentum shifts and generate crossover alerts.

Trix_4c_alert_mtf
Indicator

Trix_4c_alert_mtf

iMAiMAOnArray

This indicator identifies trend shifts by calculating multi-layered moving average derivatives to generate cross-over signals between smoothed momentum components.

TRIX_A
Indicator

TRIX_A

iMAiMAOnArray

This indicator calculates the percentage rate of change of a triple smoothed exponential moving average to identify momentum shifts and trend reversals.

trix_AudioAlerts_trix
Indicator

trix_AudioAlerts_trix

iMACDiMAiStochastic

A comprehensive alert system that identifies high-probability trade entries by synthesizing MACD momentum, Stochastic oscillations, EMA crossovers, and Trix price action while monitoring real-time price interactions with trend objects.

TRIX_A_Mulloy
Indicator

TRIX_A_Mulloy

iMAiMAOnArray

This indicator calculates the percentage rate of change between consecutive Triple Exponential Moving Average values to identify momentum shifts.

Trix_osma4c_alert_mtf
Indicator

Trix_osma4c_alert_mtf

iMAiMAOnArray

This indicator calculates nested moving average recursions and smoothed momentum values to identify trend reversals and crossover signals across multiple timeframes.

Trix_v2
Indicator

Trix_v2

iMAiMAOnArray

This indicator calculates triple-smoothed moving averages to derive a momentum oscillator that identifies trend reversals through signal line crossovers.

Trix_v3
Indicator

Trix_v3

iMAiMAOnArray

This indicator calculates a three-layered smoothed moving average to derive price velocity and generates alerts based on momentum crossover transitions.

TRO market price
Indicator

TRO market price

This indicator renders real-time Ask, Bid, and spread values on the chart with automated color shifts based on price movement direction.

Indicator

tro_compass_xi

TRO_Multi_Meter_LinReg#Pr
Indicator

TRO_Multi_Meter_LinReg#Pr

This indicator aggregates visual trend bias from multiple timeframes by calculating the price delta of a linear regression slope across M1 through D1 periods.

TRO_Multi_Meter_LinReg#Pr1
Indicator

TRO_Multi_Meter_LinReg#Pr1

This indicator synchronizes and displays the directional momentum of linear regression values across seven different timeframes simultaneously on a single chart label.

TRO_Multi_Meter_LinReg
Indicator

TRO_Multi_Meter_LinReg

This indicator calculates the rate of change between current and historical linear regression values across seven different timeframes to visualize momentum synchronization on a single chart dashboard.

Indicator

TRSI

iMAOnArrayiRSI
TRSI1
Indicator

TRSI1

iMAOnArrayiRSI

This indicator computes a multi-layered smoothing of the Relative Strength Index by applying nested exponential moving averages followed by a displaced simple moving average to filter out market noise.

TRSI2
Indicator

TRSI2

iMAOnArrayiRSI

This indicator calculates a nested series of three consecutive 3-period exponential moving averages on a standard RSI, followed by a 5-period simple moving average with a 3-bar displacement to filter noise and identify smoothed trend momentum.

TRSI_2
Indicator

TRSI_2

iMAOnArrayiRSI

This indicator generates a smoothed momentum signal by applying nested exponential moving averages to an RSI base, followed by a shifted simple moving average for trend filtering.

TRSI_L
Indicator

TRSI_L

iMAOnArrayiRSI

This indicator generates a multi-layered smoothing effect by applying successive 3-period exponential moving averages to an RSI base, finalized with a lagged 5-period simple moving average.

Indicator

TRUE_SCALPER_V11

iMAiRSI
Try
Indicator

Try

iMAiMAOnArray

This script performs a cross-validation of Simple Moving Average calculations by comparing native indicator functions against manual iterative summation on raw closing prices.

Indicator

TR_EUR

TS
Indicator

TS

This algorithm autonomously updates stop-loss coordinates to lock in profits once price exceeds a predefined pip distance from the entry point.

TSD_CyAn_4_Cyber Cycle
Indicator

TSD_CyAn_4_Cyber Cycle

This indicator utilizes a weighted moving average of price medians processed through a recursive second-order differential equation to extract underlying cyclical trends.

TSD_CyAn_5_CG Oscillator
Indicator

TSD_CyAn_5_CG Oscillator

This indicator calculates a weighted average of median or typical prices over a specific lookback period to identify price momentum and trend direction.

TSD_CyAn_6_RVI
Indicator

TSD_CyAn_6_RVI

This indicator calculates a momentum ratio by averaging weighted price body ranges against weighted high-low volatility spans over a specified lookback period.

TSD_PP_MACD_FORCE_Ind_v1
Indicator

TSD_PP_MACD_FORCE_Ind_v1

iForceiMACD
TSD_PP_MACD_FORCE_Ind_v11
Indicator

TSD_PP_MACD_FORCE_Ind_v11

iForceiMACD
TSD_PP_MACD_FORCE_Ind_v1_v1
Indicator

TSD_PP_MACD_FORCE_Ind_v1_v1

iForceiMACD
TSD_PP_MACD_FORCE_Ind_v1_v2
Indicator

TSD_PP_MACD_FORCE_Ind_v1_v2

iForceiMACD
Indicator

tsd_tr_0[1].2_midweekplustrailtopriceliveeur

Indicator

tsd_tr_0[1].2_midweekplustrailtopricelivegbp

TSequential
Indicator

TSequential

This indicator identifies bullish and bearish trend exhaustion by counting consecutive price movements against the current direction to signal potential structural shifts.