Turbo_JRSX
Indicator

Turbo_JRSX

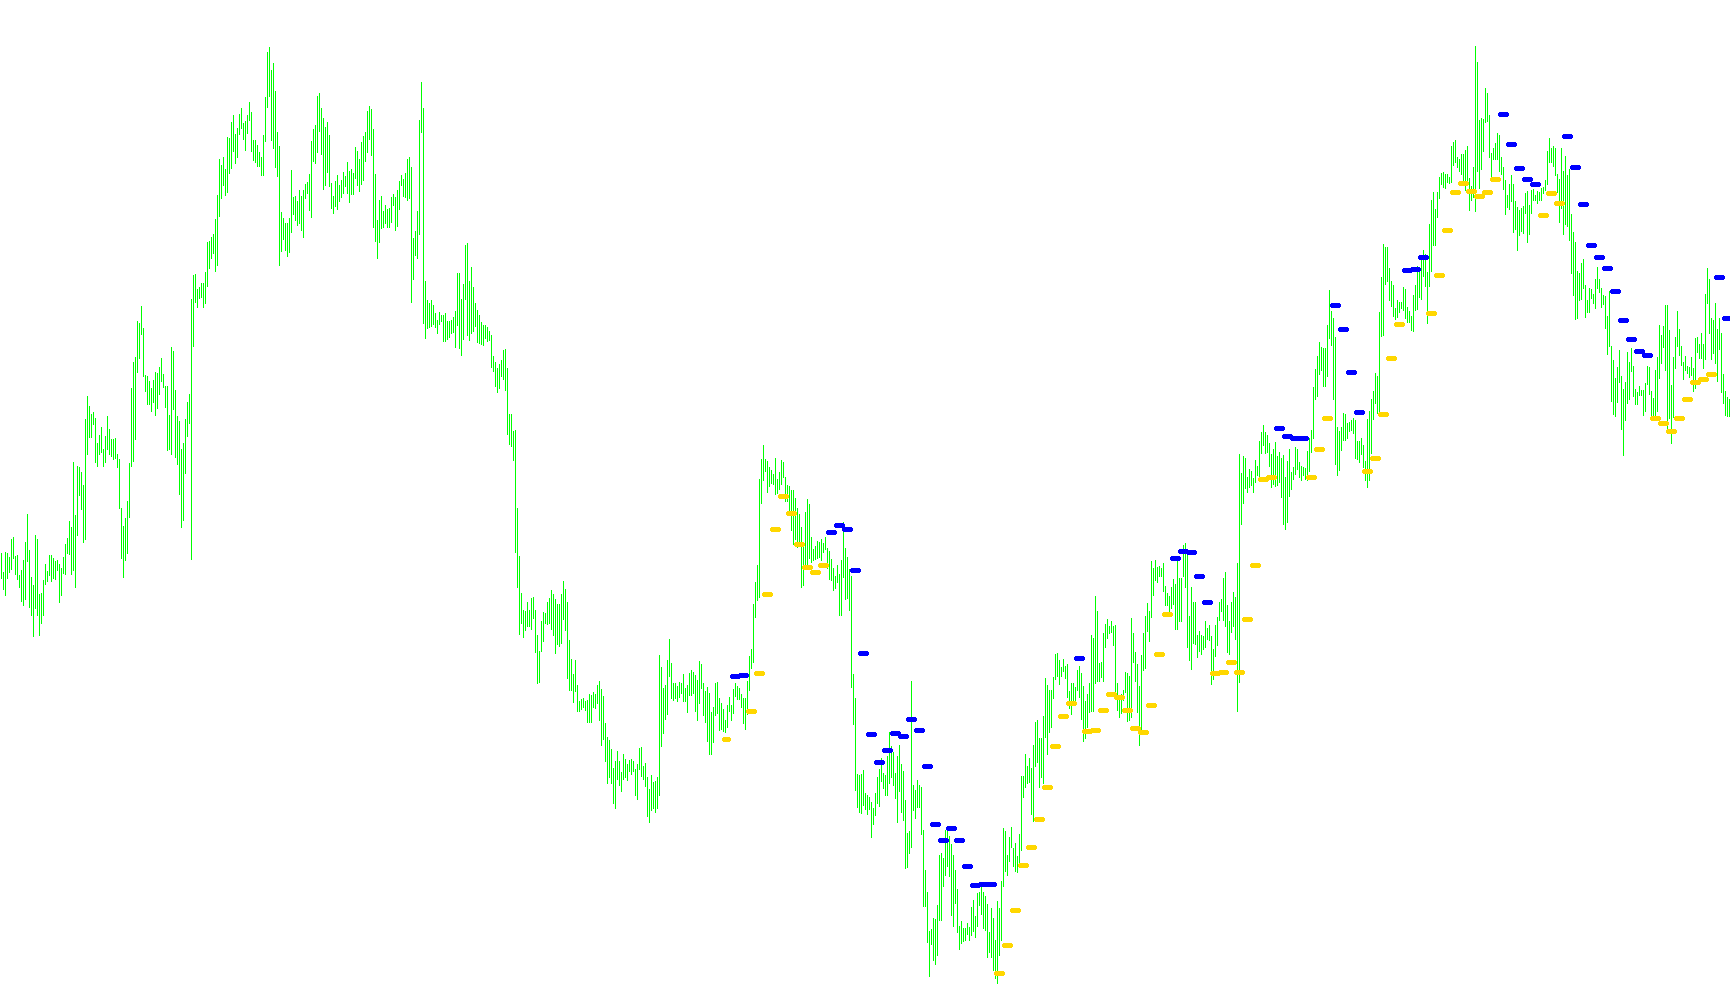
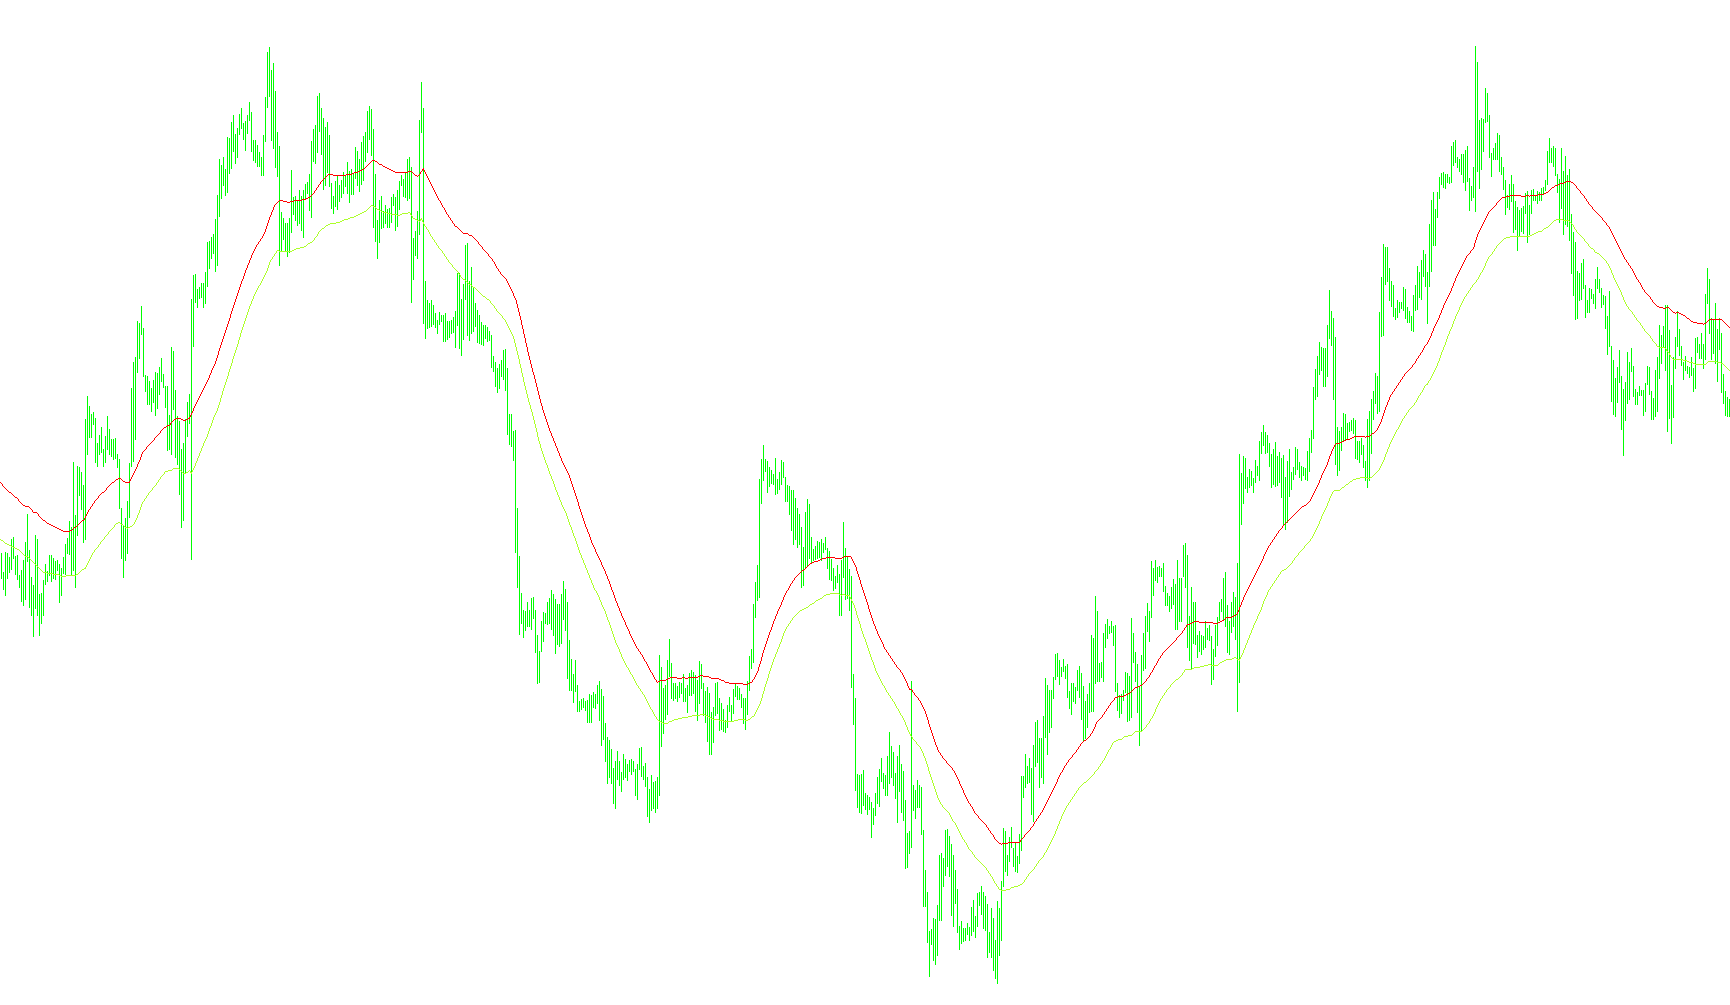
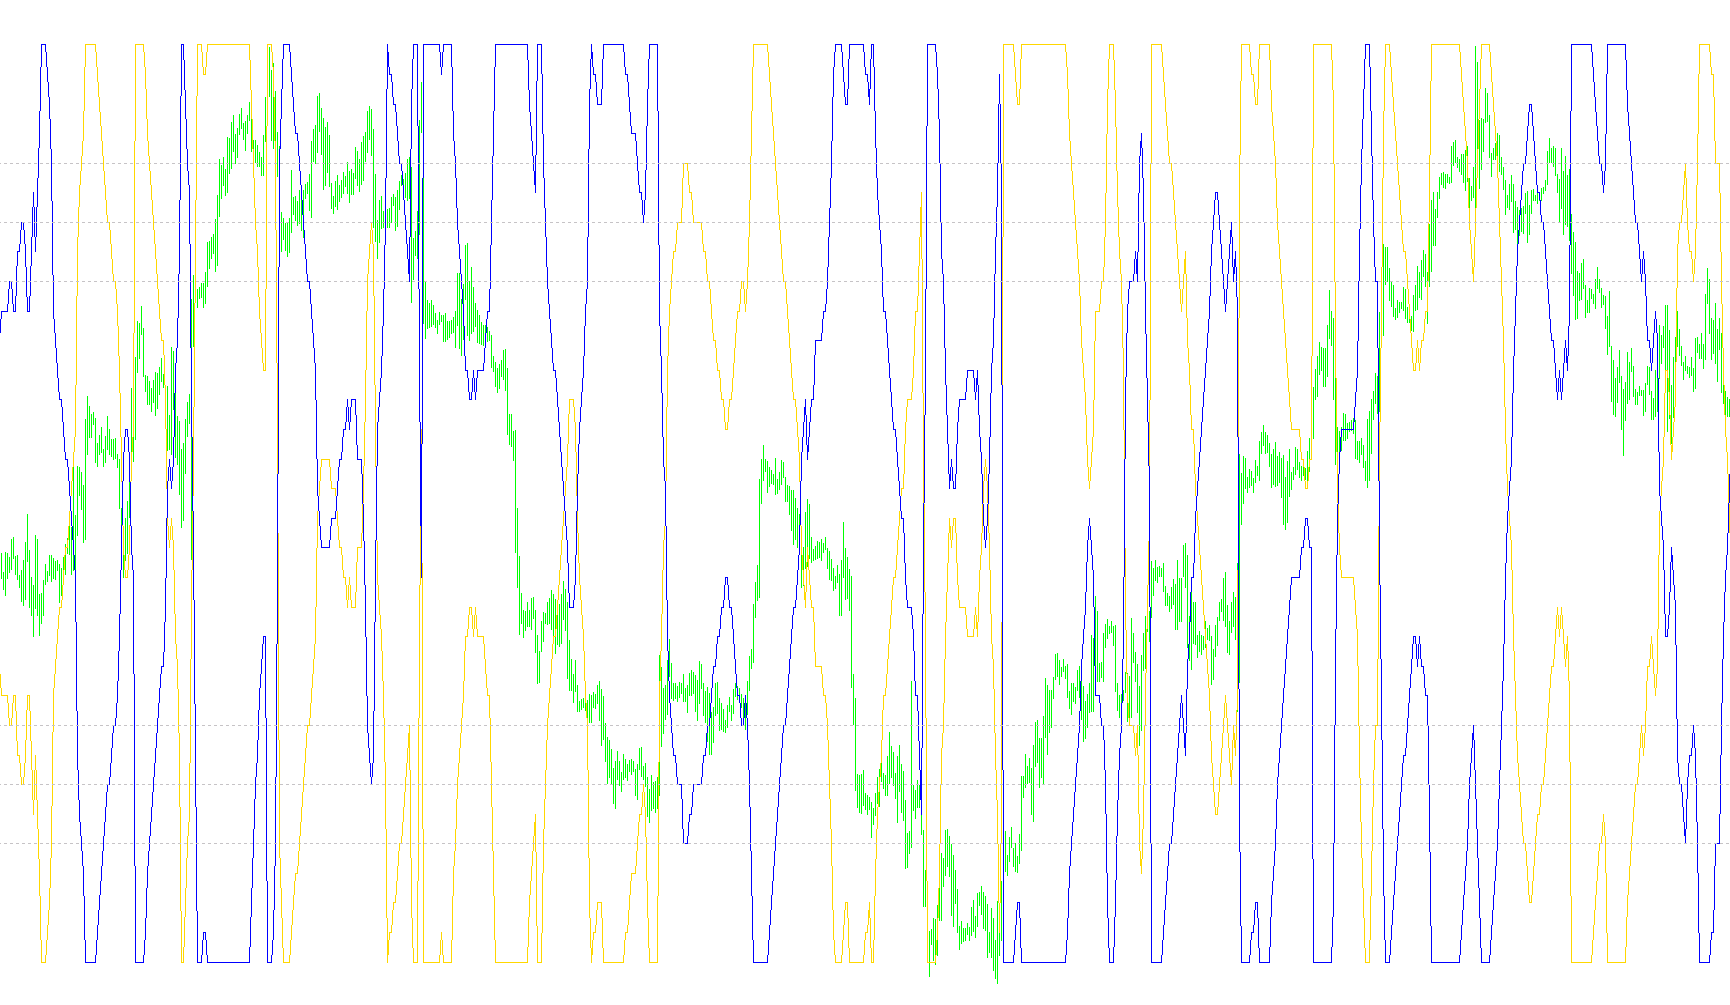
This indicator calculates a smoothed momentum value based on the geometric mean of high, low, and close prices to determine directional strength.

Turbo_JRSX_Close
Indicator

Turbo_JRSX_Close

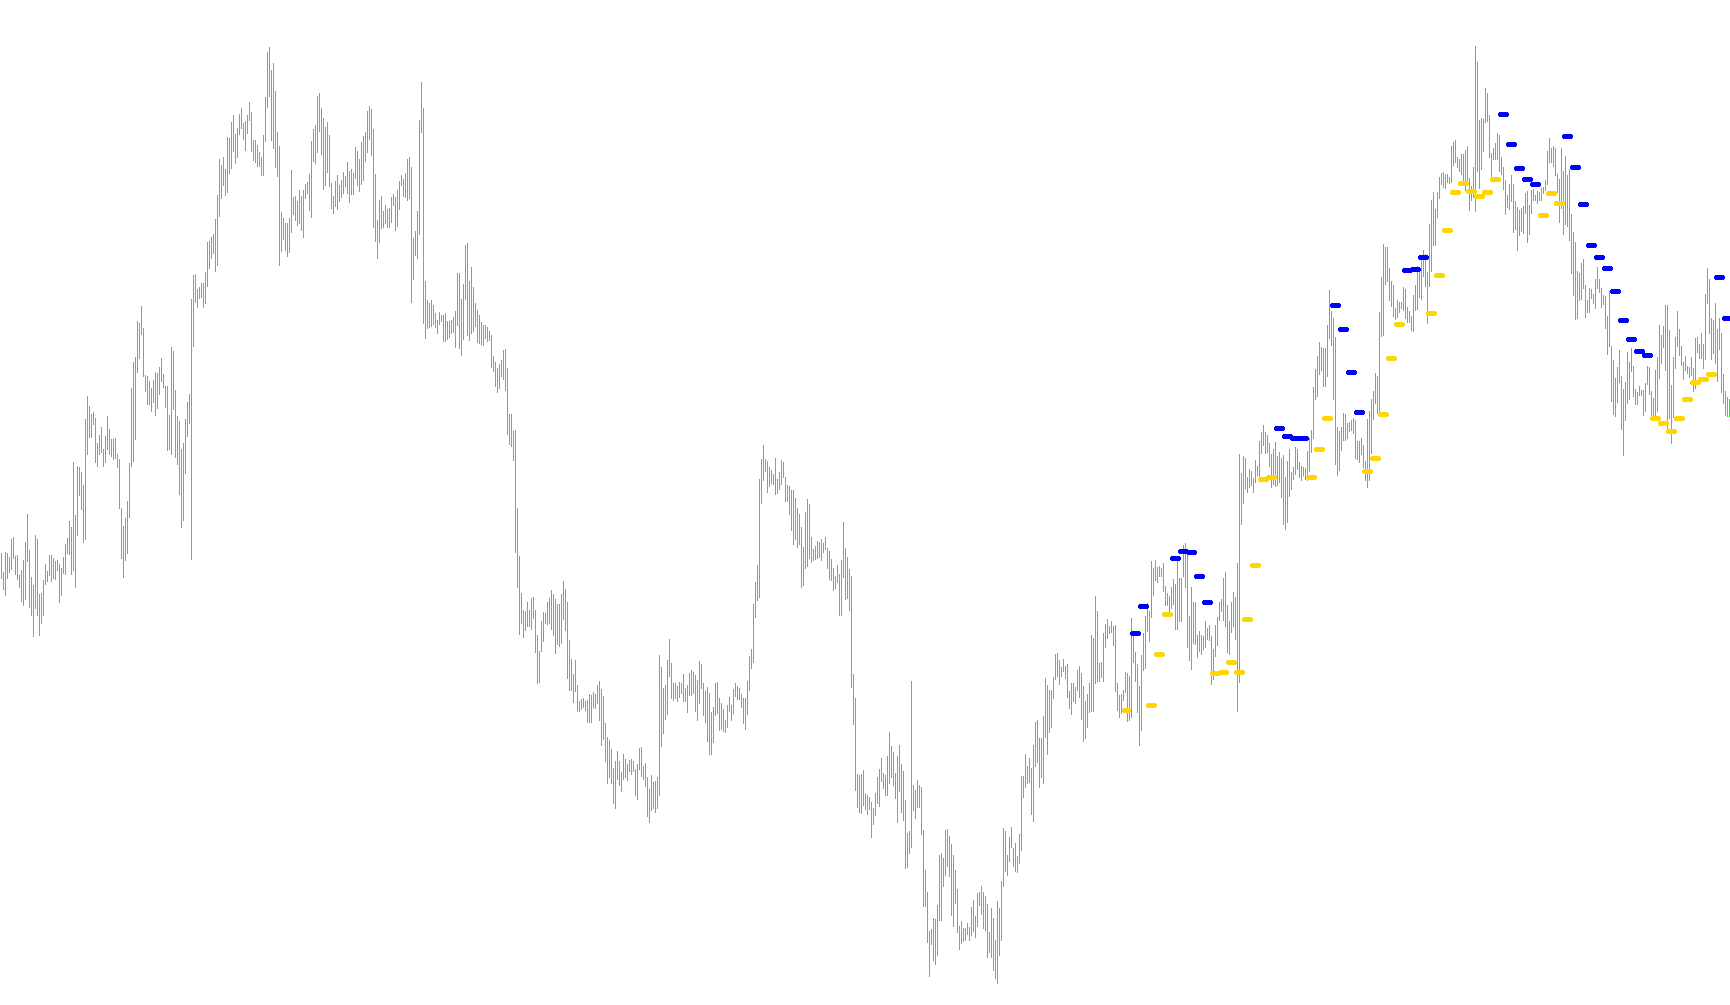
This indicator utilizes a multi-stage smoothed moving average chain with weighted variance components to calculate a relative momentum scale between 0 and 100.

Turbo_JRSX_v1
Indicator

Turbo_JRSX_v1

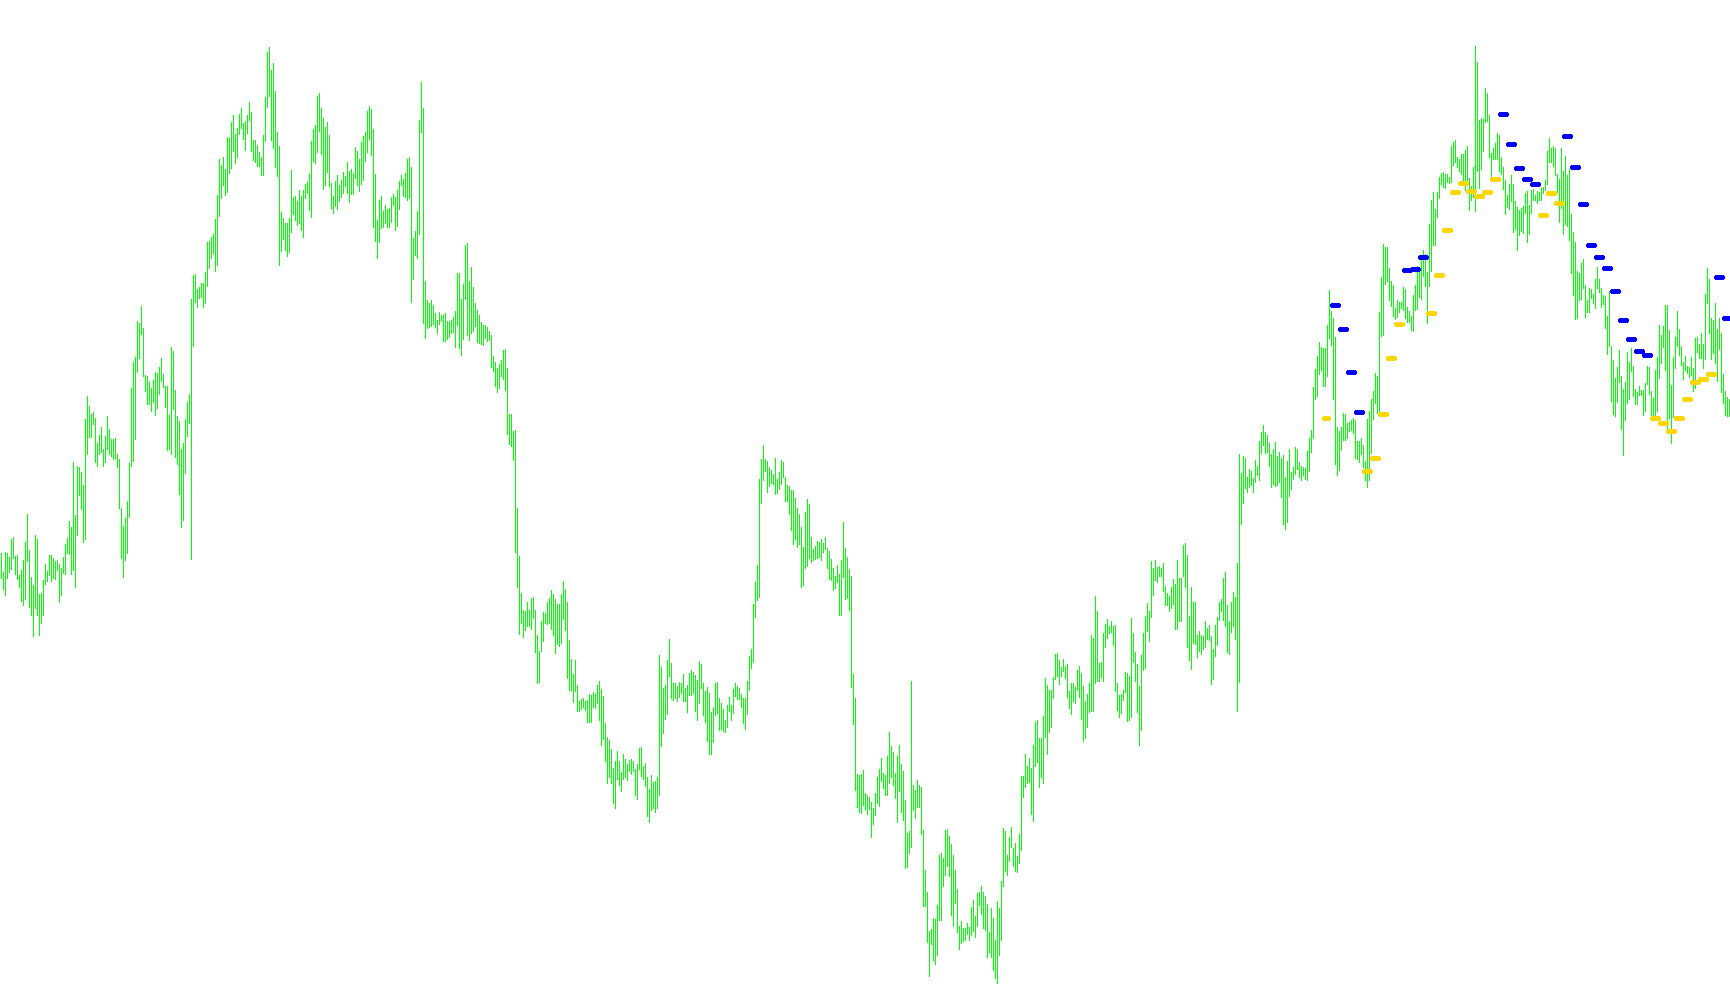
This indicator calculates price momentum by applying a multi-stage smoothing algorithm to the typical price (HLC/3) to identify trend intensity and potential reversals.

Turbo_JRSX_v3
Indicator

Turbo_JRSX_v3

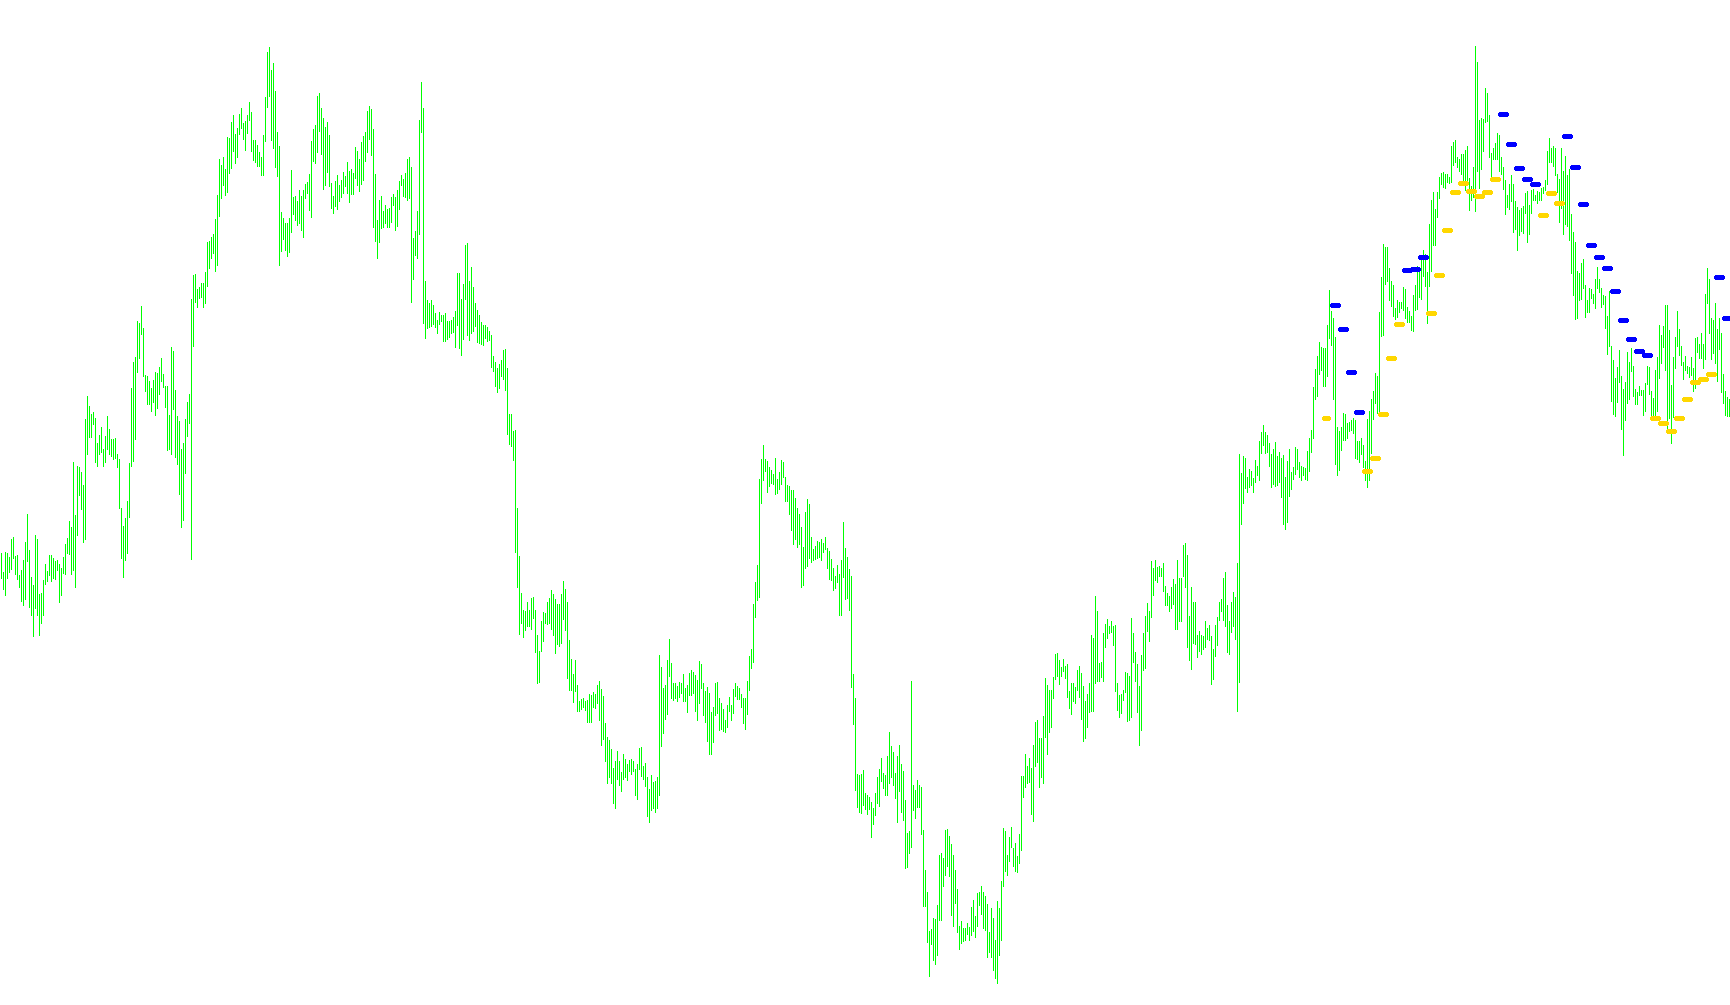
A momentum-based oscillator that utilizes typical price action and recursive smoothing to quantify trend velocity and relative strength.

Turbo_JRSX_wAppliedPrice
Indicator

Turbo_JRSX_wAppliedPrice

This indicator calculates a multi-stage smoothed momentum value based on customizable price types to identify overbought and oversold conditions.

Turbo_JVEL
Indicator

Turbo_JVEL

This indicator calculates the instantaneous rate of change in a Jurik Moving Average based on typical price to identify directional momentum shifts.

Turbo_JVEL1
Indicator

Turbo_JVEL1

This indicator calculates the instantaneous rate of change of a Jurik Moving Average based on Typical Price to visualize momentum trends as directional histograms.

Indicator

Turbo_PT_Scalper

iMA
Turtle Channel Method
Indicator

Turtle Channel Method

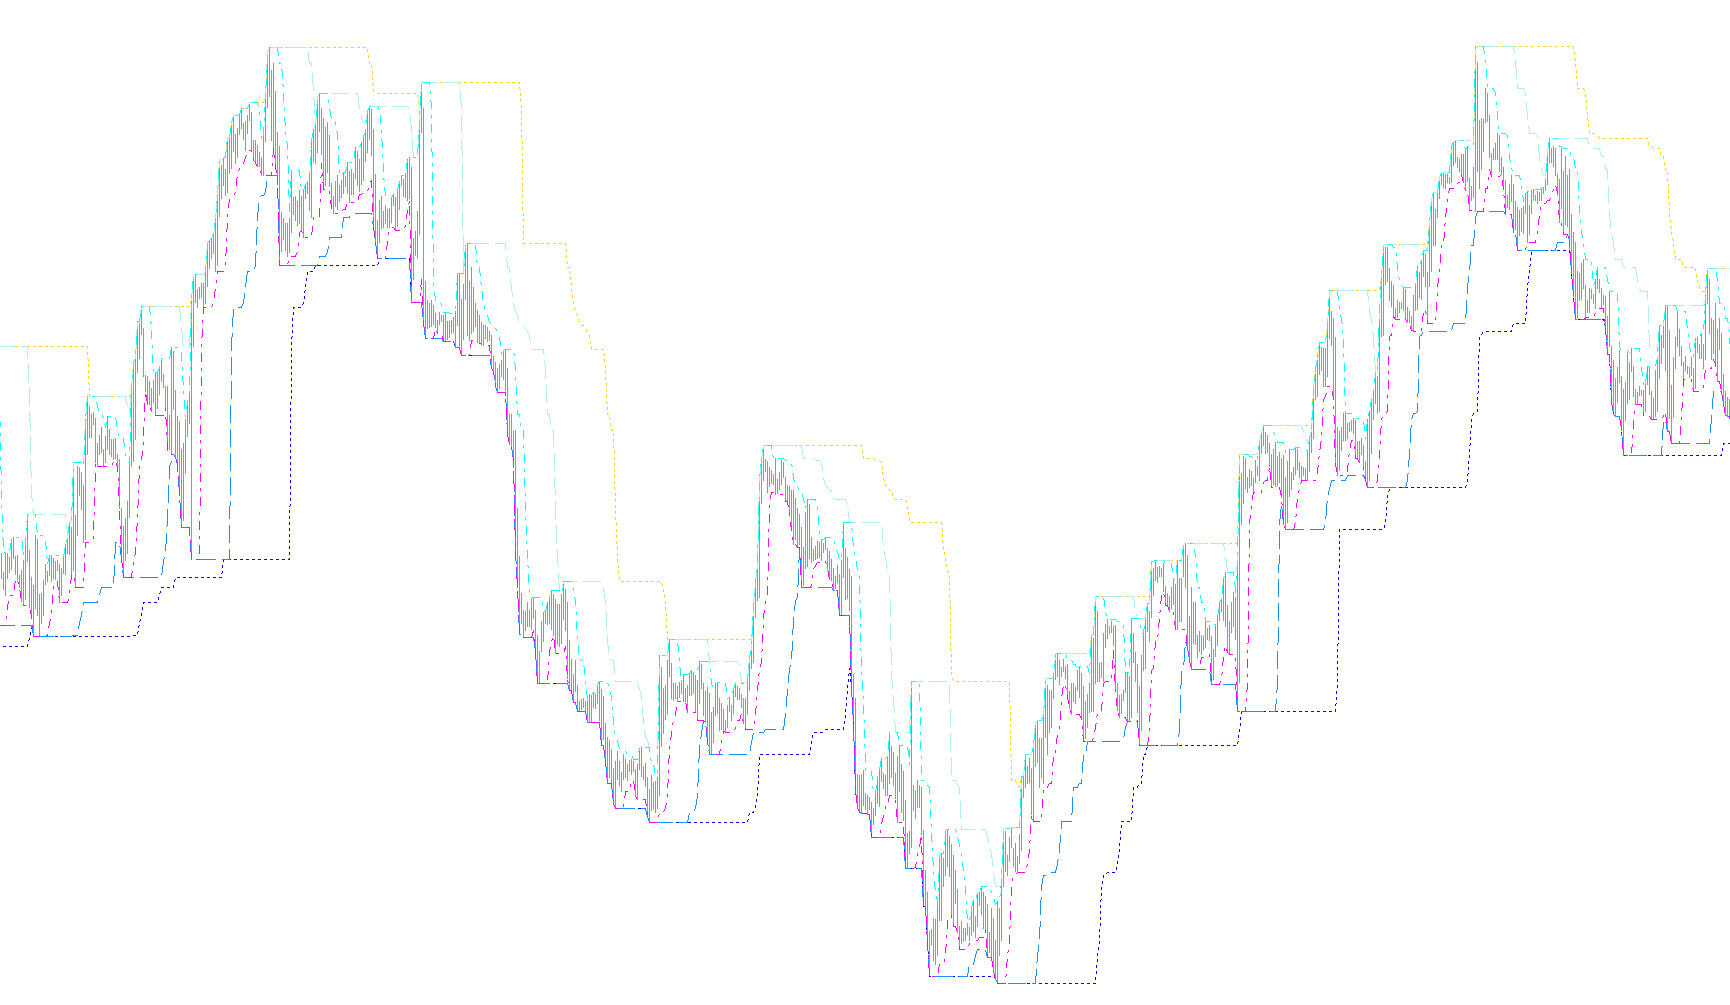
This indicator plots three distinct sets of price boundaries across long, medium, and short timeframes to identify breakout points and structural volatility extremes.

turtlechanneli
Indicator

turtlechanneli

This indicator plots three concurrent sets of Donchian Channels across long, medium, and short timeframes to identify volatility boundaries and price breakout points.

Twenty four
Indicator

Twenty four

This indicator identifies daily structural shifts by plotting a trendline based on the average of open and close prices at each day's transition point.

two lines
Indicator

two lines

This indicator dynamically plots vertical visual anchors on the chart to demarcate specific hourly milestones based on user-defined time parameters.

two lines_v1
Indicator

two lines_v1

This indicator automatically plots vertical lines on the chart to demarcate specific hourly and minute-based temporal coordinates for session tracking.

TwoPoleSuperSmootherFilter
Indicator

TwoPoleSuperSmootherFilter

This indicator applies a second-order digital filter to the median price range to isolate underlying trend dynamics by suppressing high-frequency market noise.

Tz Pivot
Indicator

Tz Pivot

Calculates and projects time-zone specific pivot levels, Fibonacci retracements, and Camarilla boundaries by analyzing historical price action from distinct global sessions.

TZ Trend 30 min
Indicator

TZ Trend 30 min

iMA

This indicator identifies market momentum by analyzing the sequential stacking of three distinct Exponential Moving Averages to distinguish between bullish, bearish, and neutral price structures.

Indicator

TzPivotsD_v3.5 (Black)

t_ma
Indicator

t_ma

iMA

This indicator visualizes a primary Linear Weighted Moving Average alongside a secondary smoothed average derived from the mean of six consecutive LWMA nodes based on opening prices.

UberfractalV02
Indicator

UberfractalV02

Identifies local structural extremes by detecting high and low price pivots within a multi-bar neighborhood to pinpoint potential reversal zones.

Indicator

UltimateMACD

iMAOnArrayiMA
Ultimate_Oscillator
Indicator

Ultimate_Oscillator

iATRiMAOnArray

This indicator synthesizes multi-period price distance from the minimum low normalized by Average True Range to quantify momentum volatility.

Ultitimate Oscillator
Indicator

Ultitimate Oscillator

iMA

This indicator calculates the aggregate momentum of price action by summing three distinct Linear Weighted Moving Averages across 7, 14, and 28 period intervals.

Ultitimate Oscillator_v1
Indicator

Ultitimate Oscillator_v1

iMA

This indicator quantifies trend velocity by calculating the sum of three distinct Linear Weighted Moving Averages across short, medium, and long timeframes.

Ultitimate Oscillator_v2
Indicator

Ultitimate Oscillator_v2

iMA

This indicator calculates a composite momentum value by summing three distinct linear weighted moving averages to identify overarching trend cohesion.

Ultitimate_Oscillator
Indicator

Ultitimate_Oscillator

iMA

The indicator calculates a smoothed momentum value by averaging three distinct Linear Weighted Moving Averages over the 7, 14, and 28 periods.

ULTRA_TREND
Indicator

ULTRA_TREND

This indicator synthesizes high-frequency price action into a smoothed trend signal by applying dual-layered Jurik Moving Average (JMA) calculations to external ultra-trend momentum data.

ultra_trend_alarm
Indicator

ultra_trend_alarm

This script triggers an audible alert whenever the Ultra_Trend indicator value crosses above a predefined numerical threshold on either the current or previous candle.

Un Dn Bar
Indicator

Un Dn Bar

The algorithm identifies bullish or bearish reversals by detecting candles where the price action penetrates specific percentage-based bands relative to the recent ten-bar average range.

uni cross
Indicator

uni cross

This indicator identifies trend reversal points by detecting the precise intersection between a high-frequency Snake moving average and a long-term T3_clean smoothed trendline.

UOSA
Indicator

UOSA

iATRiMAOnArray

This indicator quantifies market momentum by aggregating weighted moving averages of price-to-low distances normalized against multi-period Average True Ranges.

UP&Down
Indicator

UP&Down

This indicator identifies structural support and resistance levels by calculating the moving average of historical highs and lows across specific timeframes like hourly, daily, and monthly transitions.

updatedata
Indicator

updatedata

This script executes a continuous loop that triggers a specific keystroke every second until the Escape key is detected.

Indicator

UploadExport_13

Up_Down
Indicator

Up_Down

This indicator identifies trend reversals by calculating the average of highest highs and lowest lows across specific chronological anchors like hourly, daily, or monthly transitions.

Up_Down1_Alert 1
Indicator

Up_Down1_Alert 1

This indicator identifies trend reversals by calculating and plotting period-specific high and low price boundaries across various timeframes, generating alerts when price breaches these dynamic extremes.

up_down_alert
Indicator

up_down_alert

This indicator identifies directional shift alerts by calculating localized high and low pivot averages across specific timeframes and triggering signals when price closes outside these calculated bounds.

Up_Down_v1
Indicator

Up_Down_v1

This indicator identifies structural pivot points by calculating the arithmetic mean of extreme price highs and lows across specific chronological sessions.

Up_Down_v3
Indicator

Up_Down_v3

This indicator identifies directional shifts by calculating the average high and low levels across specific chronological anchor points such as hourly, daily, and monthly boundaries.

urovni-dou
Indicator

urovni-dou

This indicator dynamically calculates and projects multiple support, resistance, and pivot levels based on the previous day's high, low, and closing price data.

Indicator

UROVNI-MT4

Indicator

UROVNI-MT4_v1

Indicator

UROVNI-MT4_v2

Urovny
Indicator

Urovny

iMA

This indicator plots a dynamic corridor by calculating Exponential Moving Averages on the high and low price points, adjusted by a user-defined volatility offset.
Indicator

USDCHF

Indicator

USDJPY

USDx
Indicator

USDx

iMAOnArray

This indicator calculates a weighted composite value of the US Dollar by applying specific power-law coefficients to multiple currency pairs and smoothing the resulting series with a Simple Moving Average.

Indicator

Utils1

UT_FAST
Indicator

UT_FAST

UT_FAST1
Indicator

UT_FAST1

This indicator utilizes a Jurik Moving Average (JMA) algorithm to execute multi-layered price smoothing and non-linear volatility filtering for noise reduction.

UT_FAST_002
Indicator

UT_FAST_002

The indicator utilizes a complex multi-stage smoothing algorithm incorporating power functions and logarithmic scaling to calculate an adaptive momentum trend from price action.