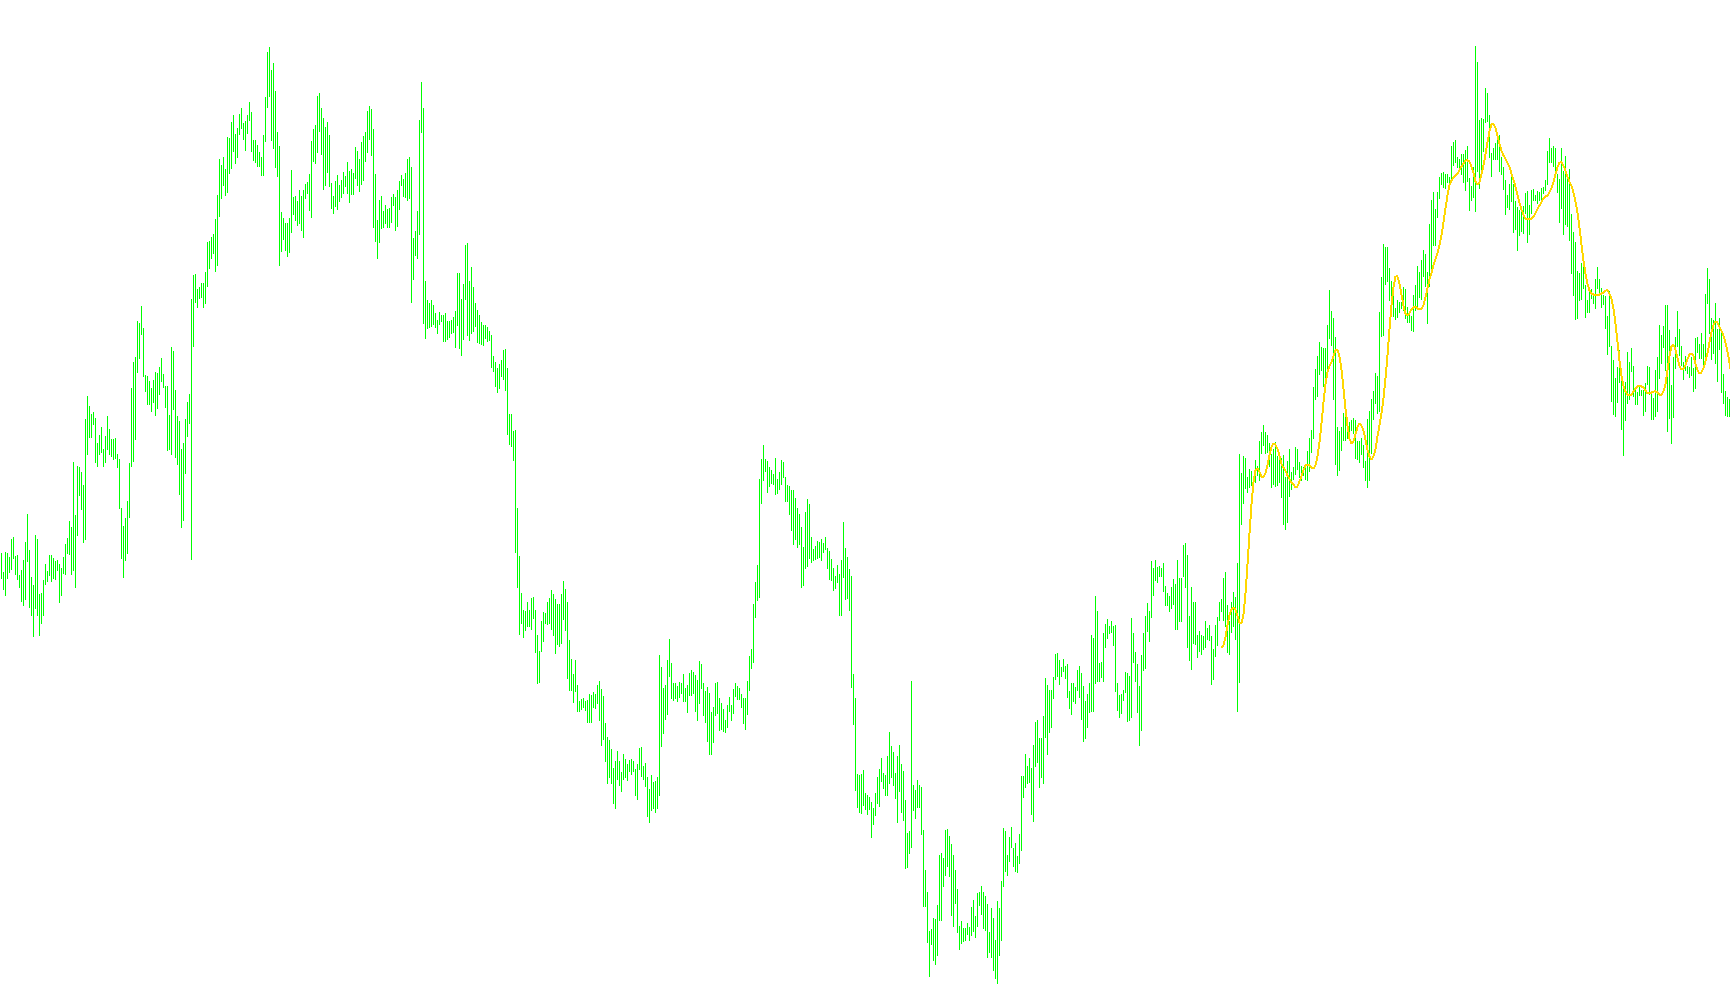
Trendlines_v1
Indicator

Trendlines_v1

This indicator dynamically identifies and plots structural pivot points to project geometric trendlines across nested higher timeframes.

Trendlines_v2
Indicator

Trendlines_v2

Dynamically plots structural trendlines by identifying recursive higher highs and lower lows across nested temporalities.

Trendline_Fast
Indicator

Trendline_Fast

This indicator calculates a smoothed representation of price movement by applying a specific set of weights to past closing prices, effectively creating a derivative of a moving average.

Trendline_Slow
Indicator

Trendline_Slow

This indicator utilizes a fixed-coefficient polynomial regression to calculate price momentum by applying weighted sum values across a 99-period lookback window.

trendline_v1
Indicator

trendline_v1

This indicator calculates a weighted moving average and its smoothed momentum to identify bullish trend shifts through visual signal coloring.

TrendManager Candle x 2
Indicator

TrendManager Candle x 2

The logic calculates a central price equilibrium based on extreme high and low boundaries over a rolling period to visualize trend direction through dual histogram offsets.

TrendManager
Indicator

TrendManager

This indicator visualizes price momentum by calculating the midpoint of high and low ranges over a dynamic lookback window compared against its shifted historical average.

TrendManager2
Indicator

TrendManager2

This indicator identifies trend alignment by comparing the sign parity of two distinct price-action momentum shifts to determine directional synchronization.

TrendManagerNT
Indicator

TrendManagerNT

iADX

This indicator identifies trend reversals by monitoring price extremes and momentum shifts, utilizing a dual-span calculation validated by ADX strength and custom trend divergence thresholds.

TrendManagerNT1
Indicator

TrendManagerNT1

iADX

This indicator identifies high-probability trend reversals by correlating dual-span price pivots with ADX momentum strength and proprietary NewTrend divergence filters.

TrendManagerOpen2 seperate window
Indicator

TrendManagerOpen2 seperate window

This indicator identifies structural trend shifts by calculating the divergence or convergence between short and long-term median price levels derived from high-low extremes.

TrendManagerOpen2 seperate window1
Indicator

TrendManagerOpen2 seperate window1

The indicator identifies trend strength by calculating the divergence between mid-price shifts across two distinct temporal periods, filtering out signals where short-term and long-term movements exhibit opposing polarities.

TrendManagerOpen2 seperate window1_v1
Indicator

TrendManagerOpen2 seperate window1_v1

This indicator identifies trend alignment by comparing the directional velocity of two distinct price-range midpoints to filter out conflicting market signals.

TrendManagerOpen2 seperate window2
Indicator

TrendManagerOpen2 seperate window2

The indicator identifies directional bias by calculating the mid-price variance of two distinct timeframes and plotting bullish or bearish histogram values only when both periods align in polarity.

TrendManagerOpen2 seperate window2_v1
Indicator

TrendManagerOpen2 seperate window2_v1

This indicator calculates the arithmetic midpoint of price extremes over two distinct timeframes to identify bullish or bearish momentum only when both short and long-term shifts align.

TrendManagerOpen2 seperate window_v1
Indicator

TrendManagerOpen2 seperate window_v1

This indicator identifies trend alignment by comparing the average of dual-period price extremes to detect shifts in momentum polarity.

TrendManagerOpen2 seperate window_v2
Indicator

TrendManagerOpen2 seperate window_v2

This indicator evaluates the synchronization of price velocity across two distinct timeframe horizons to identify directional confluence or divergence.

TrendManagerOpen2
Indicator

TrendManagerOpen2

The logic calculates the midpoint of high and low price extremes across two distinct timeframes to identify trend alignment or divergence through relative movement analysis.

TrendManagerOpen2_v1
Indicator

TrendManagerOpen2_v1

The indicator calculates the average midpoint of two distinct price ranges and renders a dual-histogram that visualizes trend convergence or divergence based on the relative direction of short and long-term momentum.

TrendManager_001
Indicator

TrendManager_001

The algorithm calculates a rolling mid-point of price extremes over a specific lookback period to visualize momentum shifts through dual histogram offset comparison.

TrendManager_recentweight
Indicator

TrendManager_recentweight

The algorithm calculates a modified pivot point by averaging the extreme high and low prices with a localized midpoint sum weighted over a specific lookback range.

TrendManager_v1
Indicator

TrendManager_v1

This indicator calculates and visualizes the mid-point of high-low ranges over a specific lookback period, comparing current volatility centers against a lagged offset to identify structural shifts.

Indicator

TrendPower

iATRiMA
Indicator

TrendPower_v1

iATRiMA
Indicator

TrendPower_v2

iATRiMA
TrendRSI_v1
Indicator

TrendRSI_v1

iMAOnArrayiRSI

This indicator identifies trend dynamics by applying dual Simple and Exponential Moving Averages directly onto the Relative Strength Index data stream.

TrendRSI_v1_v1
Indicator

TrendRSI_v1_v1

iMAOnArrayiRSI

This indicator overlays a standard Relative Strength Index with two distinct moving averages to visualize momentum trends and identify potential structural shifts in price velocity.

TrendRSI_v3
Indicator

TrendRSI_v3

iMA

This indicator identifies directional momentum by filtering Relative Strength Index fluctuations through an EMA smoothing process and executing dynamic breakout signals based on ATR-derived volatility bands.

TrendScalpIndc_PP
Indicator

TrendScalpIndc_PP

This indicator quantifies market sentiment by calculating the relative ratio between recent price extremes and historical volatility, with an optional T3 smoothing filter to isolate underlying structural trends.

TrendScalpIndc_PP_v1
Indicator

TrendScalpIndc_PP_v1

This indicator quantifies market sentiment by calculating the relative disparity between recent high-low price ranges against historical extremes, optionally applying a triple-weighted smoothing algorithm.

TrendscalpIndic
Indicator

TrendscalpIndic

This indicator calculates trend strength by measuring the relative difference between recent high-low price ranges and older historical extremes to identify dominant market momentum.

TrendscalpIndic_v1
Indicator

TrendscalpIndic_v1

This indicator quantifies market bias by calculating the ratio between recent price expansion and historical volatility range to determine directional momentum.

Trendsignal
Indicator

Trendsignal

iWPR

This indicator identifies trend reversal points by detecting significant price gaps and velocity shifts relative to rolling average ranges using a weighted percentage oscillator.

Trendsignal_001
Indicator

Trendsignal_001

iWPR

This indicator identifies trend exhaustion by detecting significant price gaps relative to average volatility and filtering for momentum shifts using a modified Williams Percent Range.

Trendsignal_v1
Indicator

Trendsignal_v1

iWPR

This indicator identifies potential trend exhaustion and reversal points by monitoring high-magnitude price fluctuations against a modified Williams Percent Range (WPR) oscillator with dynamic threshold filtering.

TrendstrenghtEMA
Indicator

TrendstrenghtEMA

iMA

This indicator quantifies market momentum by calculating the arithmetic mean of the price discrepancies between a primary 11-period EMA and a multi-layered series of expanding exponential moving averages.

TrendstrenghtEMA_v1
Indicator

TrendstrenghtEMA_v1

iMA

This indicator quantifies directional momentum by calculating the arithmetic mean of the price deviations between a primary 11-period EMA and a series of seven shorter-term EMAs.

TrendStrength RMD
Indicator

TrendStrength RMD

iMA

The algorithm calculates the mean variance between a short-term exponential moving average and a spectrum of smoothed moving averages to quantify current trend velocity.

Trendstrength
Indicator

Trendstrength

This indicator identifies bullish and bearish momentum by comparing current price action against a calculated high-low range threshold over a fixed historical window.

TrendStrengthOpen
Indicator

TrendStrengthOpen

iMA

This indicator quantifies directional momentum by calculating the average differential between a short-term moving average and a spectrum of increasing long-term windows.

TrendStrengthTrio
Indicator

TrendStrengthTrio

iMA

This indicator quantifies directional velocity by aggregating the differential variance between a primary weighted EMA and a multi-tiered progression of expanding temporal offsets.

TrendStrengthTrio_v1
Indicator

TrendStrengthTrio_v1

iMA

This indicator quantifies market velocity by aggregating the cumulative differential between a primary weighted moving average and a series of expanding temporal offsets.

TrendStrength_v1
Indicator

TrendStrength_v1

iMA

This indicator calculates the cumulative divergence between a primary short-term weighted exponential average and a series of progressively longer moving averages to quantify trend velocity.

TrendStrength_v2
Indicator

TrendStrength_v2

iMA

Calculates the average differential between a short-term moving average and a spectrum of longer-term simple moving averages to quantify momentum velocity.

Trends_v1
Indicator

Trends_v1

iForceiADXiRSI
trendtest_OHLC
Indicator

trendtest_OHLC

iMA

This indicator identifies precise momentum shifts by detecting the intersection of two distinct moving averages and visually marking trend reversals in a separate sub-window.

TrendTriggerMod
Indicator

TrendTriggerMod

This indicator calculates the relative strength of buying and selling power by comparing recent price extremes against historical high-low ranges, then applies a triple exponential smoothing filter to identify directional momentum shifts.

TrendTriggerMod_v1
Indicator

TrendTriggerMod_v1

The indicator quantifies momentum by calculating the relative difference between recent and historical high-low ranges, smoothed through a multi-stage weighted regression filter.

Trendy Alert
Indicator

Trendy Alert

iBandsiCCIiADXiMA
Trendy
Indicator

Trendy

iBandsiCCIiADXiMA