TTF - trigger factor
Download script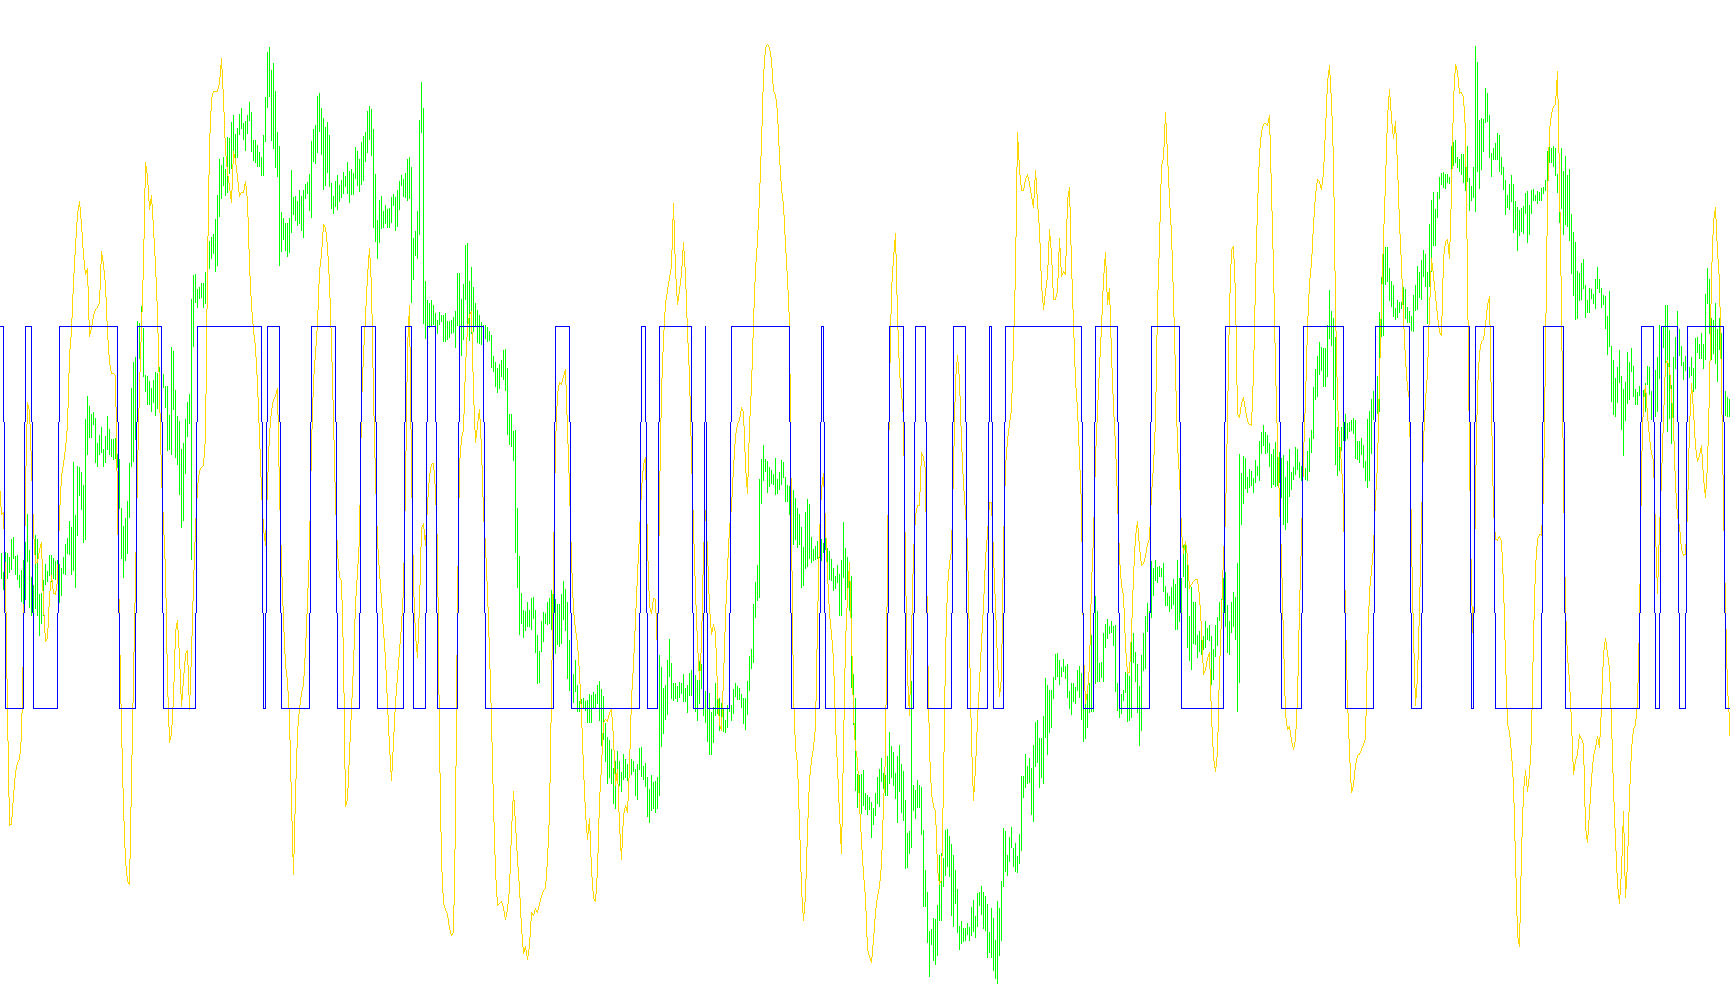
This script is designed as a visual momentum indicator for trading platforms. It functions by analyzing price fluctuations to determine the relative strength of "buying" pressure versus "selling" pressure, presenting this data in a separate window below the main price chart.
How it Works
The logic operates through three primary stages:
1. Price Comparison
The tool looks at specific windows of recent market history (determined by the TTFbars setting). It identifies two key pieces of information for both the current timeframe and a slightly older timeframe:
- The highest price reached.
- The lowest price reached.
By comparing these points, the script calculates two distinct "Power" metrics:
- Buy Power: Measures the difference between recent high prices and older low prices.
- Sell Power: Measures the difference between older high prices and recent low prices.
2. Strength Calculation Once it has these two power figures, the script creates a percentage-based value (TTF). This represents which side of the market—the buyers or the sellers—currently holds the upper hand. If the buying power is significantly stronger than the selling power, the value increases; if the selling pressure is dominant, the value drops.
3. Smoothing and Visualization To prevent the data from looking jagged or erratic, the script applies a multi-layered smoothing process (similar to an exponential moving average). This filters out "market noise" so that users can see clear trends rather than tiny, insignificant price flickers.
The final output is displayed as two distinct lines:
- Main Line: The smoothed momentum value calculated from the price action.
- Signal Line: A binary indicator that shifts between a fixed top and bottom boundary (defined by
TopLineandBottomLine) based on whether the main momentum value is positive or negative.
Summary for the User
In simple terms, this tool helps you visualize who is "winning" the tug-of-war between buyers and sellers. When the main line moves upward and the signal switches to its upper boundary, it suggests bullish momentum; when it moves downward toward the lower boundary, it suggests bearish momentum.
//+------------------------------------------------------------------+
//|                                                   ttf.mq4        |
//|                      Copyright © 2005, Nick Bilak                |
//|                                                                  |
//+------------------------------------------------------------------+
#property copyright "Copyright © 2005, Nick Bilak"
#property link      "beluck[at]gmail.com"

#property indicator_separate_window
#property indicator_buffers 2
#property indicator_color1 LightSeaGreen
#property indicator_color2 Red
//---- input parameters
extern int TTFbars=8;
//15=default number of bars for computation
extern int TopLine=75;
extern int BottomLine=-75;
extern int t3_period=3;
extern double b=0.7;
//---- buffers
double MainBuffer[];
double SignalBuffer[];
//----
int draw_begin1=0;
int draw_begin2=0;
double b2=0;
double b3=0;
double c1=0;
double c2=0;
double c3=0;
double c4=0;
double r=0;
double w1=0;
double w2=0;
double e1 = 0;
double e2 = 0;
double e3 = 0;
double e4 = 0;
double e5 = 0;
double e6 = 0;
double  HighestHighRecent=0;
double  HighestHighOlder =0;
double  LowestLowRecent =0;
double  LowestLowOlder =0;
double  BuyPower =0;
double  SellPower=0;
double  TTF=0;

//+------------------------------------------------------------------+
//| Custom indicator initialization function                         |
//+------------------------------------------------------------------+
int init()
  {
   string short_name;
//---- 2 additional buffers are used for counting.
   IndicatorBuffers(2);
//---- indicator lines
   SetIndexStyle(0,DRAW_LINE);
   SetIndexBuffer(0, MainBuffer);
   SetIndexStyle(1,DRAW_LINE);
   SetIndexBuffer(1, SignalBuffer);
//---- name for DataWindow and indicator subwindow label
   short_name="TTF("+TTFbars;
   IndicatorShortName(short_name);
   SetIndexLabel(0,short_name);
   SetIndexLabel(1,"Signal");
//----
   draw_begin1=TTFbars*2+1;
   draw_begin2=draw_begin1;
   SetIndexDrawBegin(0,draw_begin1);
   SetIndexDrawBegin(1,draw_begin2);

   b2=b*b;
   b3=b2*b;
   c1=-b3;
   c2=(3*(b2+b3));
   c3=-3*(2*b2+b+b3);
   c4=(1+3*b+b3+3*b2);

   r=t3_period;

   if (r<1) r=1;
   r = 1 + 0.5*(r-1);
   w1 = 2 / (r + 1);
   w2 = 1 - w1;

//----
   return(0);
  }
//+------------------------------------------------------------------+
//| ttf                                            |
//+------------------------------------------------------------------+
int start()
  {
   int    i,k;
   int    counted_bars=IndicatorCounted();
   double price;
//----
   if(Bars<=draw_begin2) return(0);
//---- initial zero
   if(counted_bars<1)
     {
      for(i=1;i<=draw_begin1;i++) MainBuffer[Bars-i]=0;
      for(i=1;i<=draw_begin2;i++) SignalBuffer[Bars-i]=0;
     }
//---- %K line
   i=Bars-draw_begin1;
   if(counted_bars>draw_begin1) i=Bars-counted_bars-1;
   while(i>=0)
     {
  HighestHighRecent=High[Highest(NULL,0,MODE_HIGH,TTFbars,i)];//High[Highest(MODE_HIGH,shift+TTFbars-1,TTFbars)];
  HighestHighOlder =High[Highest(NULL,0,MODE_HIGH,TTFbars,i+TTFbars)];//High[Highest(MODE_HIGH,shift+TTFbars*2-1,TTFbars)];
  LowestLowRecent =Low[Lowest(NULL,0,MODE_LOW,TTFbars,i)];//Low [Lowest (MODE_LOW ,shift+TTFbars-1,TTFbars)];
  LowestLowOlder =Low[Lowest(NULL,0,MODE_LOW,TTFbars,i+TTFbars)];//Low [Lowest (MODE_LOW ,shift+TTFbars*2-1,TTFbars)];
  BuyPower =HighestHighRecent-LowestLowOlder;
  SellPower=HighestHighOlder -LowestLowRecent;
  TTF=(BuyPower-SellPower)/(0.5*(BuyPower+SellPower))*100;

  e1 = w1*TTF + w2*e1;
  e2 = w1*e1 + w2*e2;
  e3 = w1*e2 + w2*e3;
  e4 = w1*e3 + w2*e4;
  e5 = w1*e4 + w2*e5;
  e6 = w1*e5 + w2*e6;

  TTF = c1*e6 + c2*e5 + c3*e4 + c4*e3;

  MainBuffer[i]=TTF;
  i--;
 }
//---- last counted bar will be recounted
   if(counted_bars>0) counted_bars--;
   int limit=Bars-counted_bars;
//---- signal line is simple movimg average
   for(i=0; i<limit; i++) {
      if (MainBuffer[i]>=0)
         SignalBuffer[i]=TopLine;
      else
         SignalBuffer[i]=BottomLine;
   }
//----
   return(0);
  }
//+------------------------------------------------------------------+
Comments