VininI ConstTickPrice
Indicator

VininI ConstTickPrice

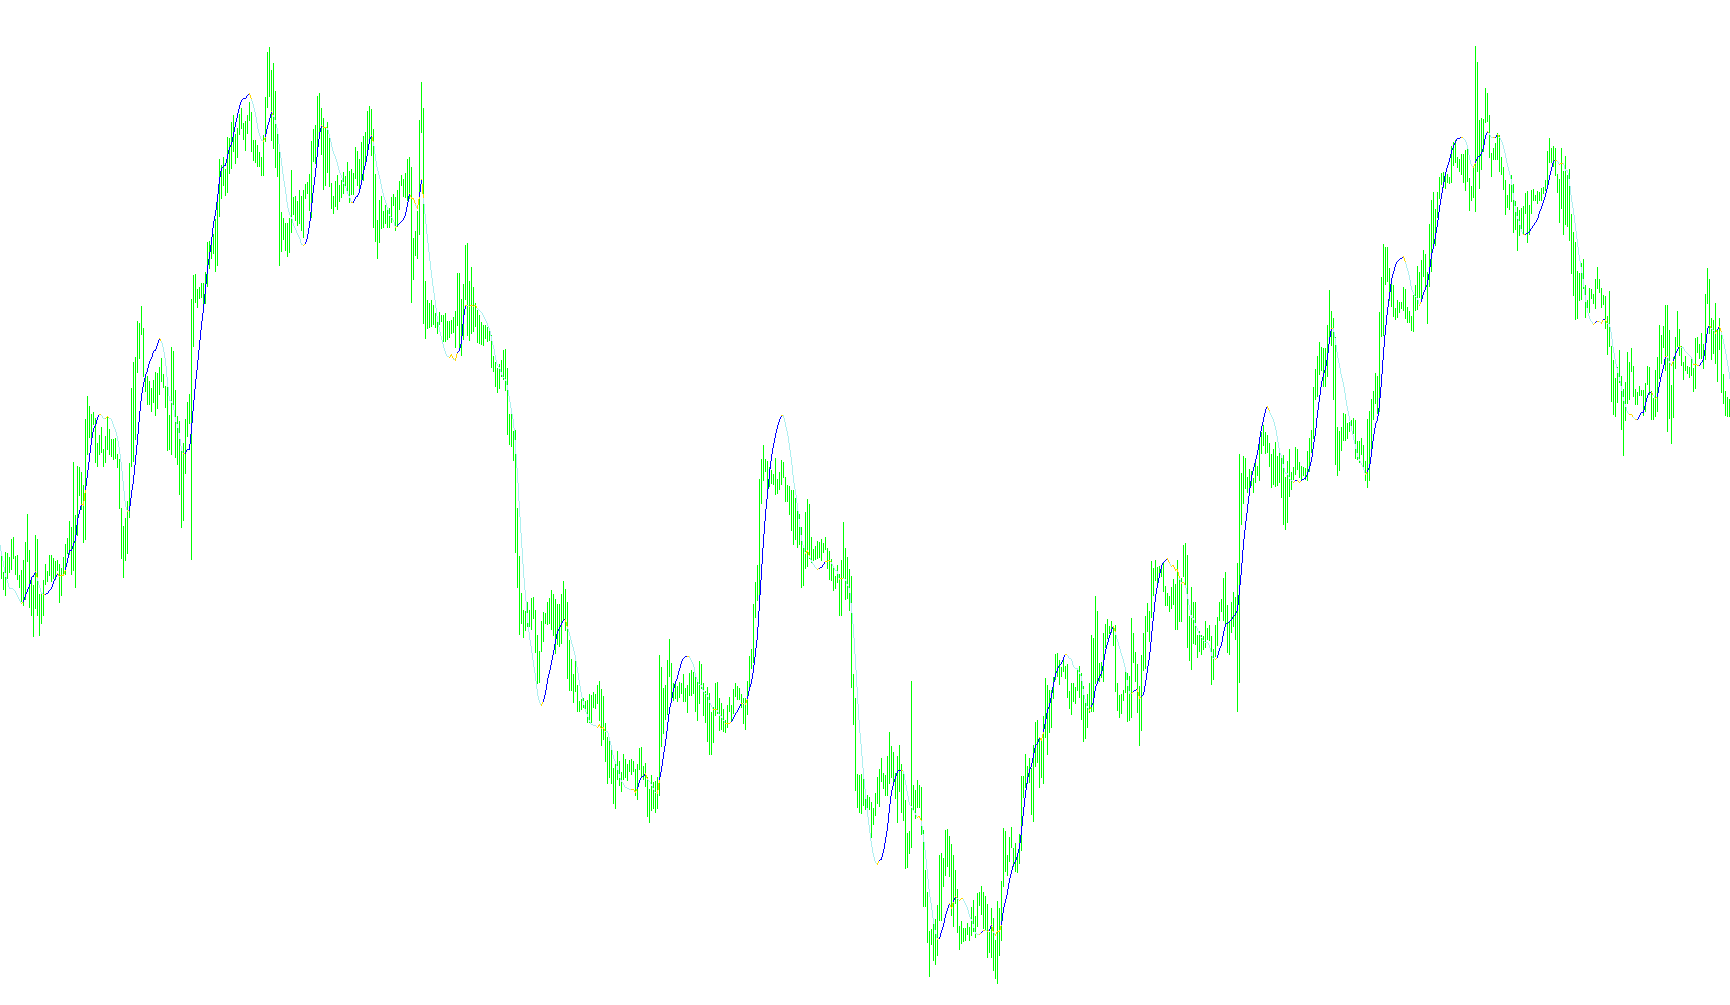
This indicator dynamically recomputes historical price points by calculating cumulative tick volumes and resetting benchmarks based on weekly boundaries and specific tick density thresholds.

VininI ConstTickPriceM
Indicator

VininI ConstTickPriceM

This indicator aggregates price action and volume data by resetting candle parameters once a specific threshold of tick activity is reached.

VininI ConstTicksSMA
Indicator

VininI ConstTicksSMA

Calculates a Simple Moving Average based on price data retrieved from a dynamic external custom indicator with variable offset logic.

VininI LRMA color
Indicator

VininI LRMA color

iMA

This indicator calculates a weighted fusion of Simple and Linear Weighted Moving Averages to generate directional momentum signals based on slope fluctuations.

VininI_BB_MA_WPR(v1)
Indicator

VininI_BB_MA_WPR(v1)

iWPRiMAOnArray

This indicator transforms the Williams Percent Range into a normalized scale and overlays Bollinger Bands with a Moving Average to identify volatility extremes and trend shifts in momentum.

VininI_CMA
Indicator

VininI_CMA

iMAiStdDev

The algorithm dynamically adjusts price smoothing by weighting the distance between a moving average and historical volatility using a coefficient-based standard deviation filter.

VininI_Cyber Cycle(V2)
Indicator

VininI_Cyber Cycle(V2)

This indicator utilizes a weighted multi-period price average coupled with a recursive exponential smoothing algorithm to identify extreme momentum reversals through hyperbolic tangent transformations.

VininI_Cyber Cycle(V2)m
Indicator

VininI_Cyber Cycle(V2)m

This indicator utilizes a weighted moving average and a recursive second-order difference algorithm to generate a hyperbolic tangent-based cycle oscillator for identifying momentum extremes.

VininI_Cyber_Cycle
Indicator

VininI_Cyber_Cycle

This indicator calculates a smoothed price cycle using a recursive mathematical formula to derive exponential momentum values that identify overbought and oversold zones.

VininI_Cyber_Cycle_V2_My3[1]
Indicator

VininI_Cyber_Cycle_V2_My3[1]

This indicator calculates a normalized price cycle using a weighted moving average and an exponential smoothing recursive formula to identify momentum shifts and potential reversal zones.

VininI_Cyber_Cycle_V2_My4[1]
Indicator

VininI_Cyber_Cycle_V2_My4[1]

This indicator utilizes a weighted price smoothing algorithm combined with recursive cycle decomposition and hyperbolic tangent normalization to generate directional momentum signals.

VininI_Cyber_Cycle_V2_My5[1]
Indicator

VininI_Cyber_Cycle_V2_My5[1]

The algorithm processes a weighted price average through a recursive cycle calculation, normalizing the output via dynamic range detection and mapping it onto a hyperbolic tangent function to generate oscillation signals.

VininI_HMA_sound&Alert
Indicator

VininI_HMA_sound&Alert

iMAiMAOnArray

This indicator calculates the dynamic volatility of a Hull Moving Average by identifying its rate of change to detect momentum shifts and trend reversals.

VininI_HMA_Sound&Alert_en
Indicator

VininI_HMA_Sound&Alert_en

iMAiMAOnArray

This indicator identifies momentum shifts by calculating the directional velocity of a Hull Moving Average to highlight trend reversals via price slope transitions.

VininI_MA_WPR(v1)
Indicator

VininI_MA_WPR(v1)

iWPRiMAOnArray

This indicator transforms the Williams Percent Range into a centered scale and applies a moving average to filter out noise for smoother momentum tracking.

VininI_MV_MA_WPR(v1)
Indicator

VininI_MV_MA_WPR(v1)

iWPRiMAOnArray

This indicator normalizes the Williams %R oscillator to a 0-100 scale and applies a moving average filter to identify smoothed momentum trends across disparate currency pairs.

VininI_MV_WPR(v1)
Indicator

VininI_MV_WPR(v1)

iWPR

This indicator synchronizes and normalizes the Williams Percent Range of a secondary currency pair to detect overbought and oversold extremes relative to the primary chart.

VininI_RSI_FO
Indicator

VininI_RSI_FO

iMAOnArrayiRSI

This indicator transforms normalized Relative Strength Index values into a hyperbolic tangent momentum signal to identify overextended trend reversals.
VininI_RSI_FO_2m
Indicator

VininI_RSI_FO_2m

iMAOnArrayiRSI

This indicator synthesizes the relative strength of two distinct currency pairs by applying moving average smoothing and a hyperbolic tangent transformation to normalized RSI values.

VininI_RVI_FOm
Indicator

VininI_RVI_FOm

iMAOnArrayiRVI

This indicator synthesizes RVI data from two distinct currency pairs into normalized hyperbolic tangent signals to visualize relative momentum divergence.

VininI_STO_FO
Indicator

VininI_STO_FO

iMAOnArrayiStochastic

This indicator applies a sigmoid activation function to a smoothed stochastic oscillator to normalize momentum into distinct bullish and bearish zones.

VininI_Trend
Indicator

VininI_Trend

iMA

Calculates a relative sentiment score by quantifying the frequency of price closes relative to a series of multiple moving averages.

VininI_Trend_LRMA
Indicator

VininI_Trend_LRMA

iMAiMAOnArray

This indicator calculates a weighted momentum score by comparing a primary Linear Regression Moving Average against a multi-step array of MA periods to determine trend dominance.

VininI_Trend_MA_WPR
Indicator

VininI_Trend_MA_WPR

iWPRiMAOnArray

The logic evaluates the relative frequency of Williams %R values exceeding a multi-step moving average to quantify momentum distribution strength.

VininI_Trend_V7
Indicator

VininI_Trend_V7

iMAOnArray

The algorithm calculates a weighted price distance gradient and applies a secondary moving average to detect directional shifts in trend velocity.

VininI_Trend_WPR
Indicator

VininI_Trend_WPR

iWPRiMAOnArray

This indicator calculates the Root Mean Square Deviation of normalized Williams Percent Range values to quantify volatility and trend stability.

VininI_Trend_WPR_MA
Indicator

VininI_Trend_WPR_MA

iWPRiMAOnArray

This indicator quantifies the prevalence of WillRogers Price Range values relative to a multi-point moving average array to identify momentum distribution trends.

VininI_WPR_FO
Indicator

VininI_WPR_FO

iWPRiMAOnArray

The logic transforms Williams Percent Range data into a smoothed hyperbolic tangent oscillation to identify extreme bullish and bearish momentum thresholds.

VininI_WPR_FOhisto
Indicator

VininI_WPR_FOhisto

iWPRiMAOnArray

This indicator transforms Williams Percent Range data into a smoothed hyperbolic tangent oscillator to identify overextended momentum extremes and directional shifts.

Vinin_LRMA_Color_Sound
Indicator

Vinin_LRMA_Color_Sound

iMA

The indicator calculates a weighted difference between Simple Moving Averages and Linear Weighted Moving Averages to visualize directional trend shifts via dynamic color transitions.

Virus Indicator
Indicator

Virus Indicator

This indicator calculates the price spread between the highest high and lowest low over a specified rolling window to quantify historical volatility.

Visible_Pos
Indicator

Visible_Pos

This script parses active and historical trade data to render visual entry and exit markers on the chart based on order types and timestamps.

Visual Orders
Indicator

Visual Orders

This indicator maps active and historical trade executions onto the chart using trend lines and arrows while simultaneously displaying real-time account equity and floating profit/loss statistics.

VisualOrders
Indicator

VisualOrders

An interactive overlay tool that dynamically maps active and historical trades onto the chart while calculating real-time profit margins and distance to take-profit targets.

Indicator

VisualTestingTools

VisualTrading
Indicator

VisualTrading

This tool provides real-time graphical tracking of active positions by projecting horizontal price levels for entry, stop-loss, and take-profit targets directly onto the chart with live profit calculations.

Visual_Start_All
Indicator

Visual_Start_All

A foundational multi-buffer histogram structure designed to visualize two distinct data streams simultaneously within a separate sub-window.

Vitesse
Indicator

Vitesse

iMAiMAOnArray

This indicator quantifies market momentum by calculating the smoothed percentage rate of change between consecutive simple moving averages.

VKW Bands V2
Indicator

VKW Bands V2

iFractalsiMAOnArray

This indicator identifies trend exhaustion by calculating smoothed dynamic envelopes from METRO data and generating visual signals when price breaches these boundaries in coordination with fractal structures.

VKW Bands
Indicator

VKW Bands

iMAOnArray

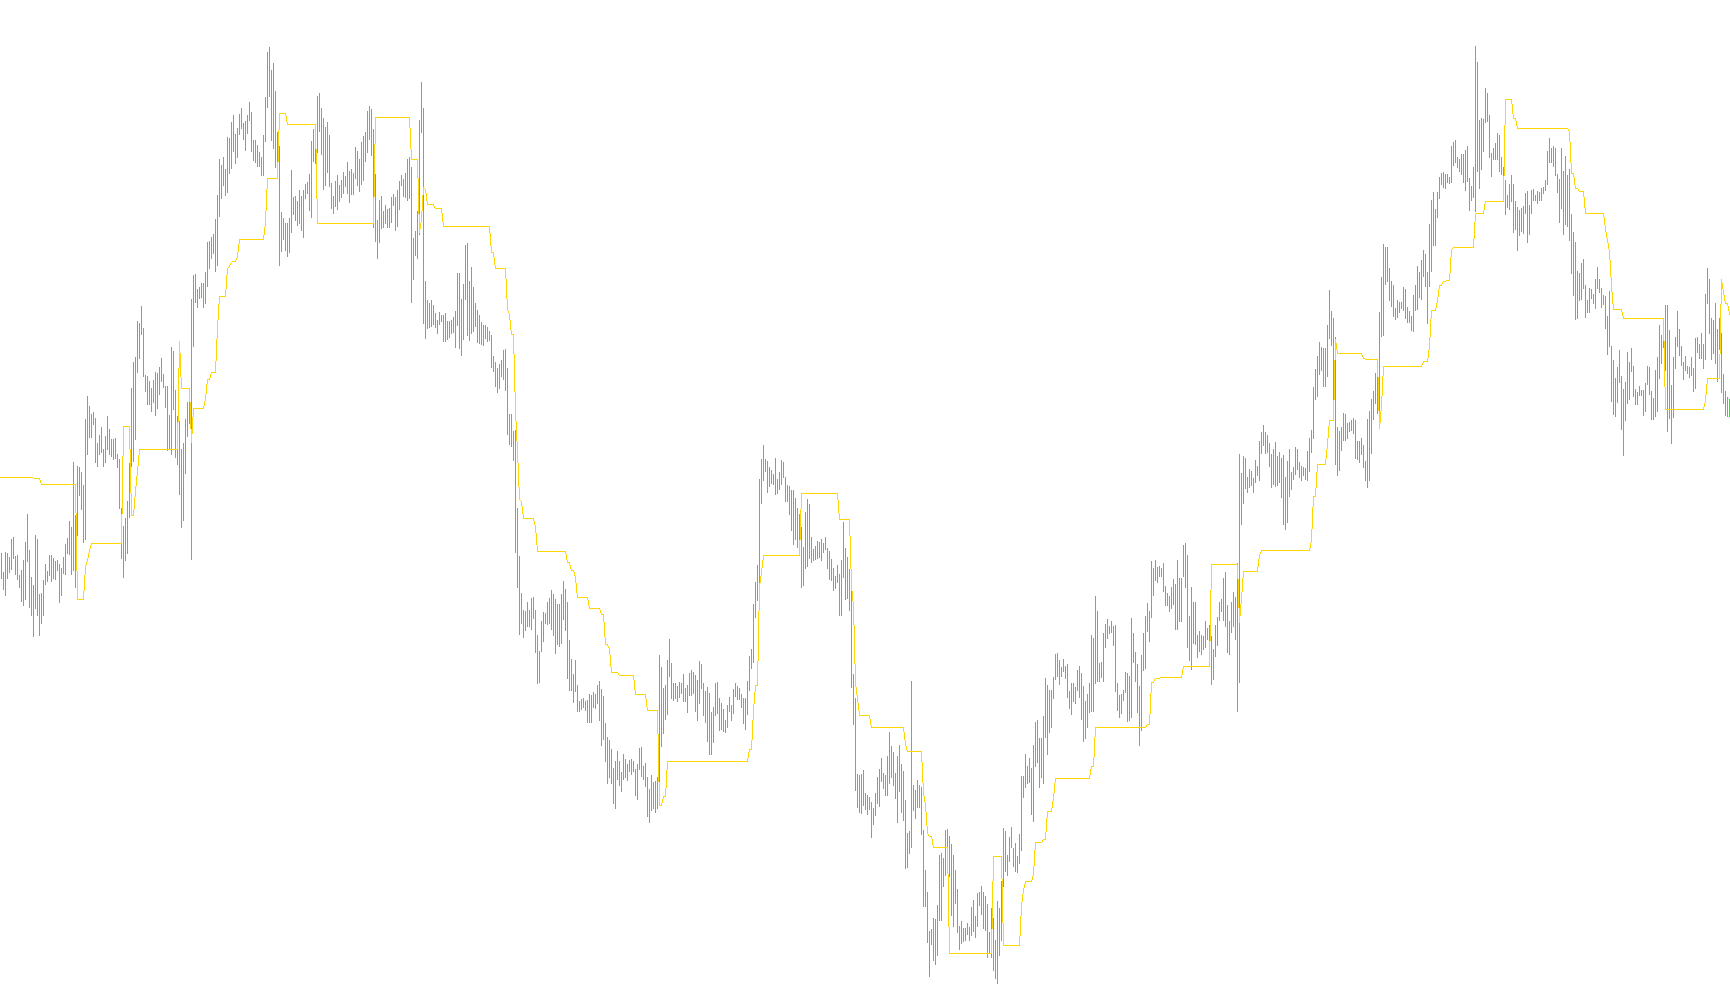
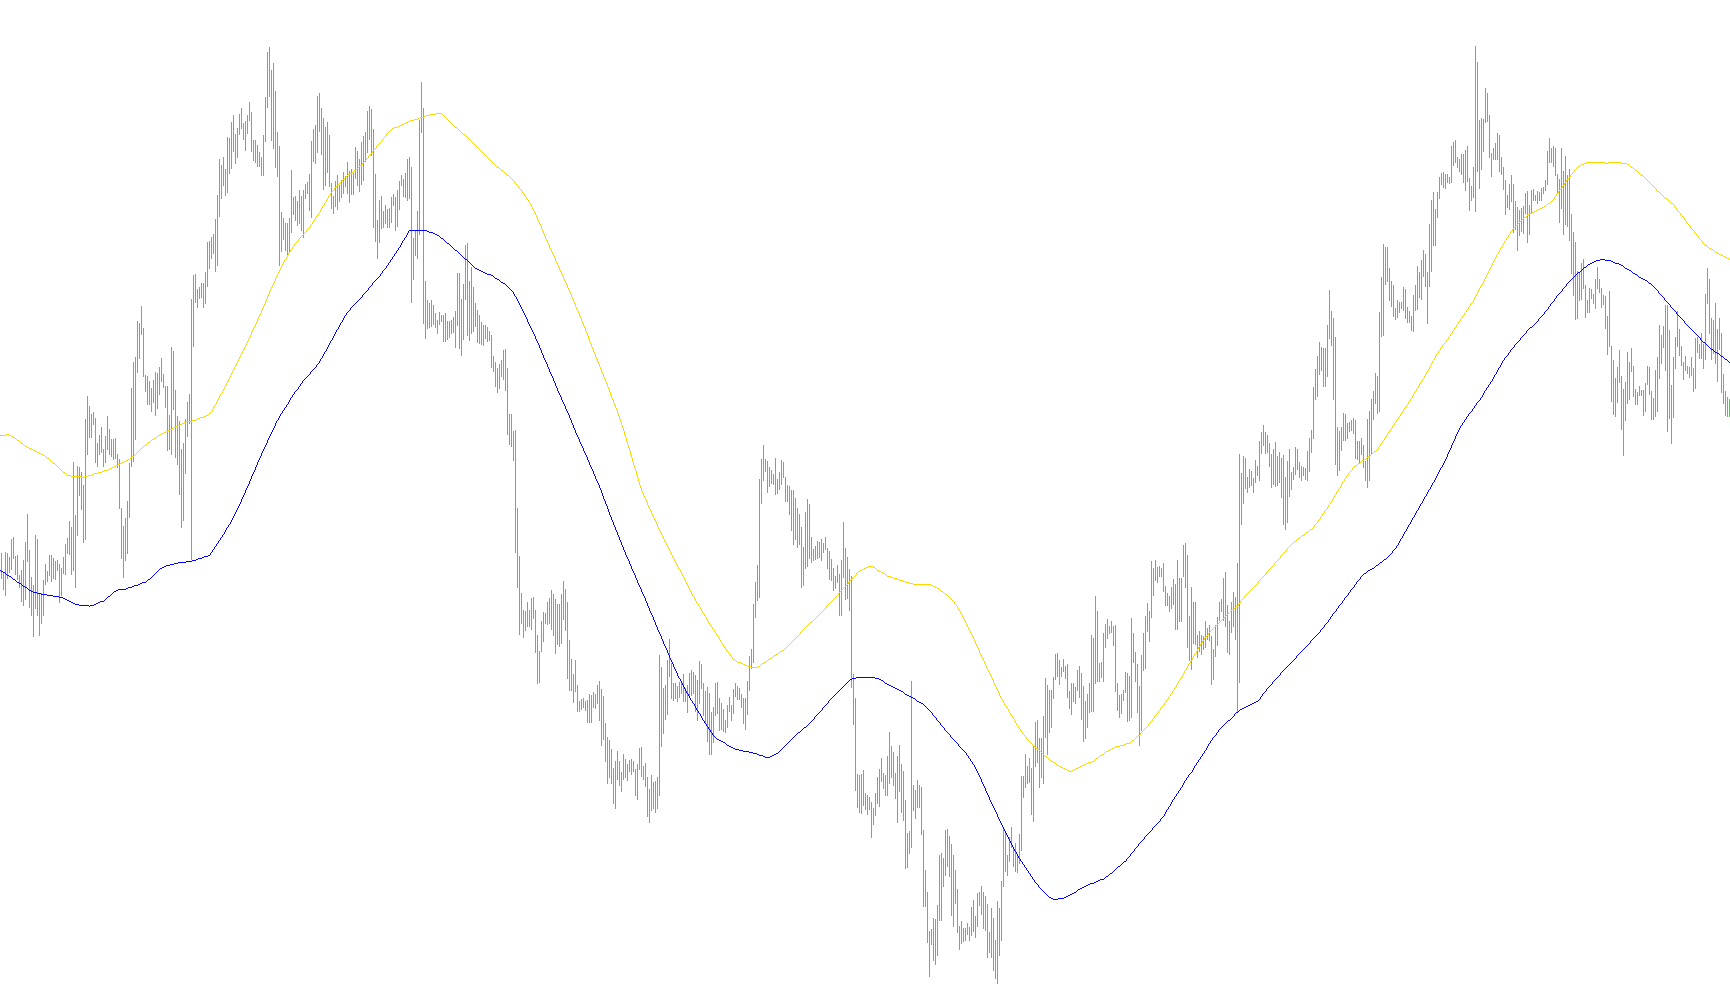
This indicator calculates smoothed moving averages of the highest highs and lowest lows over a specific rolling window to identify price boundaries.

VKW_Bands_-_IBS
Indicator

VKW_Bands_-_IBS

iMAOnArray

This indicator identifies price extremes by extracting maximum and minimum values from a nested Input Basis Signal, applying smoothing filters to generate volatility boundaries.

VKW_Bands_-_IBS2
Indicator

VKW_Bands_-_IBS2

iMAOnArray

The logic identifies price position relative to the high-low range and projects smoothed upper and lower boundaries based on historical maximums and minimums.

VKW_Bands_modified
Indicator

VKW_Bands_modified

iMAOnArray

This indicator identifies price extremes by extracting high and low values from a custom METRO source and applying moving average smoothing to establish dynamic volatility boundaries.

Indicator

VMesquita

Indicator

VMesquita_v1

VM_Price_Action_1.2
Indicator

VM_Price_Action_1.2

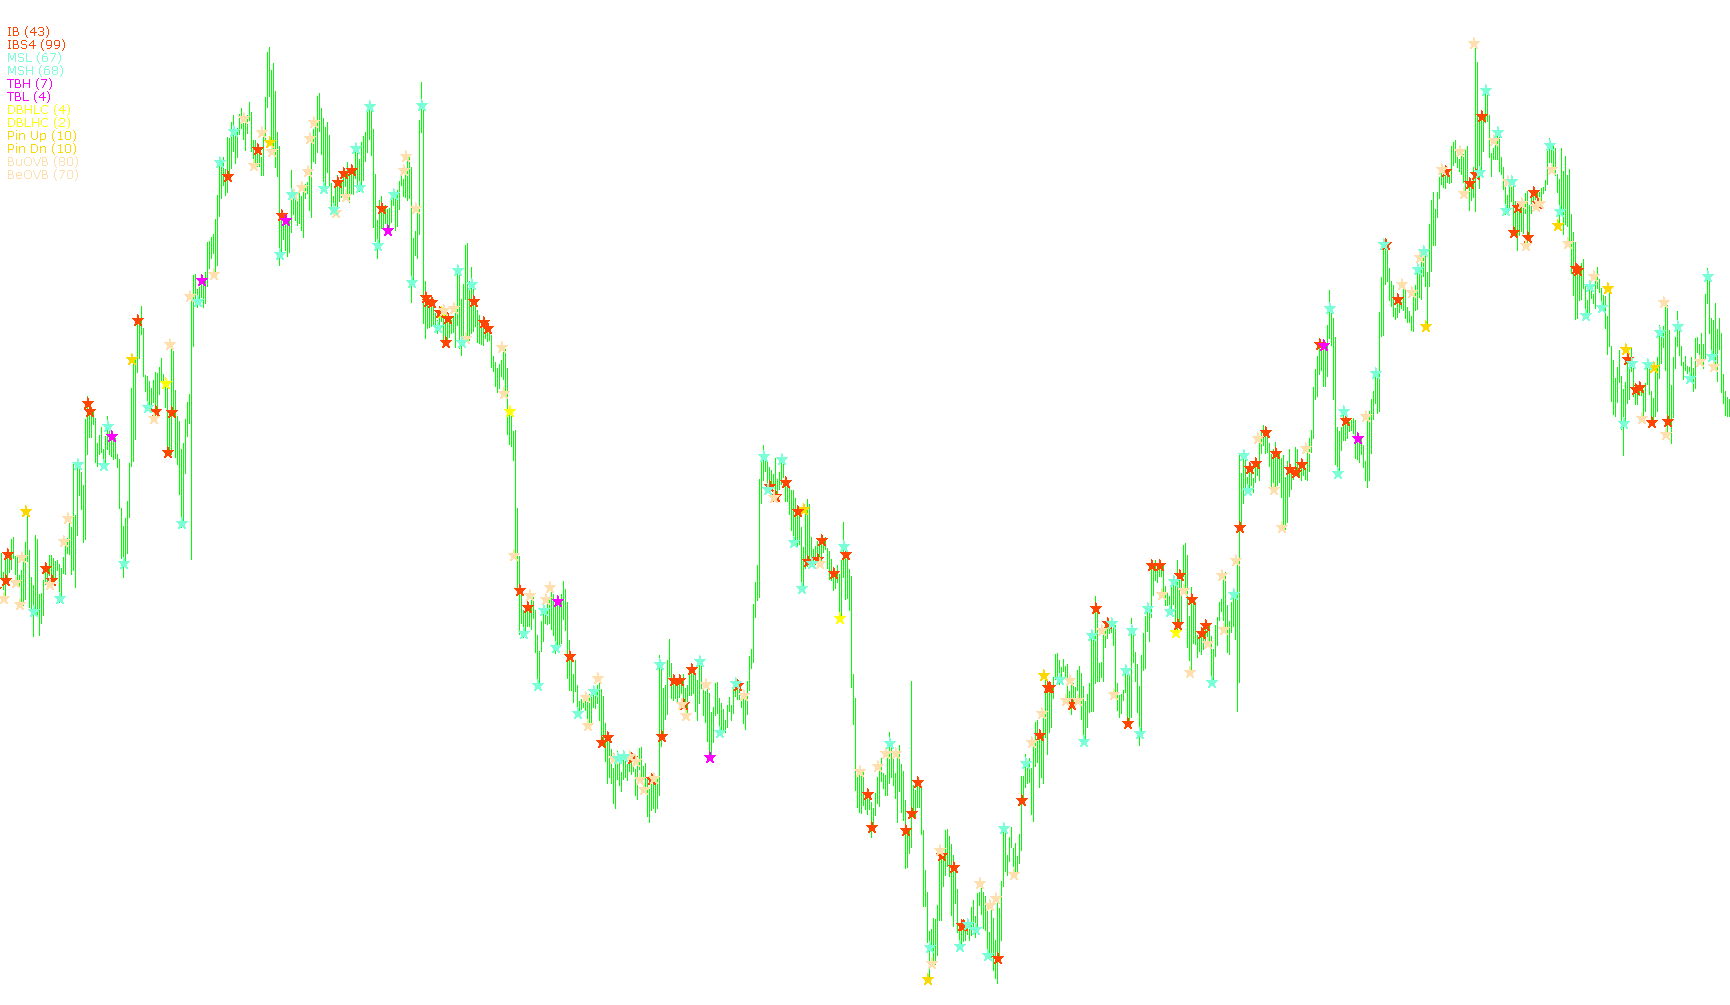
This indicator identifies multi-dimensional market dynamics by detecting price action signatures including breakout bars, structural pivots, and candlestick patterns.

Volatility 3 pairs
Indicator

Volatility 3 pairs

iMA

Quantifies the spread between dual moving averages across GBPUSD, USDJPY, and GBPJPY to highlight relative price momentum and volatility shifts.

Volatility Pivot
Indicator

Volatility Pivot

iATRiMAOnArray

This indicator calculates a responsive price boundary by dynamically adjusting an offset based on smoothed ATR values or fixed point increments to track market structural shifts.

Indicator

Volatility Stop

Volatility
Indicator

Volatility

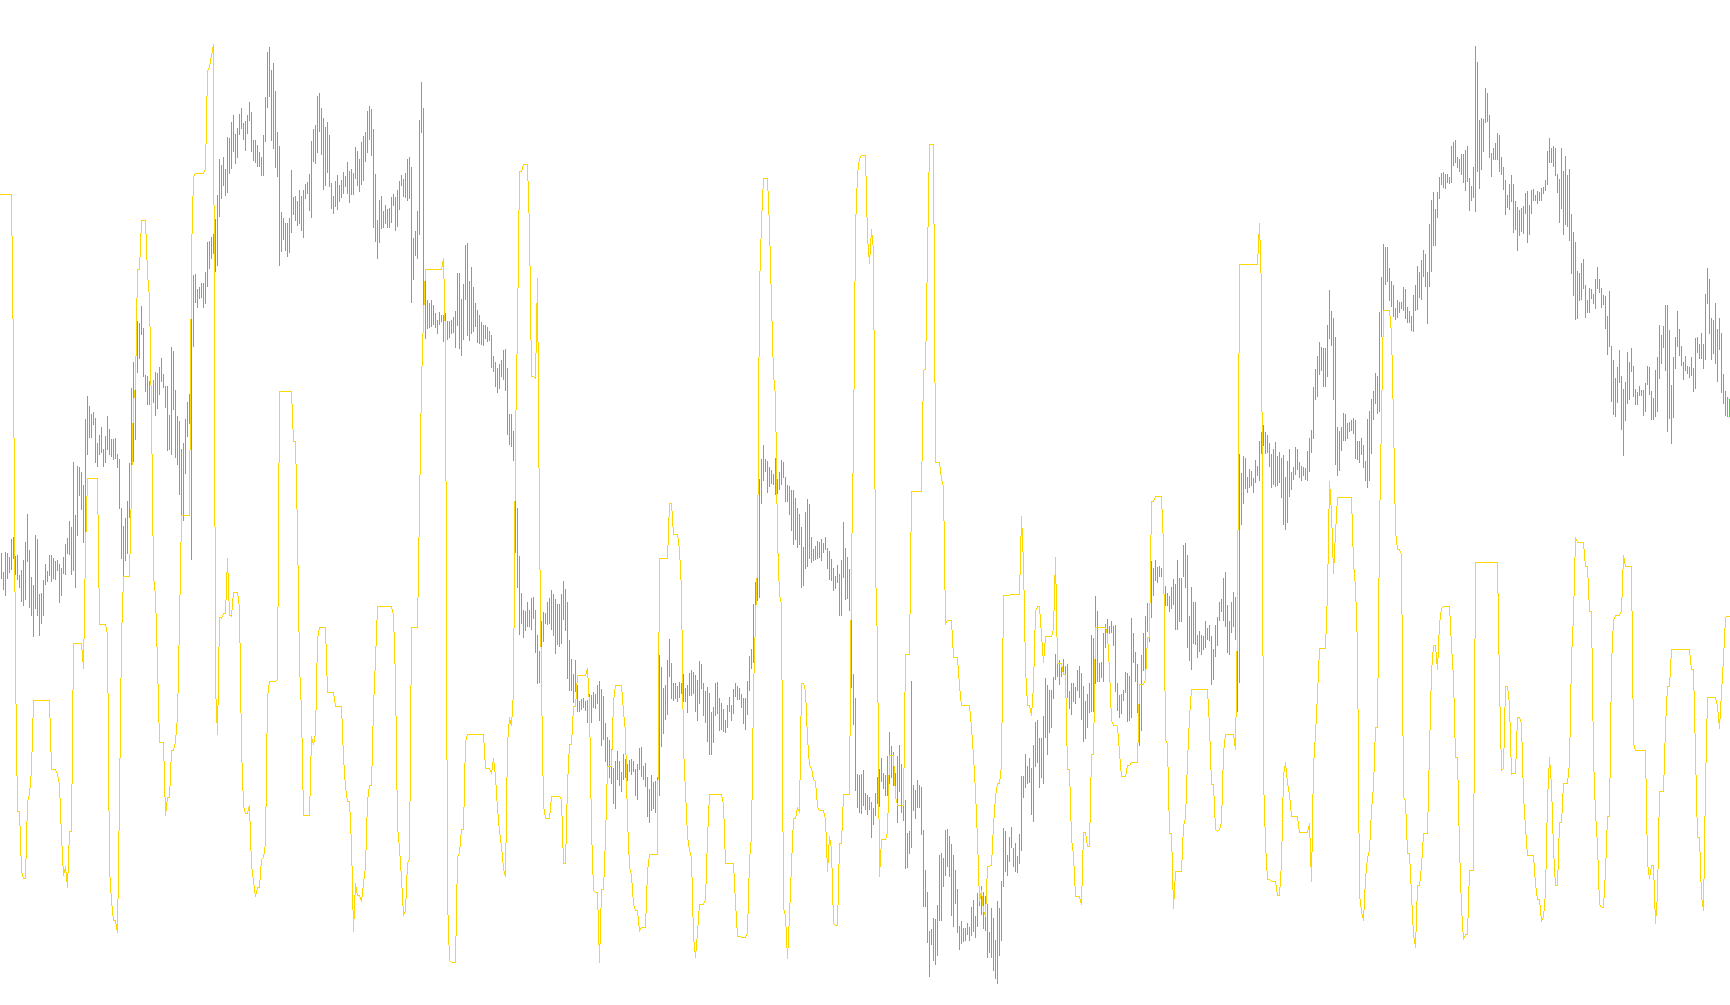
Quantifies market instability by normalizing the peak-to-trough spread over a rolling period into a continuous volatility trajectory.