ttm-trend_v2
Download script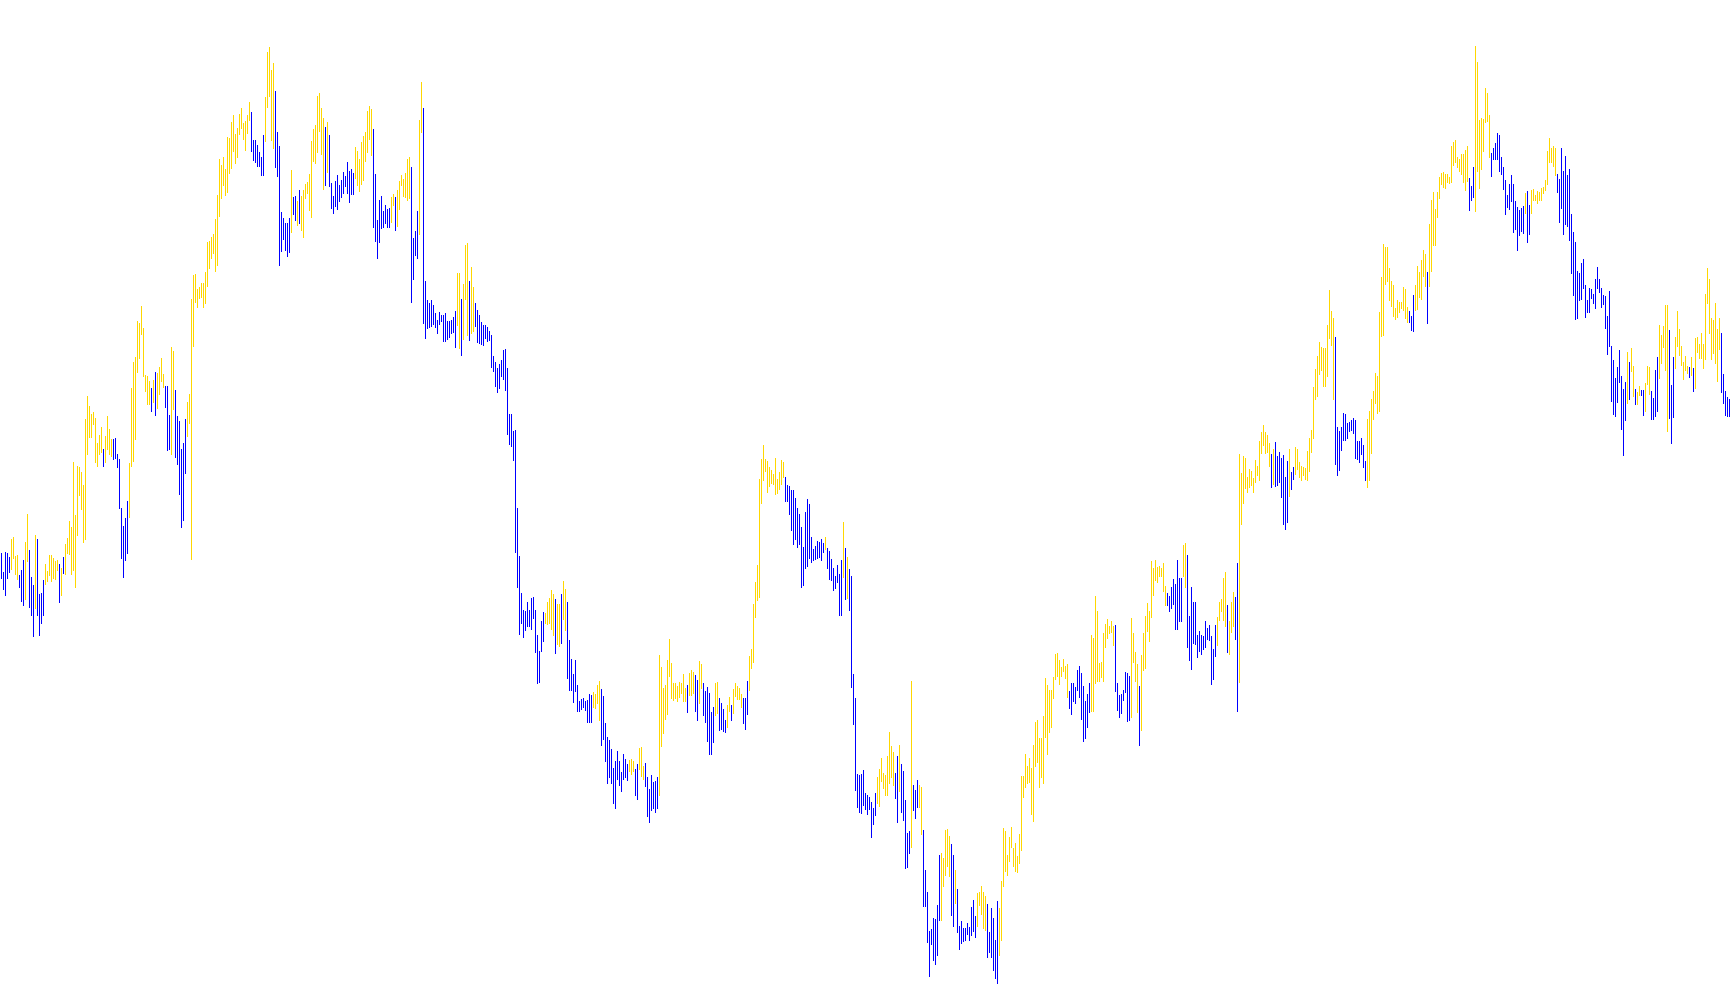
This tool is designed to provide traders with a visual representation of market trends by identifying the dominant direction of price movement. Instead of relying solely on standard price candles, it uses a specialized calculation method to smooth out market "noise" and highlight the prevailing momentum.
Core Logic and Methodology
The script operates through three primary logical stages:
1. Price Smoothing (Heikin-Ashi Foundation) The tool begins by transforming standard price data into a modified format. It calculates a specific "average" price for each bar based on the previous period's data combined with the current period's highs, lows, and closes. This helps to create a more fluid continuous line of movement, making it easier to see the underlying trend rather than being distracted by sudden, erratic price spikes.
2. Trend Identification and Momentum Tracking Once the smoothed prices are established, the tool determines the "color" or sentiment of each bar:
- If the smoothed closing price is higher than the smoothed opening price, it suggests bullish (upward) momentum.
- If the smoothed closing price is lower than the smoothed opening price, it suggests bearish (downward) momentum.
3. Trend Persistence and Overlap Analysis To ensure that the trend direction is consistent and not just a momentary flicker, the tool incorporates a look-back mechanism (controlled by a user-defined number of bars). It checks if the current price action overlaps with previous price ranges. If the current movement is "trapped" within the boundaries of recent history, the tool maintains the previous trend's direction. This prevents the visual indicator from flipping back and forth rapidly during periods of consolidation, ensuring that only significant shifts in momentum change the displayed trend.
Visual Representation
The final output is rendered as a histogram on your chart:
- When the logic detects a bullish trend, it highlights the price range using one specific color (Blue), typically anchoring to the high and low of those periods.
- When the logic detects a bearish trend, it switches to another color (Red).
By combining smoothed price averages with a persistence check, this script helps traders filter out "market noise" to better visualize whether the current market environment is trending upwards or downwards.
//+------------------------------------------------------------------+
//|                                                    ttm-trend.mq4 |
//|                Copyright © 2005, Nick Bilak, beluck[AT]gmail.com |
//+------------------------------------------------------------------+
#property copyright "Copyright © 2005, Nick Bilak"
#property indicator_chart_window
#property indicator_buffers 2
#property indicator_color2 Red
#property indicator_color1 Blue
//---- input parameters
extern int       CompBars=6;
//---- buffers
double buf1[];
double buf2[];
double haOpen[];
double haClose[];
double icolor[];
//+------------------------------------------------------------------+
//| Custom indicator initialization function                         |
//+------------------------------------------------------------------+
int init()
  {
//---- indicators
   IndicatorBuffers(5);
   SetIndexStyle(0,DRAW_HISTOGRAM);
   SetIndexBuffer(0,buf1);
   SetIndexStyle(1,DRAW_HISTOGRAM);
   SetIndexBuffer(1,buf2);
   SetIndexBuffer(2,haOpen);
   SetIndexBuffer(3,haClose);
   SetIndexBuffer(4,icolor);
//----
   return(0);
  }
//+------------------------------------------------------------------+
//| Custor indicator deinitialization function                       |
//+------------------------------------------------------------------+
int deinit()
  {
//----
//----
   return(0);
  }
//+------------------------------------------------------------------+
//| Custom indicator iteration function                              |
//+------------------------------------------------------------------+
int start()
  {
   int shift,limit,i;
   int counted_bars=IndicatorCounted();
   if (counted_bars<0) return(-1);
   if (counted_bars>0) counted_bars--;
   limit=Bars-4;
   if(counted_bars>=1) limit=Bars-counted_bars-4;
//----
   double dip,dim,stm,sts,macdm,macds;
//----
   if (haOpen[limit+3]==0.0) haOpen[limit+3]=Open[limit+3];
   haClose[limit+3]=(Open[limit+3]+High[limit+3]+Low[limit+3]+Close[limit+3])/4.0;
//----
   for(shift=limit+2; shift>=0; shift--)
     {
      haOpen[shift]=(haOpen[shift+1]+haClose[shift+1])/2.0;
      haClose[shift]=(Open[shift]+High[shift]+Low[shift]+Close[shift])/4.0;
      //----
      if (haClose[shift] > haOpen[shift]) icolor[shift]=1;
      else icolor[shift]=-1;
      //----
      for(i=1; i<=CompBars; i++)
        {
         if(haOpen[shift]<=MathMax(haOpen[shift+i],haClose[shift+i]) &&
               haOpen[shift]>=MathMin(haOpen[shift+i],haClose[shift+i]) &&
              haClose[shift]<=MathMax(haOpen[shift+i],haClose[shift+i]) &&
              haClose[shift]>=MathMin(haOpen[shift+i],haClose[shift+i]) )
            icolor[shift]=icolor[shift+i];
        }
      if (icolor[shift]>0)
        {
         buf1[shift]=High[shift];
         buf2[shift]=Low[shift];
        }
      else
        {
         buf2[shift]=High[shift];
         buf1[shift]=Low[shift];
        }
     }
  }
//+------------------------------------------------------------------+
Comments