TTF_TR
Download script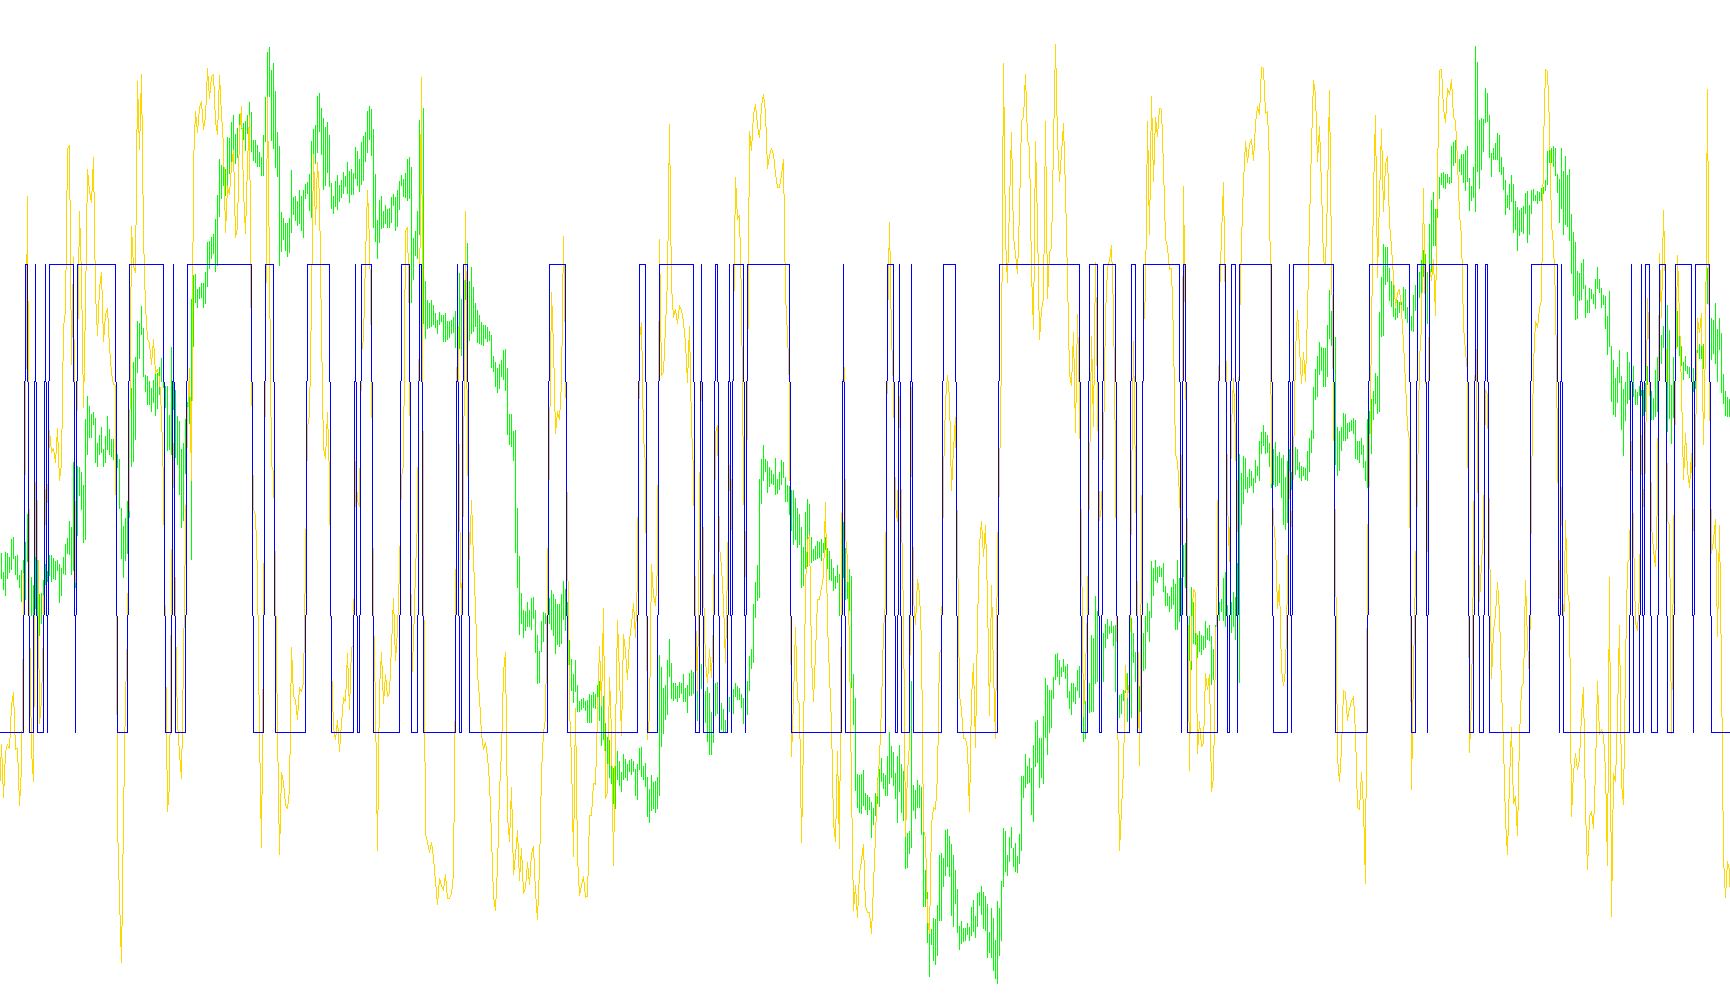
This tool is designed to help traders identify the underlying strength and direction of a market trend by measuring "Buying Power" versus "Selling Power." Unlike many indicators that rely on simple averages, this script looks at the relationship between recent price extremes and historical extremes over a specific period.
How the Logic Works
The core of the indicator is based on comparing two different timeframes simultaneously: the immediate present (the most recent price action) and a slightly older historical window.
1. Measuring Market Forces To determine the current momentum, the script calculates two distinct values:
- Buying Power: It looks at the highest price reached in the very last candle and compares it to the lowest price reached during the preceding historical period. This represents how aggressively buyers are pushing the price upward relative to previous lows.
- Selling Power: Conversely, it takes the highest price from the historical period and compares it to the lowest price of the most recent candle. This represents the downward pressure or "resistance" from sellers.
2. The Trend Force (TTF) Calculation The script then performs a mathematical calculation to determine the "Trend Force" percentage. It subtracts the Selling Power from the Buying Power and divides it by the average of both forces.
- A positive result suggests that buying pressure is dominant compared to selling pressure.
- A negative result suggests that selling pressure is dominating the market.
3. Visual Representation The indicator provides two distinct visual lines in a separate window below your main price chart:
- The Main Line (Trend Force): This oscillates to show the relative strength of the trend. It moves up or down based on which force—buying or selling—is currently winning the tug-of-war in the market.
- The Signal Line: This acts as a simplified binary guide. Based on whether the Trend Force is positive or negative, the signal line jumps between two fixed levels (Top and Bottom). It provides a clear visual cue to help you distinguish between an upward bias and a downward bias at a glance.
Key Characteristics
- No "Lookahead" Bias: The logic only uses past and present data. This ensures that the signals you see on the chart are based on completed price action, not "future" information that wouldn't be available in real-time trading.
- No Smoothing: The indicator does not blur or average out the price data artificially. It reflects the raw relationship between the high and low prices of the candles.
- Real-Time Response: By comparing the immediate candle to a set number of previous bars (defaulting to 15), it captures rapid shifts in momentum as they happen.
//+------------------------------------------------------------------+
//|                                       Trendscalpindic.mq4        |
//|                        Based on Nick Beluk's TTF implementation  |
//|                        No redrawing, no lookahead, nosmoothing   |
//+------------------------------------------------------------------+
#property copyright "Copyright © 2005, Nick Bilak"
#property link      "beluck[at]gmail.com"

#property indicator_separate_window
#property indicator_buffers 2
#property indicator_color1 LightSeaGreen
#property indicator_color2 Red
//---- input parameters
extern int TTFbars=15;
//15=default number of bars for computation
//---- buffers
double MainBuffer[];
double SignalBuffer[];
//----
int TopLine=100;
int BottomLine=-100;
int draw_begin1=0;
int draw_begin2=0;
double  HighestHighRecent=0;
double  HighestHighOlder =0;
double  LowestLowRecent =0;
double  LowestLowOlder =0;
double  BuyPower =0;
double  SellPower=0;
double  TTF=0;

//+------------------------------------------------------------------+
//| Custom indicator initialization function                         |
//+------------------------------------------------------------------+
int init()
  {
   string short_name;
//---- 2 additional buffers are used for counting.
   IndicatorBuffers(2);
//---- indicator lines
   SetIndexStyle(0,DRAW_LINE);
   SetIndexBuffer(0, MainBuffer);
   SetIndexStyle(1,DRAW_LINE);
   SetIndexBuffer(1, SignalBuffer);
//---- name for DataWindow and indicator subwindow label
   short_name="TTF_TR("+TTFbars+")";
   IndicatorShortName(short_name);
   SetIndexLabel(0,short_name);
   SetIndexLabel(1,"Signal");
//----
   draw_begin1=TTFbars*2+1;
   draw_begin2=draw_begin1;
   SetIndexDrawBegin(0,draw_begin1);
   SetIndexDrawBegin(1,draw_begin2);

//----
   return(0);
  }
//+------------------------------------------------------------------+
//| ttf                                            |
//+------------------------------------------------------------------+
int start()
  {
   int    i,k;
   int    counted_bars=IndicatorCounted();
   double price;
//----
   if(Bars<=draw_begin2) return(0);
//---- initial zero
   if(counted_bars<1)
     {
      for(i=1;i<=draw_begin1;i++) MainBuffer[Bars-i]=0;
      for(i=1;i<=draw_begin2;i++) SignalBuffer[Bars-i]=0;
     }
//---- %K line
   i=Bars-draw_begin1;
   if(counted_bars>draw_begin1) i=Bars-counted_bars-1;
   while(i>=0)
     {
   HighestHighRecent=High[Highest(Symbol(), 0, MODE_HIGH,1,i)];
   HighestHighOlder=High[Highest(Symbol(), 0, MODE_HIGH,TTFbars,i+1)];
   LowestLowRecent=Low [Lowest (Symbol(), 0, MODE_LOW,1,i)];
   LowestLowOlder=Low [Lowest (Symbol(), 0, MODE_LOW,TTFbars,i+1)];
   BuyPower=HighestHighRecent-LowestLowOlder;
   SellPower=HighestHighOlder-LowestLowRecent;
   TTF=(BuyPower-SellPower)/(0.5*(BuyPower+SellPower))*100;
     //Print (Time[i], "   ", HighestHighRecent, ",  ",HighestHighOlder, ",  ", LowestLowRecent, ",  ",LowestLowOlder    );

  MainBuffer[i]=TTF;
  i--;
 }
//---- last counted bar will be recounted
   if(counted_bars>0) counted_bars--;
   int limit=Bars-counted_bars;
//---- signal line is simple movimg average
   for(i=0; i<limit; i++) {
      if (MainBuffer[i]>=0)
         SignalBuffer[i]=TopLine;
      else
         SignalBuffer[i]=BottomLine;
   }
//----
   return(0);
  }
//+------------------------------------------------------------------+
Comments