TSI_v2
Download script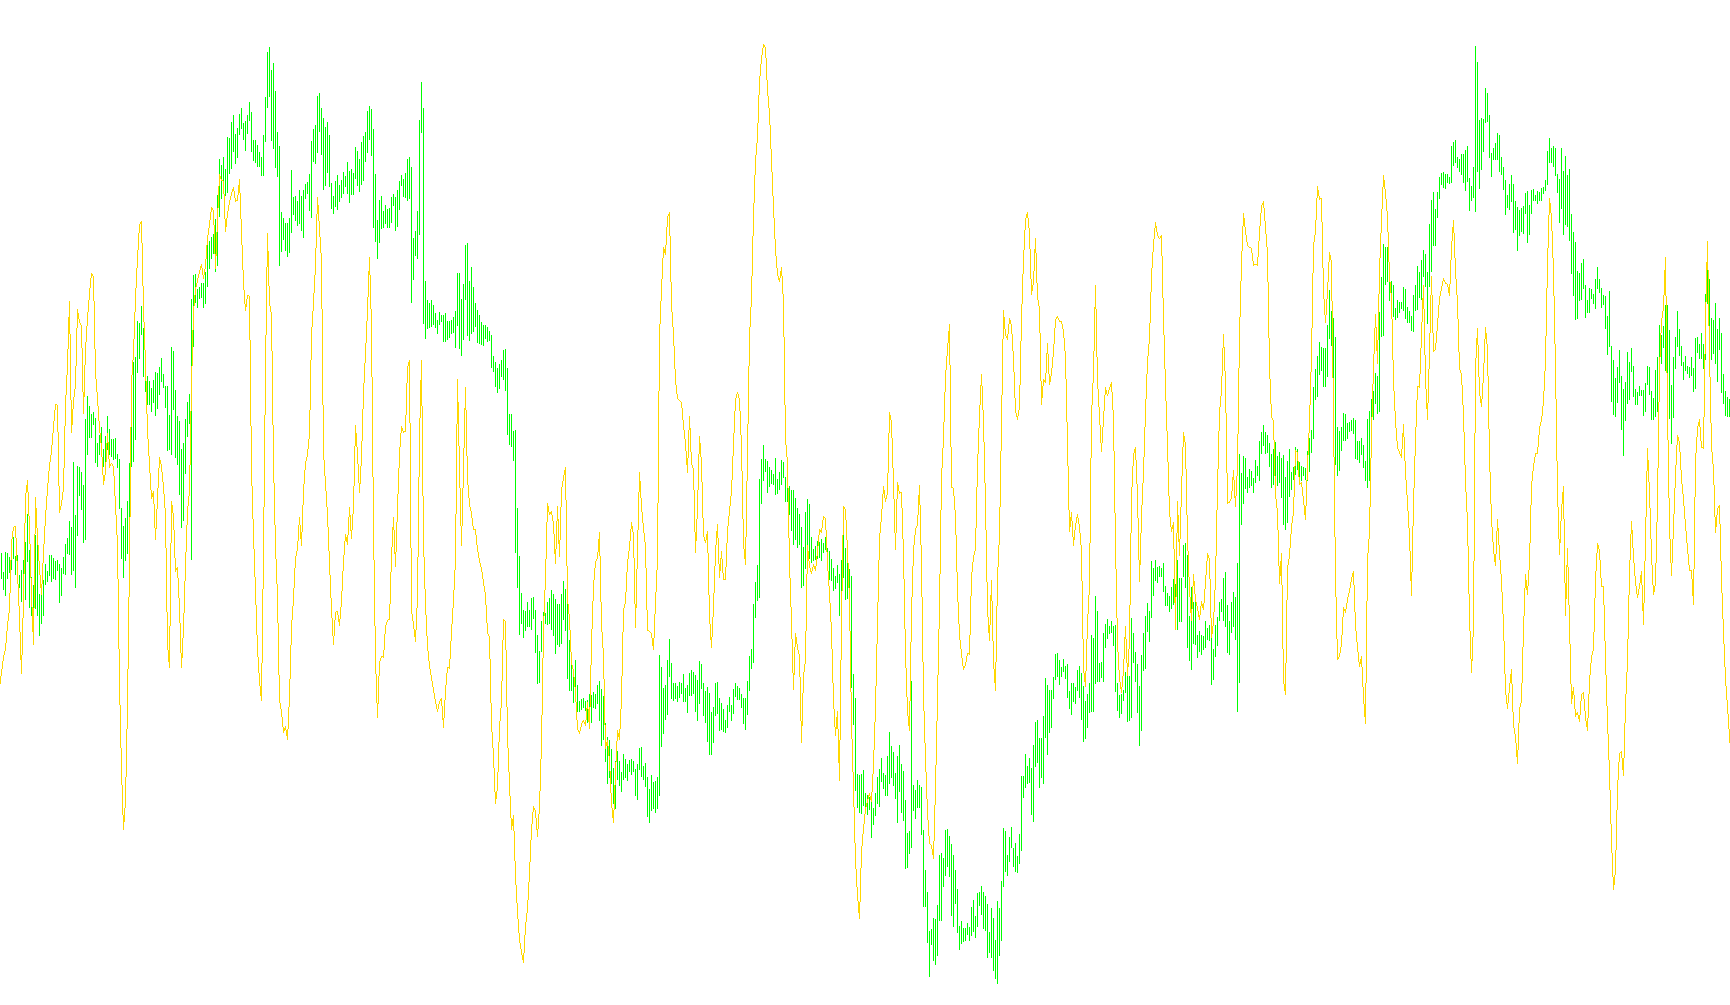
This script is designed as a technical analysis tool for the MetaTrader platform, specifically created to help traders visualize market momentum and identify directional trends. It calculates a specialized momentum indicator that filters out "noise" from price action to provide a clearer view of whether a market is moving upward or downward with strength.
Core Logic and Workflow
The script processes market data through four distinct stages to arrive at its final visual output:
1. Measuring Raw Momentum The process begins by calculating the basic difference between the most recent closing price and the previous closing price. This identifies the immediate direction and "speed" of the price movement.
2. Establishing Absolute Magnitude To ensure the tool can measure the strength of a move regardless of whether it is positive (up) or negative (down), the script calculates the absolute value of that momentum. This focuses strictly on how much the price is moving, stripping away the direction for a moment to analyze pure volatility.
3. Multi-Layered Smoothing Raw market data is often erratic. To create a readable trend, the script applies two successive layers of Exponential Moving Averages (EMA).
- The first layer smooths the raw momentum data.
- The second layer further smooths those results based on user-defined parameters. By applying these averages to both the standard momentum and the absolute momentum, the tool creates a stabilized "path" that is less reactive to minor, insignificant price fluctuations.
4. Final Calculation and Visualization In the final step, the script performs a ratio calculation. It takes the smoothed momentum (the direction) and divides it by the smoothed absolute momentum (the magnitude), then multiplies the result by 100.
Purpose for the Trader
The resulting line on your chart represents a normalized momentum score. By comparing this value against a zero baseline, traders can more easily identify:
- Trend Direction: Whether the current price flow is predominantly bullish or bearish.
- Strength of Movement: How aggressively the price is moving in that direction compared to its recent history.
- Momentum Shifts: Points where the trend may be losing steam or starting to reverse.
//+------------------------------------------------------------------+
//|                                                          TSI.mq4 |
//|                      Copyright © 2005, MetaQuotes Software Corp. |
//|                                        http://www.metaquotes.net |
//+------------------------------------------------------------------+
#property copyright "Copyright © 2005, MetaQuotes Software Corp."
#property link      "http://www.metaquotes.net"
//----
#property indicator_separate_window
#property indicator_buffers 1
#property indicator_color1 Red
//---- input parameters
extern int       First_R=5;
extern int       Second_S=8;
//---- buffers
double TSI_Buffer[];
double MTM_Buffer[];
double EMA_MTM_Buffer[];
double EMA2_MTM_Buffer[];
double ABSMTM_Buffer[];
double EMA_ABSMTM_Buffer[];
double EMA2_ABSMTM_Buffer[];
//+------------------------------------------------------------------+
//| Custom indicator initialization function                         |
//+------------------------------------------------------------------+
int init()
  {
//---- indicators
   IndicatorBuffers(7);
   SetIndexBuffer(1, MTM_Buffer);
   SetIndexBuffer(2, EMA_MTM_Buffer);
   SetIndexBuffer(3, EMA2_MTM_Buffer);
   SetIndexBuffer(4, ABSMTM_Buffer);
   SetIndexBuffer(5, EMA_ABSMTM_Buffer);
   SetIndexBuffer(6, EMA2_ABSMTM_Buffer);
   SetIndexStyle(0,DRAW_LINE);
   SetIndexBuffer(0,TSI_Buffer);
   SetIndexLabel(0,"TSI");
//----
   return(0);
  }
//+------------------------------------------------------------------+
//| Custor indicator deinitialization function                       |
//+------------------------------------------------------------------+
int deinit()
  {
//---- TODO: add your code here
//----
   return(0);
  }
//+------------------------------------------------------------------+
//| Custom indicator iteration function                              |
//+------------------------------------------------------------------+
int start()
  {
   int    counted_bars=IndicatorCounted();
   int limit,i;
   limit=Bars-counted_bars-1;
   for(i=Bars-1;i>=0;i--)
     {
      MTM_Buffer[i]=Close[i]-Close[i+1];//iMomentum(NULL,0,1,PRICE_CLOSE,i);
      ABSMTM_Buffer[i]=MathAbs(MTM_Buffer[i]);
      //TSI_Buffer[i]=ABSMTM_Buffer[i];
     }
   for(i=Bars-1;i>=0;i--)
     {
      EMA_MTM_Buffer[i]=iMAOnArray(MTM_Buffer,0,First_R,0,MODE_EMA,i);
      EMA_ABSMTM_Buffer[i]=iMAOnArray(ABSMTM_Buffer,0,First_R,0,MODE_EMA,i);
      //TSI_Buffer[i]=EMA_ABSMTM_Buffer[i];
     }
   for(i=Bars-1;i>=0;i--)
     {
      EMA2_MTM_Buffer[i]=iMAOnArray(EMA_MTM_Buffer,0,Second_S,0,MODE_EMA,i);
      EMA2_ABSMTM_Buffer[i]=iMAOnArray(EMA_ABSMTM_Buffer,0,Second_S,0,MODE_EMA,i);
      //TSI_Buffer[i]=EMA2_ABSMTM_Buffer[i];
     }
   for(i=Bars-1;i>=0;i--)
     {
      TSI_Buffer[i]=100.0*EMA2_MTM_Buffer[i]/EMA2_ABSMTM_Buffer[i];
     }
//---- TODO: add your code here
//----
   return(0);
  }
//+------------------------------------------------------------------+
Comments