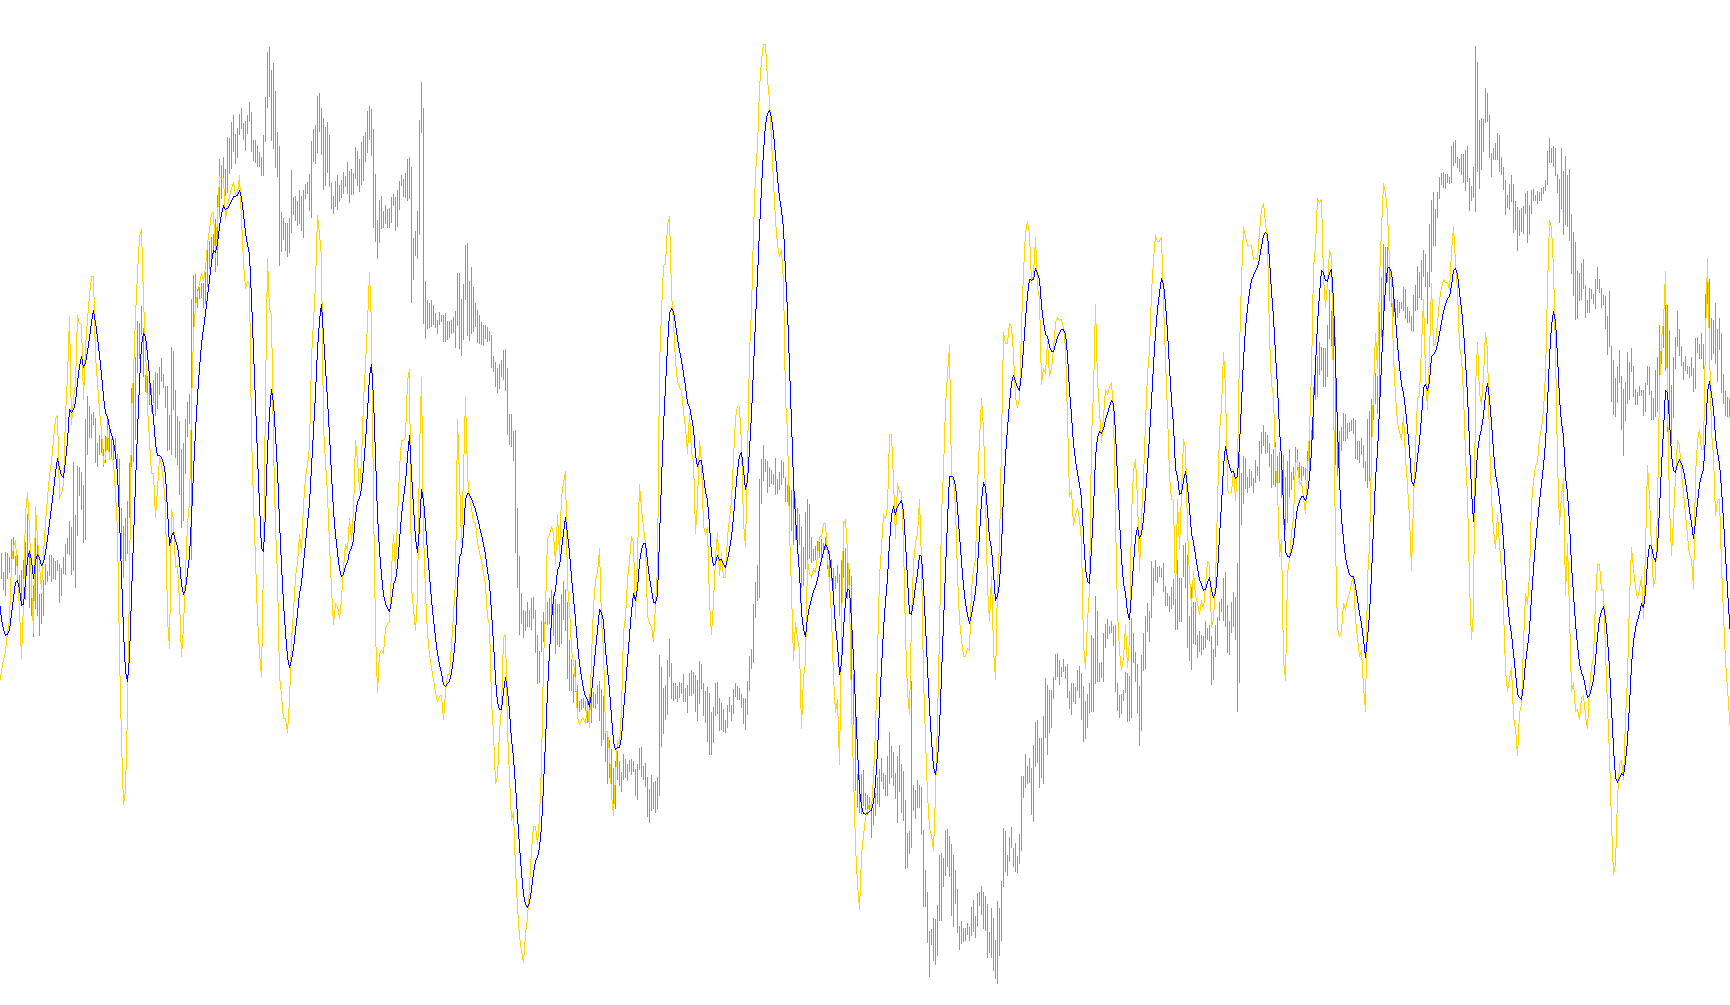
This technical tool is designed to help traders visualize and interpret market momentum by filtering out "noise" and identifying the underlying strength of price movements. Rather than looking at raw price alone, it focuses on the velocity of change to provide a clearer picture of whether a trend is gaining or losing power.
How the Logic Works
The script processes market data through a multi-stage calculation to arrive at its final visual output:
1. Measuring Momentum and Magnitude The process begins by calculating the difference between the current closing price and the previous one. This represents basic momentum—the "speed" at which the price is moving. Simultaneously, the tool calculates the absolute value of this movement, which measures the sheer magnitude (size) of the move, regardless of whether it was up or down.
2. Smoothing the Data Raw market movements are often jagged and erratic. To make the data more readable, the script applies a series of "Exponential Moving Averages" (EMA). This is done in two layers:
- It smooths the raw momentum data to highlight consistent trends.
- It smooths the magnitude data to identify periods of significant volatility versus periods of stagnation.
3. The Core Calculation (Ergodic Analysis) The tool then performs a sophisticated comparison by dividing the smoothed momentum by the smoothed magnitude. By multiplying this result by 100, it creates a normalized oscillator. This allows a trader to see the relationship between price direction and price strength. Essentially, it helps distinguish between a powerful, high-volume trend and a weak, low-volatility drift.
4. The Signal Line Finally, the script applies one last smoothing layer over the resulting calculation to create a "Signal" line. This line acts as a secondary reference point; by observing how the primary indicator moves in relation to this signal line, traders can better identify potential turning points or shifts in market behavior.
Visual Interpretation
The final output appears in a separate window on your chart with two distinct lines:
- The Main Line (Ergodic): Represents the primary momentum calculation.
- The Signal Line: Provides a smoothed average to help confirm trends.
By observing these lines against the designated levels (such as 0, 50, and -50), traders can gauge whether the current market environment is dominated by bullish strength, bearish pressure, or neutral equilibrium.
//+------------------------------------------------------------------+
//|                                                      TSI-Osc.mq4 |
//|                      Copyright © 2005, MetaQuotes Software Corp. |
//|                                        http://www.metaquotes.net |
//+------------------------------------------------------------------+
#property copyright "Copyright © 2005, MetaQuotes Software Corp."
#property link      "http://www.metaquotes.net"

#property indicator_separate_window
#property indicator_buffers 2
#property indicator_color1 White
#property indicator_color2 Coral
#property indicator_maximum 100
#property indicator_minimum -100
#property indicator_level1 0
#property indicator_level2 50
#property indicator_level3 -50
//---- input parameters
// M5 and M15 , 8,8,8
// M30 7,7,7
// H1 and H4 6,6,6
extern int       First_R=7;
extern int       Second_S=7;
extern int       SignalPeriod=7;
//---- buffers
double TSI_Buffer[];
double SignalBuffer[];
double MTM_Buffer[];
double EMA_MTM_Buffer[];
double EMA2_MTM_Buffer[];
double ABSMTM_Buffer[];
double EMA_ABSMTM_Buffer[];
double EMA2_ABSMTM_Buffer[];
//+------------------------------------------------------------------+
//| Custom indicator initialization function                         |
//+------------------------------------------------------------------+
int init()
  {
//---- indicators
   IndicatorBuffers(8);
   SetIndexBuffer(2, MTM_Buffer);
   SetIndexBuffer(3, EMA_MTM_Buffer);
   SetIndexBuffer(4, EMA2_MTM_Buffer);
   SetIndexBuffer(5, ABSMTM_Buffer);
   SetIndexBuffer(6, EMA_ABSMTM_Buffer);
   SetIndexBuffer(7, EMA2_ABSMTM_Buffer);

   SetIndexStyle(0,DRAW_LINE);
   SetIndexBuffer(0,TSI_Buffer);
   SetIndexLabel(0,"Ergodic");
   SetIndexStyle(1,DRAW_LINE);
   SetIndexBuffer(1,SignalBuffer);
   SetIndexLabel(1,"Signal");
//----
   return(0);
  }
//+------------------------------------------------------------------+
//| Custor indicator deinitialization function                       |
//+------------------------------------------------------------------+
int deinit()
  {
//---- TODO: add your code here

//----
   return(0);
  }
//+------------------------------------------------------------------+
//| Custom indicator iteration function                              |
//+------------------------------------------------------------------+
int start()
  {
   int    counted_bars=IndicatorCounted();
   int limit,i;
   limit=Bars-counted_bars-1;//Bars
   for (i=Bars-1;i>=0;i--)//Bars
      {
      MTM_Buffer[i]=(Close[i]-Close[i+1]);
      //MTM_Buffer[i]=((High[i]+Low[i])/2)-((High[i+1]+Low[i+1])/2);
      //MTM_Buffer[i]=(((Close[i]-Close[i+1])/Close[i+1])+Point);
      //MTM_Buffer[i]=iMomentum(NULL,0,1,PRICE_CLOSE,i)-iMomentum(NULL,0,1,PRICE_CLOSE,i+1);
      //MTM_Buffer[i]=iMomentum(NULL,0,1,PRICE_CLOSE,i)-iMomentum(NULL,0,1,PRICE_CLOSE,i+1);
      //MTM_Buffer[i]=iMomentum(NULL,0,1,PRICE_CLOSE,i)-iMomentum(NULL,0,1,PRICE_CLOSE,i+1);
      ABSMTM_Buffer[i]=MathAbs(MTM_Buffer[i]);
      }

   for (i=Bars-1;i>=0;i--)//Bars
      {
      EMA_MTM_Buffer[i]=iMAOnArray(MTM_Buffer,0,First_R,0,MODE_EMA,i);
      EMA_ABSMTM_Buffer[i]=iMAOnArray(ABSMTM_Buffer,0,First_R,0,MODE_EMA,i);
      }

   for (i=Bars-1;i>=0;i--)//Bars
      {
      EMA2_MTM_Buffer[i]=iMAOnArray(EMA_MTM_Buffer,0,Second_S,0,MODE_EMA,i);
      EMA2_ABSMTM_Buffer[i]=iMAOnArray(EMA_ABSMTM_Buffer,0,Second_S,0,MODE_EMA,i);
      }

   for (i=limit;i>=0;i--)//limit
      {
      TSI_Buffer[i]=100.0*EMA2_MTM_Buffer[i]/EMA2_ABSMTM_Buffer[i];
      }
   for (i=limit;i>=0;i--)//limit
      {
      SignalBuffer[i]=iMAOnArray(TSI_Buffer,0,SignalPeriod,0,MODE_EMA,i);
      }

//---- TODO: add your code here

//----
   return(0);
  }
//+------------------------------------------------------------------+
Comments