TTM-Trend_003
Download script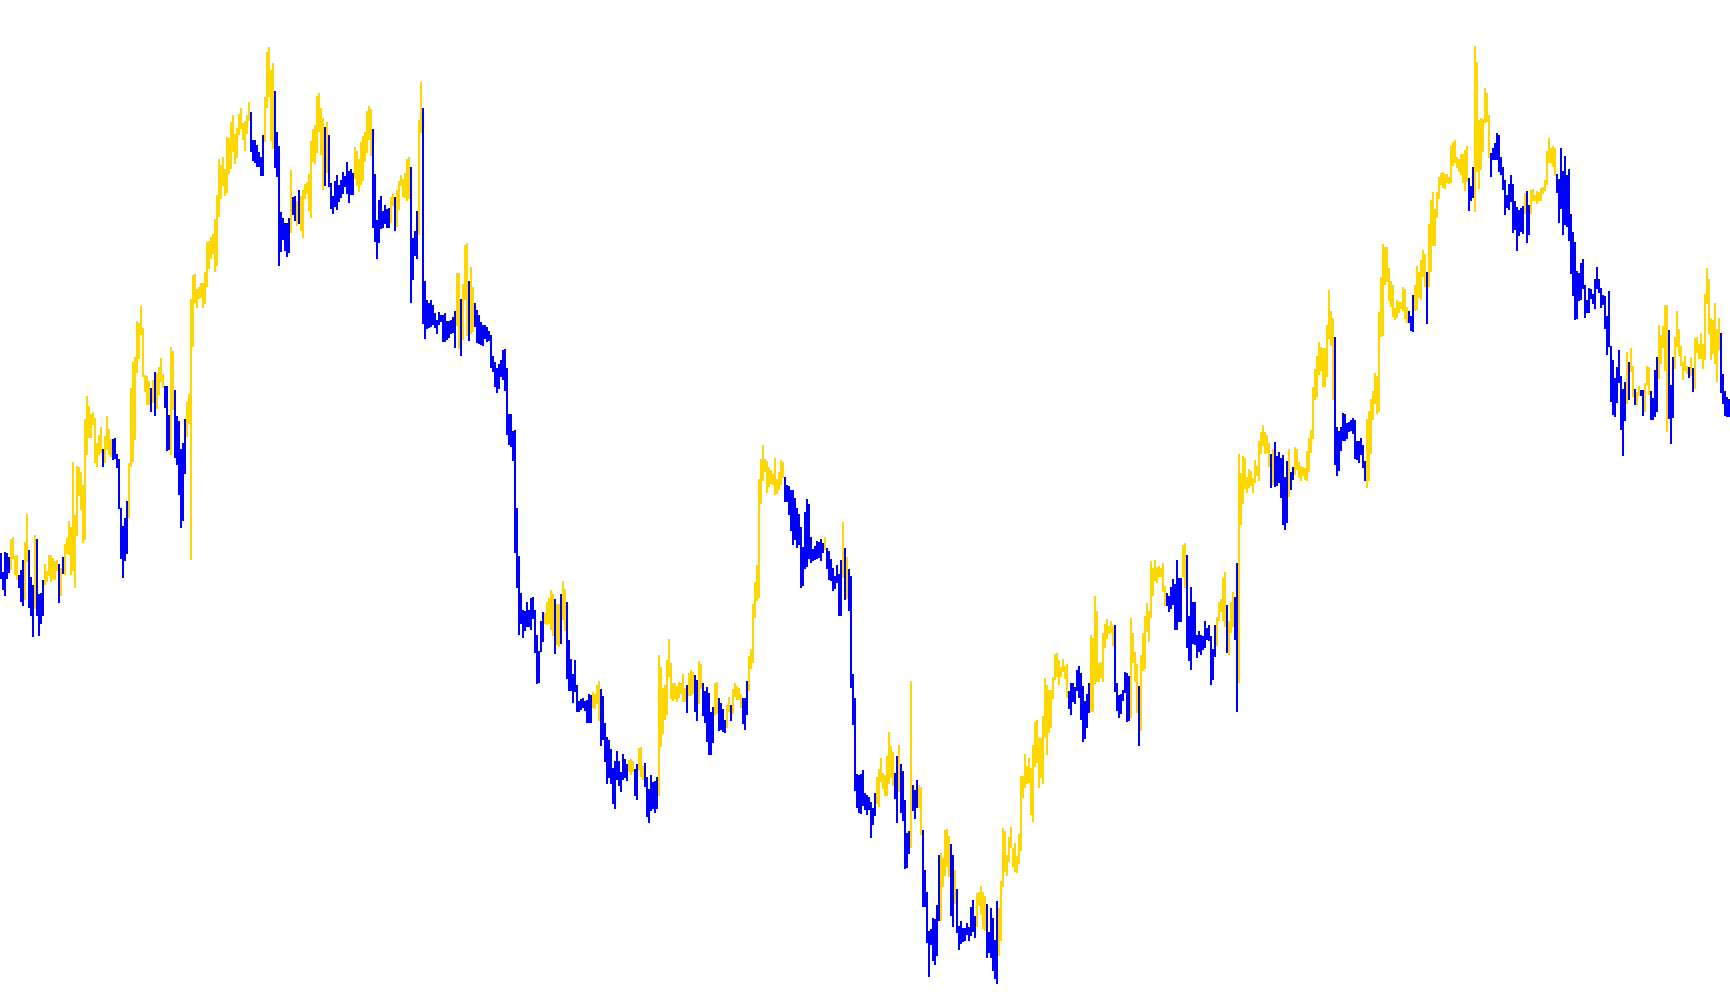
This tool is designed to provide traders with a visual representation of market momentum and trend direction by analyzing price movements in real-time. Instead of looking at standard raw price data, which can often be "noisy" or jumpy, the script uses a specialized calculation method to create a smoother, more reliable picture of where the market is heading.
Core Logic Overview
The indicator operates through three primary logical layers:
1. The Smoothing Foundation (Heikin-Ashi Conversion) The script first converts standard price action into a modified format. It calculates a "synthetic" average by blending the opening, high, low, and closing prices of each candle. This helps filter out minor fluctuations and highlights the underlying trend. By using these smoothed values as its foundation, the tool ensures that the visual signals are based on sustained movement rather than momentary spikes.
2. Dynamic Trend Identification Once the price data is smoothed, the script evaluates the relationship between the synthetic "opening" and "closing" values:
- If the closing value is higher than the opening value, it identifies an upward bias.
- If the closing value is lower than the opening value, it identifies a downward bias.
3. Trend Persistence (The Look-Back Mechanism) To prevent the indicator from flickering between colors during periods of consolidation (where the price is moving sideways), the script includes a "memory" feature. It looks back at a specific number of previous candles (determined by the user setting). If the current candle’s price range overlaps with the price range of a previous candle, the script "inherits" the trend color from that past period. This ensures that the visual trend remains consistent as long as the market is moving in a clear direction, only changing when a significant enough shift in price occurs.
Visual Output
The final result is displayed as a histogram on your chart:
- Blue Histogram: Represents an active upward trend.
- Red Histogram: Represents an active downward trend.
By combining these layers—smoothing the data, identifying the bias, and applying a memory check for consistency—the tool aims to provide a clear, stable visual guide of the prevailing market direction.
//+------------------------------------------------------------------+
//|                                                    TTM-Trend.mq4 |
//|                Copyright © 2005, Nick Bilak, beluck[AT]gmail.com |
//+------------------------------------------------------------------+
#property copyright "Copyright © 2005, Nick Bilak"

#property indicator_chart_window
#property indicator_buffers 2
#property indicator_color2 C'160,000,000' // Red
#property indicator_color1 C'000,150,250' // Blue
//---- input parameters
extern int CompBars=6;
//---- buffers
double buf1[];
double buf2[];
double haOpen[];
double haClose[];
double icolor[];
//+------------------------------------------------------------------+
//| Custom indicator initialization function                         |
//+------------------------------------------------------------------+
int init()
  {
//---- indicators
	IndicatorBuffers(5);
   SetIndexStyle(0,DRAW_HISTOGRAM,0,2);
   SetIndexBuffer(0,buf1);
   SetIndexStyle(1,DRAW_HISTOGRAM,0,2);
   SetIndexBuffer(1,buf2);
   SetIndexBuffer(2,haOpen);
   SetIndexBuffer(3,haClose);
   SetIndexBuffer(4,icolor);

//----
   return(0);
  }
//+------------------------------------------------------------------+
//| Custor indicator deinitialization function                       |
//+------------------------------------------------------------------+
int deinit()
  {
//----

//----
   return(0);
  }
//+------------------------------------------------------------------+
//| Custom indicator iteration function                              |
//+------------------------------------------------------------------+
int start()
  {

   int shift,limit,i;
   int counted_bars=IndicatorCounted();
   if (counted_bars<0) return(-1);
   if (counted_bars>0) counted_bars--;
   limit=Bars-4;
   if(counted_bars>=1) limit=Bars-counted_bars-4;

 	double dip,dim,stm,sts,macdm,macds;

	if (haOpen[limit+3]==0.0) haOpen[limit+3]=Open[limit+3];
	haClose[limit+3] = (Open[limit+3]+High[limit+3]+Low[limit+3]+Close[limit+3])/4.0;

   for(shift = limit+2; shift >= 0; shift--) {
		haOpen[shift] = (haOpen[shift+1]+haClose[shift+1])/2.0;
	   haClose[shift] = (Open[shift]+High[shift]+Low[shift]+Close[shift])/4.0;

		if (haClose[shift] > haOpen[shift]) icolor[shift] = 1;
		else icolor[shift] = -1;

		for (i=1; i<=CompBars; i++) {
			if ( haOpen[shift] <= MathMax(haOpen[shift+i],haClose[shift+i]) &&
	 			  haOpen[shift] >= MathMin(haOpen[shift+i],haClose[shift+i]) &&
				  haClose[shift] <= MathMax(haOpen[shift+i],haClose[shift+i]) &&
				  haClose[shift] >= MathMin(haOpen[shift+i],haClose[shift+i]) )
						icolor[shift] = icolor[shift+i];
		}
		if (icolor[shift]>0) {
			buf1[shift]=High[shift];
			buf2[shift]=Low[shift];
		} else {
			buf2[shift]=High[shift];
			buf1[shift]=Low[shift];
		}
	}
  }
//+------------------------------------------------------------------+
Comments