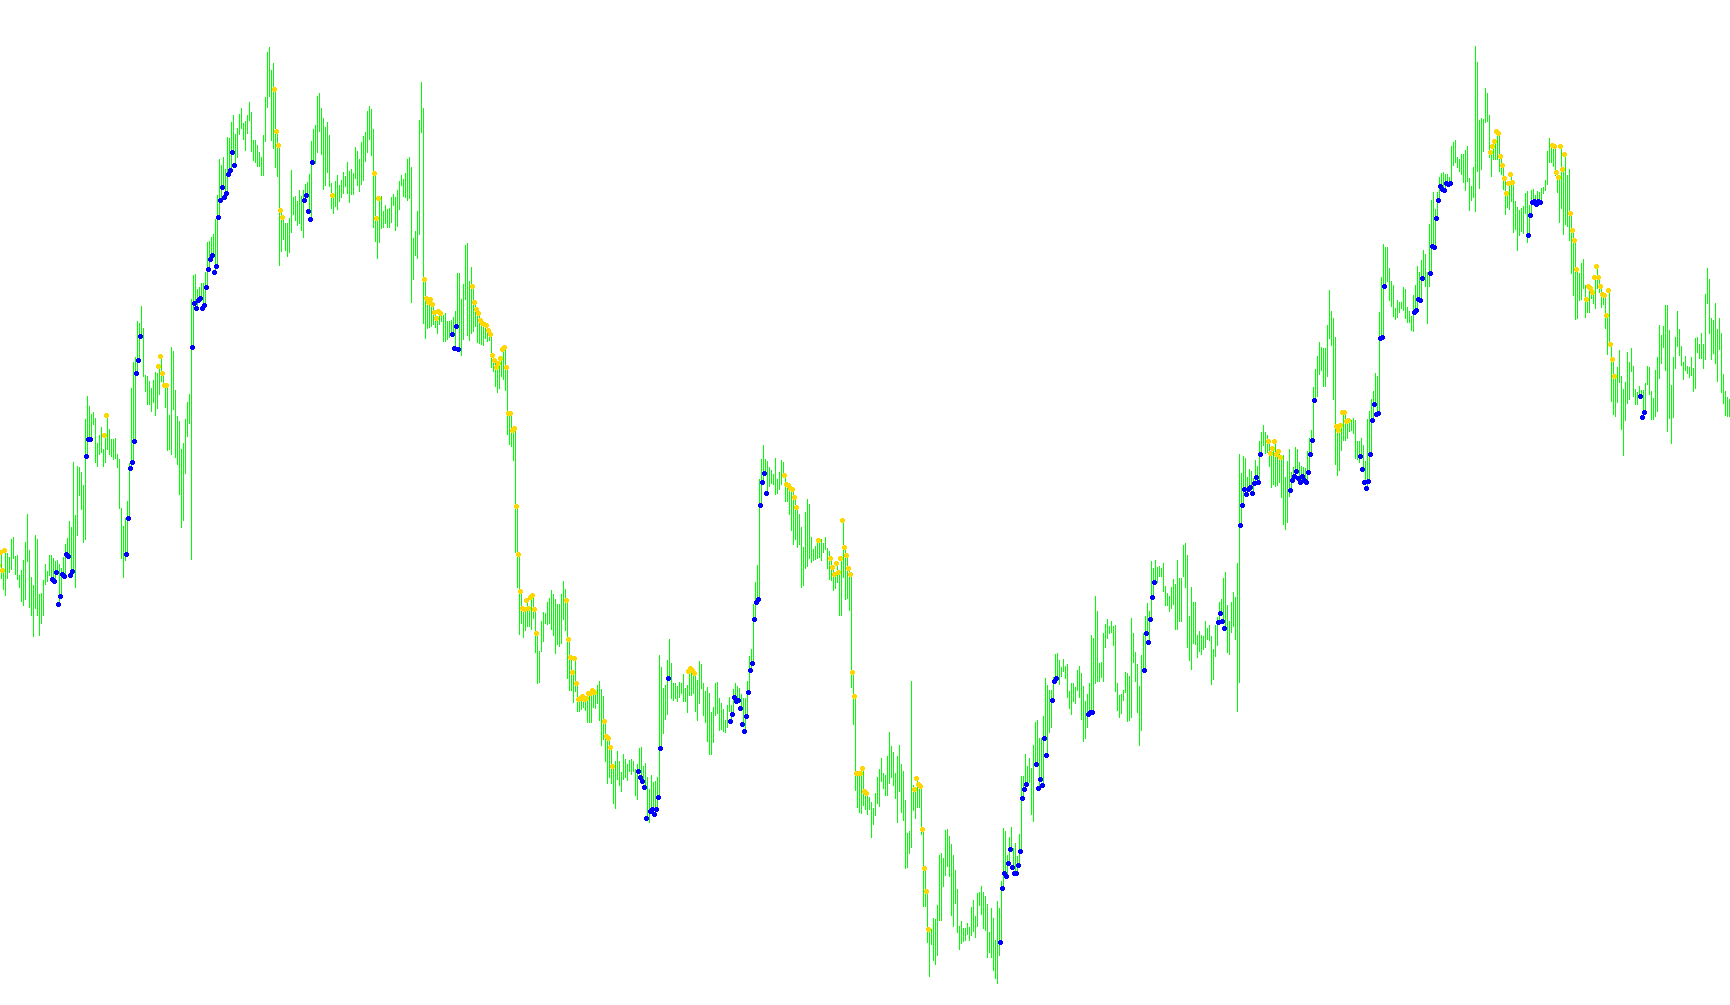
This script functions as a specialized technical analysis tool designed to identify significant shifts in market momentum by comparing recent price action against historical volatility. Instead of simply looking at the current price, it evaluates the "strength" of buying pressure versus selling pressure over specific timeframes.
Core Logic and Mechanics
1. Price Range Analysis The script identifies two distinct periods of price movement: a "recent" window and an "older" window. It captures the highest highs and lowest lows for both segments. By comparing these extremes, the tool establishes a baseline for how much the market has moved in either direction.
2. Momentum Calculation (Buy Power vs. Sell Power) The logic calculates two primary variables:
- Buy Power: Derived from the difference between the recent high and the older low.
- Sell Power: Derived from the difference between the older high and the recent low.
These values are then combined into a percentage-based "TTF" (Trend Following Factor). This factor essentially tells the script which side of the market is currently dominating. If the Buy Power significantly outweighs the Sell Power, the value rises; if the Sell Power dominates, the value drops.
3. Smoothing and Refinement To prevent the signals from being too "jittery" or reactive to minor price fluctuations, the script applies a multi-stage smoothing process. It uses a series of weighted calculations (weighted moving averages) to filter out market noise. This ensures that the final signal represents a sustained trend rather than a temporary spike.
4. Signal Generation The script translates these mathematical calculations into visual markers on your chart. It looks for extreme thresholds:
- Strong Sell Signals: When the trend factor reaches an extreme negative threshold, the script places a marker below the candle.
- Strong Buy Signals: When the trend factor reaches an extreme positive threshold, the script places a marker above the candle.
- Neutral Zones: If the market is undecided or the momentum is balanced (falling between the extreme thresholds), no markers are displayed.
Summary for the User
In simple terms, this tool ignores the "noise" of the market to find moments where buying or selling pressure has reached a tipping point. It looks at how far the price has pushed recently compared to where it was previously, smooths out that data to ensure accuracy, and then places a visual arrow on your chart only when the momentum is strong enough to suggest a significant trend shift.
//+------------------------------------------------------------------+
//|                                                     TTF+-+MW.mq4 |
//|                                                           MojoFX |
//|                                         http://fx.studiomojo.com |
//+------------------------------------------------------------------+
#property copyright "MojoFX"
#property link      "http://fx.studiomojo.com"
//---- indicators setting
#property indicator_chart_window
#property indicator_buffers 2
#property indicator_color1 Red
#property indicator_color2 Green
//---- input parameters
extern int       TTFbars=12;
extern int       t3_period=6;
extern double    b=1.618;
//---- buffers
double ExtMapBuffer1[],ExtMapBuffer2[];
double b2,b3,c1,c2,c3,c4,e1,e2,e3,e4,e5,e6,w1,w2,TTF,r;
double HighestHighRecent,HighestHighOlder,LowestLowRecent,LowestLowOlder;
double BuyPower,SellPower;
//+------------------------------------------------------------------+
//| Custom indicator initialization function                         |
//+------------------------------------------------------------------+
int init()
  {
//---- indicators
   SetIndexStyle(0,DRAW_ARROW);
   SetIndexArrow(0,159);
   SetIndexBuffer(0,ExtMapBuffer1);
   SetIndexEmptyValue(0,0.0);
   SetIndexStyle(1,DRAW_ARROW);
   SetIndexArrow(1,159);
   SetIndexBuffer(1,ExtMapBuffer2);
   SetIndexEmptyValue(1,0.0);
//----
   b2=b*b;
   b3=b2*b;
   c1=-b3;
   c2=(3*(b2+b3));
   c3=-3*(2*b2+b+b3);
   c4=(1+3*b+b3+3*b2);
   r=t3_period;
   if (r<1) r=1;
   r=1 + 0.5*(r-1);
   w1=2/(r + 1);
   w2=1 - w1;
   //
   e1=0;
   e2=0;
   e3=0;
   e4=0;
   e5=0;
   e6=0;
//----
   return(0);
  }
//+------------------------------------------------------------------+
//| Custor indicator deinitialization function                       |
//+------------------------------------------------------------------+
int deinit()
  {
//---- TODO: add your code here
//----
   return(0);
  }
//+------------------------------------------------------------------+
//| Custom indicator iteration function                              |
//+------------------------------------------------------------------+
int start()
  {
   int counted_bars=IndicatorCounted();
   if (counted_bars<0) return(-1);
   if (counted_bars>0) counted_bars--;
   int limit=Bars-counted_bars;
//----
   for(int i=limit; i>=0; i--)
     {
      HighestHighRecent=High[Highest(NULL,0,2,TTFbars,i-TTFbars+1)];
      HighestHighOlder =High[Highest(NULL,0,2,TTFbars,i+1)];
      LowestLowRecent =Low[Lowest(NULL,0,1,TTFbars,i-TTFbars+1)];
      LowestLowOlder =Low[Lowest(NULL,0,1,TTFbars,i+1)];
      BuyPower =HighestHighRecent-LowestLowOlder;
      SellPower=HighestHighOlder -LowestLowRecent;
      TTF=(BuyPower-SellPower)/(0.5*(BuyPower+SellPower))*100;
      //
      e1=w1*TTF + w2*e1;
      e2=w1*e1 + w2*e2;
      e3=w1*e2 + w2*e3;
      e4=w1*e3 + w2*e4;
      e5=w1*e4 + w2*e5;
      e6=w1*e5 + w2*e6;
      //
      TTF=c1*e6 + c2*e5 + c3*e4 + c4*e3;
      //
      if (TTF<=(-100))
        {
         ExtMapBuffer1[i]=High[i]+4*Point;
         ExtMapBuffer2[i]=0;
        }
      if (TTF>=100)
        {
         ExtMapBuffer1[i]=0;
         ExtMapBuffer2[i]=Low[i]-4*Point;
        }
        if (TTF>(-100) && TTF<100)
        {
         ExtMapBuffer1[i]=0;
         ExtMapBuffer2[i]=0;
        }
     }
//----
   return(0);
  }
//+------------------------------------------------------------------+
Comments