TTF - trigger factor_v2
Download script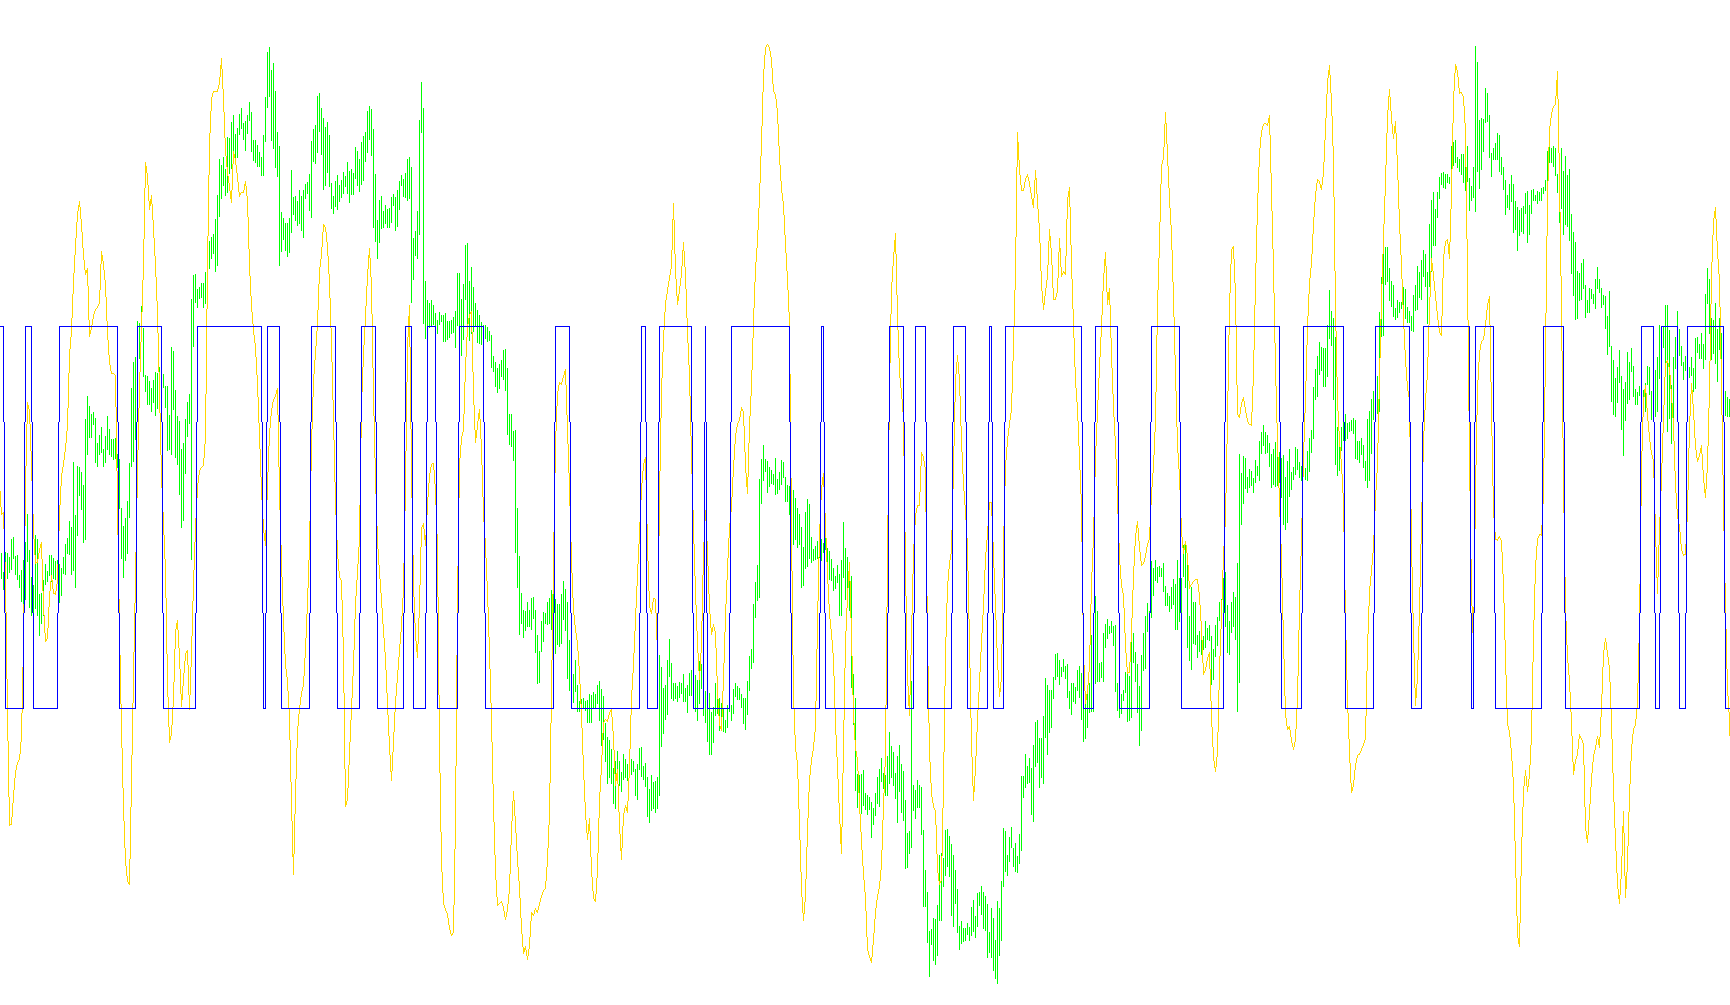
This technical indicator is designed to measure market momentum by comparing the relative "strength" of buying pressure against selling pressure over a specific timeframe. It visualizes these dynamics in a separate window on your trading chart, providing a clearer view of market sentiment than price action alone.
Core Logic and Mechanics
1. Relative Strength Calculation
The indicator begins by analyzing the highest highs and lowest lows within two distinct adjacent windows of time (defined by the TTFbars parameter).
- Buy Power: It calculates the difference between the most recent high and the older low.
- Sell Power: It calculates the difference between the older high and the most recent low.
By comparing these two values, the script produces a percentage-based score. A positive result suggests that buying momentum is currently dominating, while a negative result indicates that selling pressure is prevailing.
2. Smoothing and Stabilization Raw market data can be "noisy," meaning it often moves erratically from one second to the next. To make the data readable and useful for human analysis, the script applies a multi-stage smoothing process.
- It uses an internal calculation—similar to a moving average but more complex in its weighting—to refine the raw "Power" scores.
- This ensures that the resulting line flows smoothly across your screen rather than jumping jaggedly, allowing you to identify sustained trends rather than momentary spikes.
3. Visual Interpretation (The Main Line) The primary line (colored Light Sea Green) represents the processed momentum score. When this line moves upward or stays high, it reflects a dominant bullish environment. When it moves downward or stays low, it reflects a dominant bearish environment.
4. The Signal Mechanism The script also generates a secondary signal line based on a threshold system. Instead of just following the trend, it acts as a binary indicator:
- If the momentum score is positive (above zero), the signal maps to a high point on your indicator window (
TopLine). - If the momentum score falls below zero, the signal drops to a low point (
BottomLine).
Summary for the Trader
Essentially, this tool acts as a "momentum gauge." It looks at how aggressively the price is moving in both directions and filters out the noise to show you who is currently winning the tug-of-war between buyers and sellers. The smooth main line helps you see the current trend direction, while the signal logic provides a clear visual distinction between positive and negative market sentiment.
//+------------------------------------------------------------------+
//|                                                   ttf.mq4        |
//|                      Copyright © 2005, Nick Bilak                |
//|                                                                  |
//+------------------------------------------------------------------+
#property copyright "Copyright © 2005, Nick Bilak"
#property link      "beluck[at]gmail.com"
//----
#property indicator_separate_window
#property indicator_buffers 2
#property indicator_color1 LightSeaGreen
#property indicator_color2 Red
//---- input parameters
extern int TTFbars=8;
//15=default number of bars for computation
extern int TopLine=75;
extern int BottomLine=-75;
extern int t3_period=3;
extern double b=0.7;
//---- buffers
double MainBuffer[];
double SignalBuffer[];
//----
int draw_begin1=0;
int draw_begin2=0;
double b2=0;
double b3=0;
double c1=0;
double c2=0;
double c3=0;
double c4=0;
double r=0;
double w1=0;
double w2=0;
double e1=0;
double e2=0;
double e3=0;
double e4=0;
double e5=0;
double e6=0;
double  HighestHighRecent=0;
double  HighestHighOlder =0;
double  LowestLowRecent =0;
double  LowestLowOlder =0;
double  BuyPower =0;
double  SellPower=0;
double  TTF=0;
//+------------------------------------------------------------------+
//| Custom indicator initialization function                         |
//+------------------------------------------------------------------+
int init()
  {
   string short_name;
//---- 2 additional buffers are used for counting.
   IndicatorBuffers(2);
//---- indicator lines
   SetIndexStyle(0,DRAW_LINE);
   SetIndexBuffer(0, MainBuffer);
   SetIndexStyle(1,DRAW_LINE);
   SetIndexBuffer(1, SignalBuffer);
//---- name for DataWindow and indicator subwindow label
   short_name="TTF("+TTFbars;
   IndicatorShortName(short_name);
   SetIndexLabel(0,short_name);
   SetIndexLabel(1,"Signal");
//----
   draw_begin1=TTFbars*2+1;
   draw_begin2=draw_begin1;
   SetIndexDrawBegin(0,draw_begin1);
   SetIndexDrawBegin(1,draw_begin2);
//----
   b2=b*b;
   b3=b2*b;
   c1=-b3;
   c2=(3*(b2+b3));
   c3=-3*(2*b2+b+b3);
   c4=(1+3*b+b3+3*b2);
   r=t3_period;
//----
   if (r<1) r=1;
   r=1 + 0.5*(r-1);
   w1=2/(r + 1);
   w2=1 - w1;
//----
   return(0);
  }
//+------------------------------------------------------------------+
//| ttf                                                              |
//+------------------------------------------------------------------+
int start()
  {
   int    i,k;
   int    counted_bars=IndicatorCounted();
   double price;
//----
   if(Bars<=draw_begin2) return(0);
//---- initial zero
   if(counted_bars<1)
     {
      for(i=1;i<=draw_begin1;i++) MainBuffer[Bars-i]=0;
      for(i=1;i<=draw_begin2;i++) SignalBuffer[Bars-i]=0;
     }
//---- %K line
   i=Bars-draw_begin1;
   if(counted_bars>draw_begin1) i=Bars-counted_bars-1;
   while(i>=0)
     {
      HighestHighRecent=High[Highest(NULL,0,MODE_HIGH,TTFbars,i)];//High[Highest(MODE_HIGH,shift+TTFbars-1,TTFbars)];
      HighestHighOlder =High[Highest(NULL,0,MODE_HIGH,TTFbars,i+TTFbars)];//High[Highest(MODE_HIGH,shift+TTFbars*2-1,TTFbars)];
      LowestLowRecent =Low[Lowest(NULL,0,MODE_LOW,TTFbars,i)];//Low [Lowest (MODE_LOW ,shift+TTFbars-1,TTFbars)];
      LowestLowOlder =Low[Lowest(NULL,0,MODE_LOW,TTFbars,i+TTFbars)];//Low [Lowest (MODE_LOW ,shift+TTFbars*2-1,TTFbars)];
      BuyPower =HighestHighRecent-LowestLowOlder;
      SellPower=HighestHighOlder -LowestLowRecent;
      TTF=(BuyPower-SellPower)/(0.5*(BuyPower+SellPower))*100;
//----
      e1=w1*TTF + w2*e1;
      e2=w1*e1 + w2*e2;
      e3=w1*e2 + w2*e3;
      e4=w1*e3 + w2*e4;
      e5=w1*e4 + w2*e5;
      e6=w1*e5 + w2*e6;
//----
      TTF=c1*e6 + c2*e5 + c3*e4 + c4*e3;
      MainBuffer[i]=TTF;
      i--;
     }
//---- last counted bar will be recounted
   if(counted_bars>0) counted_bars--;
   int limit=Bars-counted_bars;
//---- signal line is simple movimg average
     for(i=0; i<limit; i++)
     {
      if (MainBuffer[i]>=0)
         SignalBuffer[i]=TopLine;
      else
         SignalBuffer[i]=BottomLine;
     }
//----
   return(0);
  }
//+------------------------------------------------------------------+
Comments