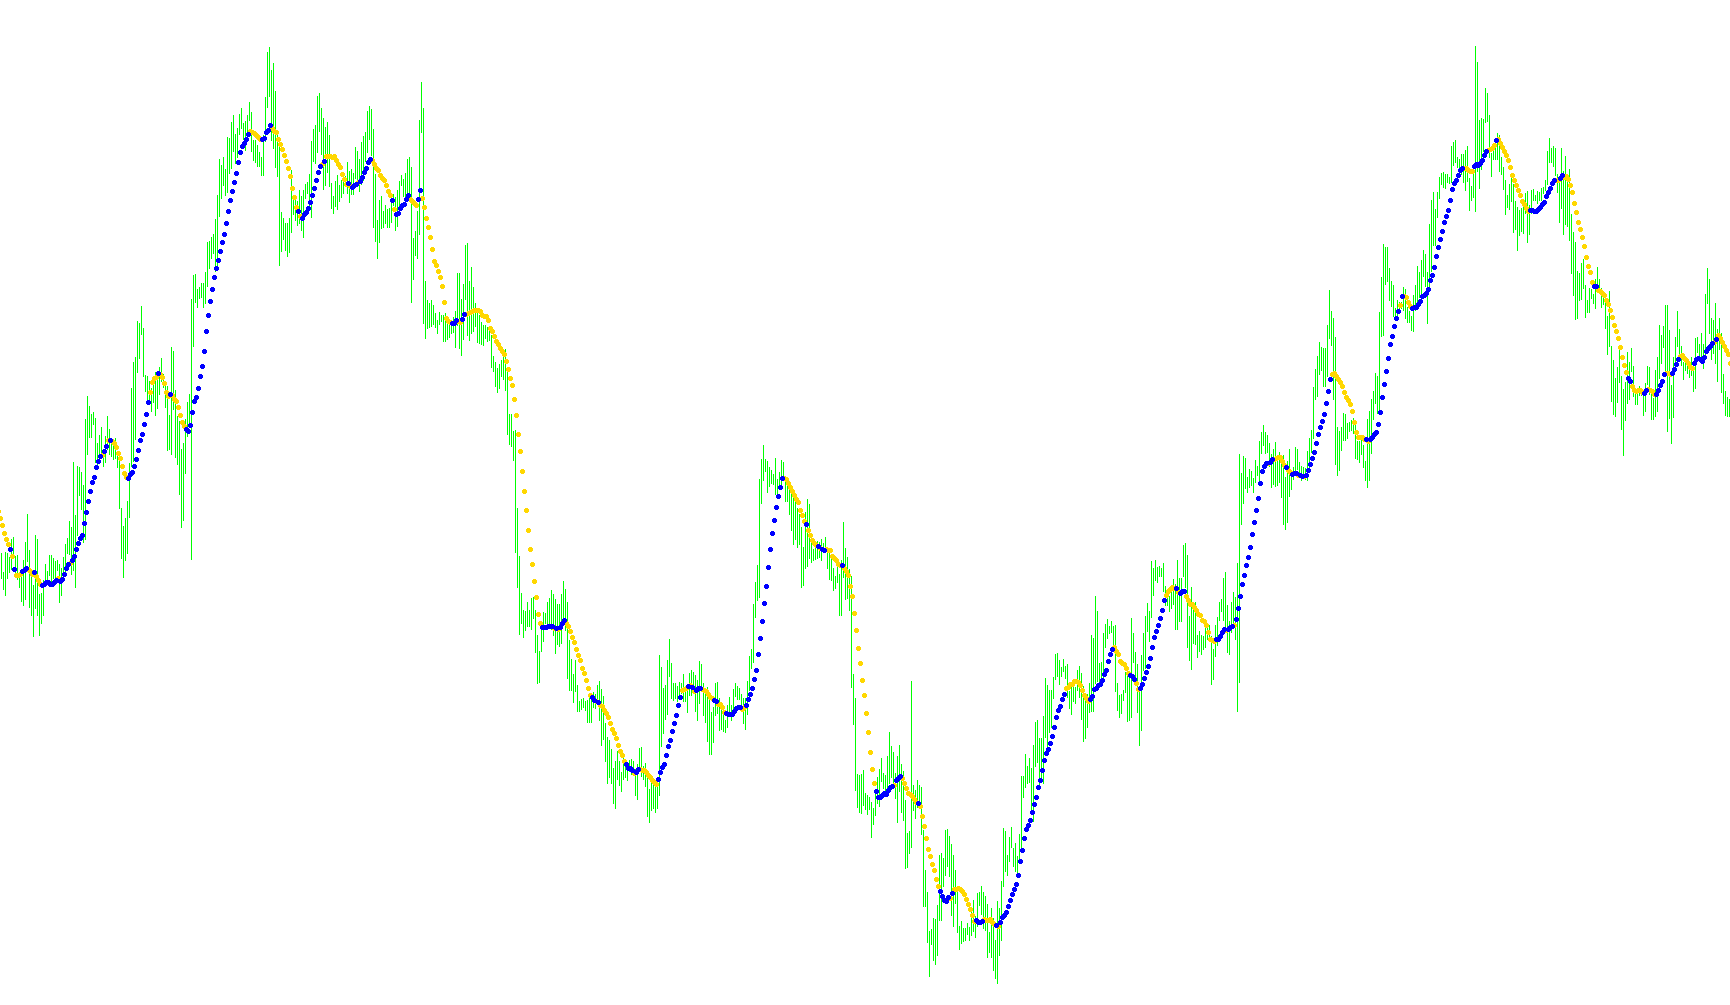
Test of History file
Indicator

Test of History file

This script iteratively retrieves and prints the open, high, low, close, and volume values of the five most recent one-minute candlesticks.

test1
Indicator

test1

This indicator detects structural shifts by identifying the specific point where a rolling average transitions from a declining to an ascending trajectory, marking trend inflection points with visual signals.

test1_v1
Indicator

test1_v1

This indicator identifies trend momentum by comparing the relative weights of leading and trailing price averages to plot directional transition markers.

Test2guns
Indicator

Test2guns

This indicator aggregates high-period momentum data by mapping nested custom calculations from larger timeframes onto the current chart for trend visualization.

Test2guns_v1
Indicator

Test2guns_v1

This indicator synchronizes and overlays two distinct MRO data streams from higher timeframes onto the current chart using a proportional bigshift calculation.

test2_v1
Indicator

test2_v1

This indicator identifies trend reversals by detecting structural changes in moving average trajectories relative to specific price volatility thresholds.

test2_v2
Indicator

test2_v2

This indicator identifies trend shifts by comparing moving average slope reversals against a price volatility threshold to filter out minor market noise.

test3
Indicator

test3

The logic identifies price action pivots by detecting candles where the real body size exceeds a specific volatility threshold to mark significant directional momentum.

test3_v1
Indicator

test3_v1

Identifies specific price action bars where the distance between opening and closing prices exceeds a predefined volatility threshold.

test4_show5ticks
Indicator

test4_show5ticks

Identifies trend reversals by detecting specific volatility thresholds in the variance of the Typical Price calculation.

test4_show5ticks_v1
Indicator

test4_show5ticks_v1

This indicator identifies directional momentum by detecting significant fluctuations in the Typical Price (High+Low+Close)/3 calculation across historical price action.

test5_show5ticks
Indicator

test5_show5ticks

The indicator identifies directional shifts by monitoring price fluctuations in the Typical Price calculation to trigger visual reversal alerts.

test5_show5ticks_v1
Indicator

test5_show5ticks_v1

Identifies directional shifts by detecting specific price fluctuations in the Typical Price (High, Low, Close) average over a sliding historical window.

Indicator

TestWilliam36HistogramWalert

TestWilliam36HistogramWalert_v1
Indicator

TestWilliam36HistogramWalert_v1

This indicator identifies momentum shifts by isolating positive and negative components of a 40-period Williams Range calculation to trigger reversal alerts.

Indicator

TestWilliam36HistogramWalert_v2

test_3expert
Indicator

test_3expert

Identifies market direction by detecting three consecutive shifts in the arithmetic average of price action components.

test_5close_up
Indicator

test_5close_up

This indicator identifies significant price momentum shifts by detecting cumulative typical price gaps over a three-period window and consecutive six-period directional trends.

test_5close_up_v31
Indicator

test_5close_up_v31

The indicator detects continuous five-bar linear progressions in the typical price calculation to identify sustained momentum shifts.

test_5F3expert
Indicator

test_5F3expert

The indicator identifies trend reversals by detecting sequential shifts in the weighted average of high, low, and closing prices across three consecutive candles.

test_5F5close_up
Indicator

test_5F5close_up

Identifies directional price shifts by analyzing cumulative deviations in six-period typical price averages against a user-defined volatility threshold.

test_5F5close_up_v31
Indicator

test_5F5close_up_v31

Identifies continuous five-period ascending or descending movements of the typical price average to signal structural momentum shifts.

test_5typ_up
Indicator

test_5typ_up

This indicator identifies directional trends by detecting continuous six-period ascending or descending sequences of typical price averages combined with specific cumulative displacement thresholds.

test_5typ_up_v1
Indicator

test_5typ_up_v1

This indicator identifies momentum shifts by detecting consecutive six-period monotonic sequences in typical price while filtering for specific cumulative volatility gaps.

Indicator

Test_dlnn

test_FATL
Indicator

test_FATL

This indicator identifies trend reversals by calculating a specific 39-period weighted linear regression of closing prices and detecting shifts in momentum direction.

test_FATL_v1
Indicator

test_FATL_v1

The indicator identifies trend reversal points by detecting momentum flips derived from a weighted linear combination of the last 39 closing prices.

test_objects_list
Indicator

test_objects_list

This script systematically exports an inventory of all visual chart objects, including their anchor timestamps, unique identifiers, and descriptive metadata into a CSV file.

Indicator

TEST_Probability

test_showNticks
Indicator

test_showNticks

The indicator identifies momentum shifts by detecting when the rate of change in Typical Price exceeds a user-defined volatility threshold.

test_showNticks_v1
Indicator

test_showNticks_v1

This indicator identifies directional shifts by detecting price movements that exceed a specific threshold relative to the typical price average.

Test_StochHisto
Indicator

Test_StochHisto

This script extracts and displays real-time numerical data from multiple buffers of a custom Stochastic Histogram indicator onto the chart comments.

test_volume
Indicator

test_volume

This indicator projects historical volume data into a discrete 20% sampling interval to visualize periodic liquidity distribution.

test_volumeMA
Indicator

test_volumeMA

This indicator visually categorizes real-time volume shifts into directional histograms while overlaying a simple moving average to identify sustained liquidity trends.

test_volume_v1
Indicator

test_volume_v1

This indicator visualizes historical trading activity by plotting raw volume data into a separate histogram window to identify liquidity shifts.

TFT_Colour
Indicator

TFT_Colour

iMA

This indicator dynamically identifies trend direction by comparing closing prices against shifted SMA boundaries of high and low extremes to switch between bullish and bearish envelopes.

TG-Sinc-Spectrum-Cycle
Indicator

TG-Sinc-Spectrum-Cycle

iStochastic

This indicator applies a digital SINC filter to Stochastic Oscillator data to extract underlying cycles and project bias through logarithmic normalization.

The 20's Indicator [i]
Indicator

The 20's Indicator [i]

This indicator identifies trend reversals and continuation points by detecting specific price action extremes within a bar's range or identifying inside bar patterns relative to preceding volatility.

The-Wave
Indicator

The-Wave

iMA

This indicator synthesizes three concurrent moving averages based on high, close, and low prices to delineate the active price corridor.

TheTick
Indicator

TheTick

This indicator quantifies the magnitude of price movement by multiplying the real body range of a candle by its relative trading volume.

THMA
Indicator

THMA

iMAiMAOnArray

This algorithm calculates a high-velocity trend line by applying a weighted linear moving average to the difference between two scaled linear moving averages.

THMA_v1
Indicator

THMA_v1

iMAiMAOnArray

This indicator calculates a smoothed price trajectory by applying a weighted linear moving average to the variance of half-period movements, aiming to eliminate lag while maintaining high sensitivity.

Thread_Hist_1
Indicator

Thread_Hist_1

iStochastic

This indicator quantifies market volatility and momentum synchronization by calculating the spread between the maximum and minimum values of multiple stochastic oscillators across varying timeframes.

Three Day Rolling Pivot
Indicator

Three Day Rolling Pivot

This indicator calculates and projects a dynamic pivot point system based on the high, low, and closing prices of a specific three-day rolling window.

Three Day Rolling Pivot_v1
Indicator

Three Day Rolling Pivot_v1

This indicator calculates a central pivot point and symmetrical volatility boundaries based on the high, low, and closing prices of a specific multi-day temporal window.

Three Line Break
Indicator

Three Line Break

This indicator identifies structural trend reversals by tracking price breaches of rolling volatility boxes and visualizes the resulting momentum shifts.

Three Line Break_v1
Indicator

Three Line Break_v1

This indicator identifies structural market shifts by tracking consecutive price boundary breaches and mapping high-low extremes of trend-reversal segments.

Three Line Break_v2
Indicator

Three Line Break_v2

This indicator identifies structural trend shifts by monitoring price breaches of historical high-low boundary boxes established during specific directional movements.

ThreePoleButterworthFilter
Indicator

ThreePoleButterworthFilter

This indicator applies a three-pole Butterworth mathematical filter to the median price to isolate underlying trends by suppressing high-frequency noise and market jitter.

ThreePoleSuperSmootherFilter
Indicator

ThreePoleSuperSmootherFilter

This indicator utilizes a sophisticated cybernetic filter to eliminate market noise and extract primary price trends through high-order recursive smoothing of the median price.