Three Line Break_v1
Download script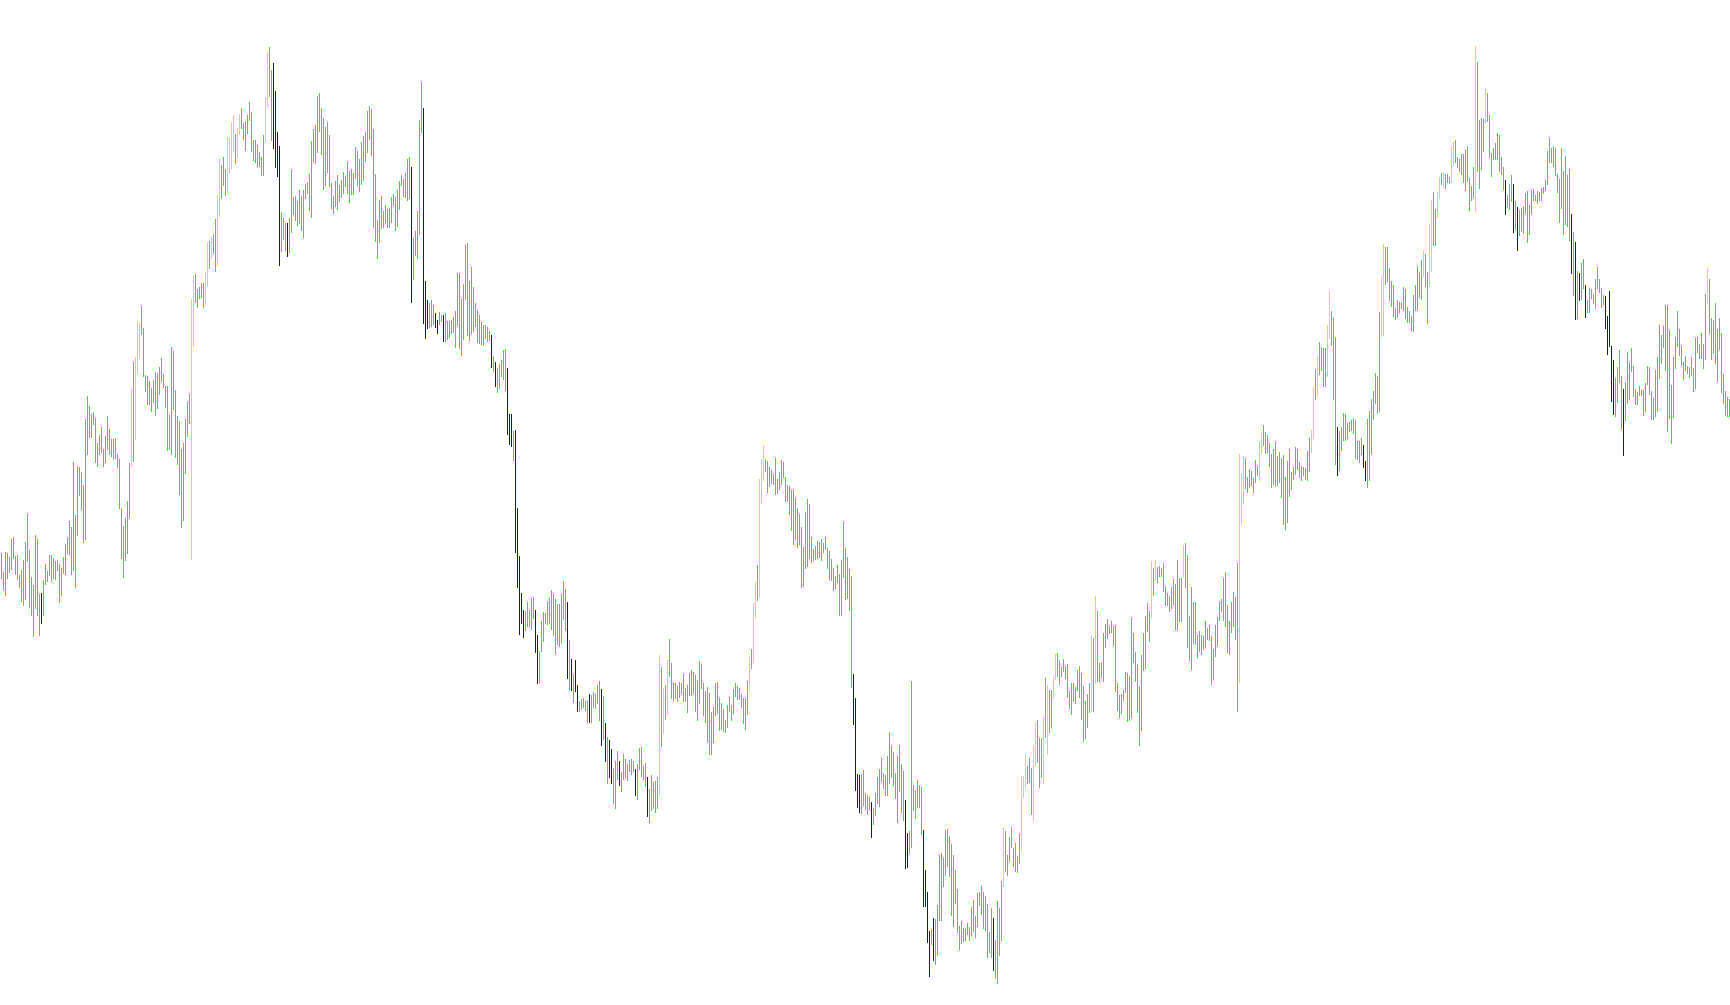
This tool is designed to identify and visualize significant shifts in market momentum by tracking specific price "breakouts." Instead of simply looking at every minor price fluctuation, it focuses on whether the market is breaking out of a defined historical range to establish a new trend.
How the Logic Works
The script monitors price action to determine if the market is moving upward (bullish) or downward (bearish). It does this by observing the relationship between opening and closing prices over a specific window of time, which you can customize using the "BreakPeriod" setting.
1. Defining the Range The tool maintains a memory of recent price highs and lows. By looking at a set number of previous candles (the BreakPeriod), it establishes a "box"—a boundary of price action that the market has recently stayed within.
2. Detecting the Breakout The core logic waits for a specific event:
- Bearish Shift: If the market was previously moving up but the current price closes below the bottom of that established range, the script recognizes a shift in momentum to the downside.
- Bullish Shift: If the market was previously moving down but the current price closes above the top of that established range, it recognizes a shift in momentum to the upside.
3. Updating the Trend Once a breakout occurs, the tool "resets." It acknowledges the new trend direction and shifts its memory to include the most recent price action as the new boundary. This creates a continuous cycle where the script is always looking for the next significant break from the current established range.
Visual Representation
On your chart, the logic translates into a dual-color histogram:
- One color represents the primary high/low points of the trend.
- The other color represents the opposing boundary.
By watching these visual markers, you can see exactly where the market has confirmed a shift in direction relative to recent price history, helping to filter out minor "noise" and focus on substantial movements.
/*-----------------------------+
|			       |
| Shared by www.Aptrafx.com    |
|			       |
+------------------------------*/

//+------------------------------------------------------------------+
//|                                             Three Line Break.mq4 |
//|                                                     Equipe Forex |
//|                                       http://www.equipeforex.com |
//+------------------------------------------------------------------+
#property copyright "Equipe Forex"
#property link      "http://www.equipeforex.com"

#property indicator_chart_window
#property indicator_buffers 2
#property indicator_color1 Blue
#property indicator_color2 Red
//---- input parameters
extern int       BreakPeriod=5;
//---- buffers
double ExtMapBuffer1[];
double ExtMapBuffer2[];
//+------------------------------------------------------------------+
//| Custom indicator initialization function                         |
//+------------------------------------------------------------------+
int init()
  {
//---- indicators
   SetIndexStyle(0,DRAW_HISTOGRAM);
   SetIndexBuffer(0,ExtMapBuffer1);
   SetIndexStyle(1,DRAW_HISTOGRAM);
   SetIndexBuffer(1,ExtMapBuffer2);
//----
   return(0);
  }
//+------------------------------------------------------------------+
//| Custor indicator deinitialization function                       |
//+------------------------------------------------------------------+
int deinit()
  {
//----

//----
   return(0);
  }
//+------------------------------------------------------------------+
//| Custom indicator iteration function                              |
//+------------------------------------------------------------------+
int start()
  {
   int i, j, CurrentTrend;
   bool CalculateLowHigh = true;
   double Value1, Value2, LowestBox, HighestBox;
   double BoxHigh[], BoxLow[];

   ArrayResize(BoxHigh, BreakPeriod + 2);
   ArrayResize(BoxLow, BreakPeriod + 2);

   ArrayInitialize(BoxHigh, -1000);
   ArrayInitialize(BoxLow, 1000);

   i=Bars-1;

   if (Close[i] < Open[i]) {
      CurrentTrend = -1;
      BoxHigh[BreakPeriod + 1] = Open[i];
      BoxLow[BreakPeriod + 1] = Close[i];
      Value1 = Low[i];
      Value2 = High[i];
   } else {
      CurrentTrend = 1;
      BoxHigh[BreakPeriod + 1] = Close[i];
      BoxLow[BreakPeriod + 1] = Open[i];
      Value1 = High[i];
      Value2 = Low[i];
   }

   ExtMapBuffer1[i] = Value1;
   ExtMapBuffer2[i] = Value2;

   i--;

   while (i>=0) {
      Value1 = 0;
      Value2 = 0;

      if (CalculateLowHigh) {
	      LowestBox = BoxLow[ArrayMinimum(BoxLow)];
	      HighestBox = BoxHigh[ArrayMaximum(BoxHigh)];
	      CalculateLowHigh = false;
      }

      if (((CurrentTrend > 0) && (Close[i] < LowestBox)) ||
	      (CurrentTrend < 0) && (Close[i] < BoxLow[BreakPeriod + 1])) {
         Value1 = Low[i];
	      Value2 = High[i];

	      shiftArrays(BoxLow, BoxHigh);

	      BoxHigh[BreakPeriod + 1] = BoxLow[BreakPeriod + 1];
         BoxLow[BreakPeriod + 1] = Close[i];

         CurrentTrend = -1;
         CalculateLowHigh = true;
      } else if (((CurrentTrend < 0) && (Close[i] > HighestBox)) ||
			       (CurrentTrend > 0) && (Close[i] > BoxHigh[BreakPeriod + 1])) {
         Value1 = High[i];
	      Value2 = Low[i];

	      shiftArrays(BoxLow, BoxHigh);

         BoxLow[BreakPeriod + 1] = BoxHigh[BreakPeriod + 1];
         BoxHigh[BreakPeriod + 1] = Close[i];

         CurrentTrend = 1;
         CalculateLowHigh = true;
      }

      ExtMapBuffer1[i] = Value1;
      ExtMapBuffer2[i] = Value2;
      i--;
  }
//----
   return(0);
  }
//+------------------------------------------------------------------+
//| shift array function                              |
//+------------------------------------------------------------------+
  void shiftArrays(double& array1[], double& array2[]) {
      for (int j = 0; j <= BreakPeriod; j++) {
         array1[j] = array1[j + 1];
		   array2[j] = array2[j + 1];
	  }
  }
//+------------------------------------------------------------------+
Comments