TMLM-Channel-v1
Indicator

TMLM-Channel-v1

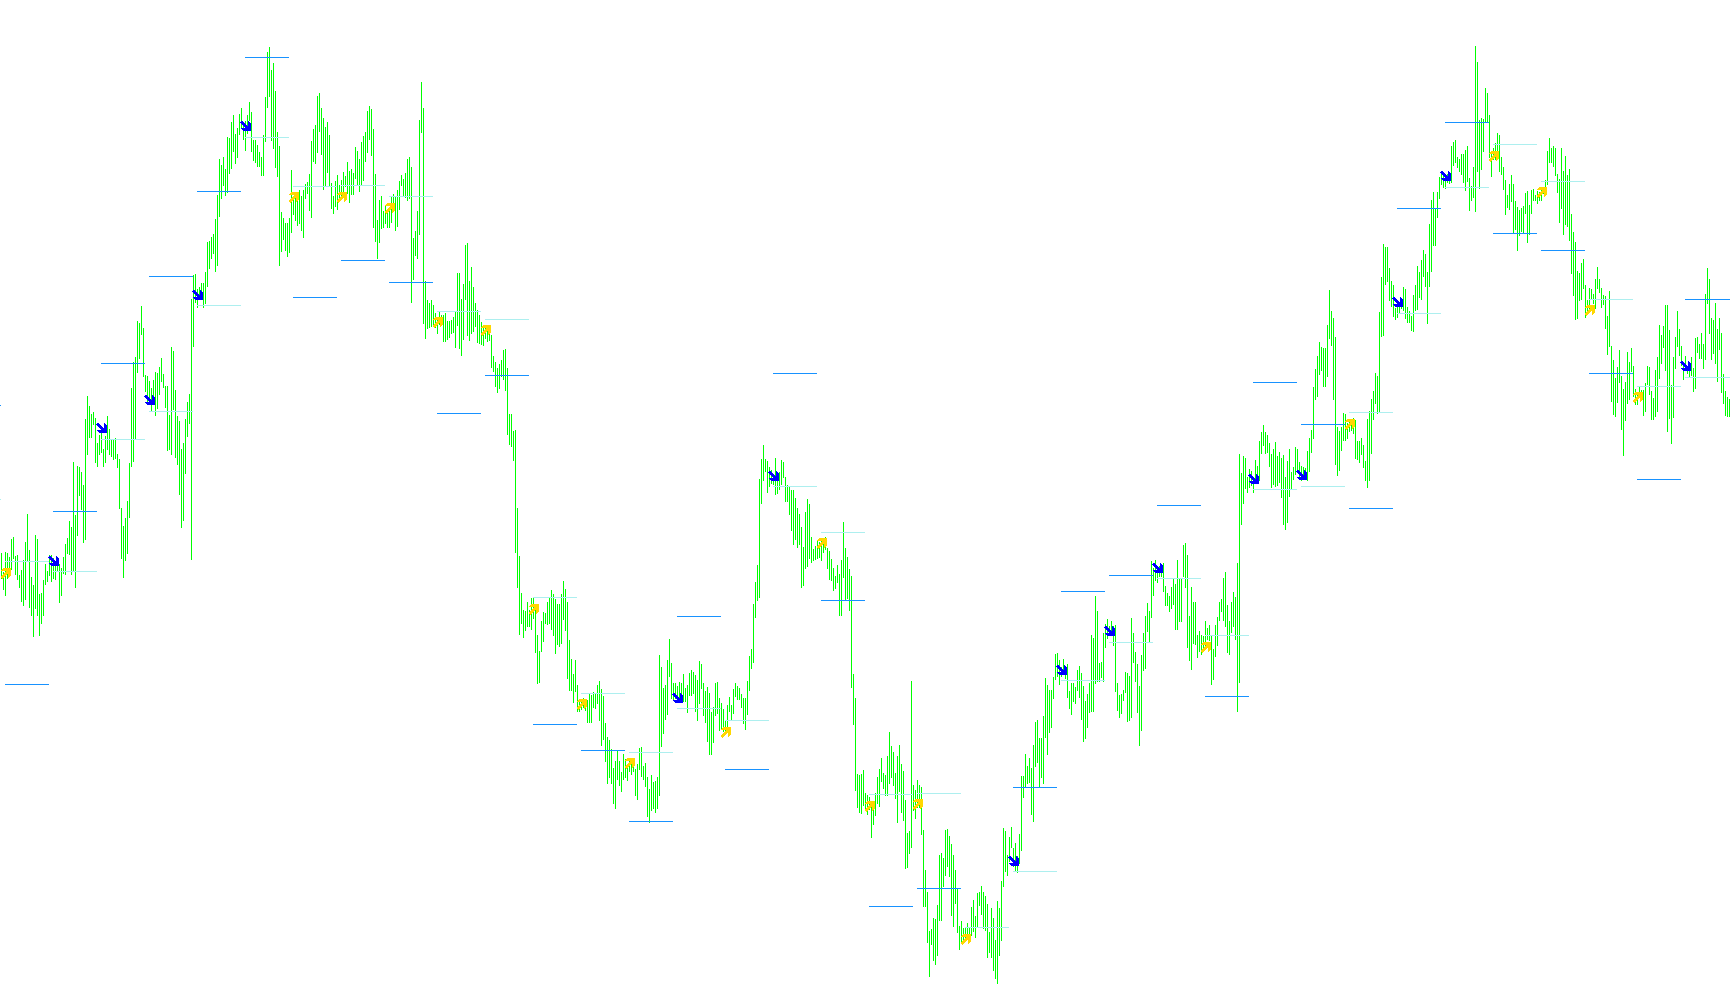
This indicator projects a three-line parallel corridor based on linear regression analysis to identify trend boundaries and detect overextended price action for potential reversal entries.

TMLM-Channel-v2.1
Indicator

TMLM-Channel-v2.1

This indicator dynamically projects trend boundaries by calculating the linear regression of price action anchored to identified fractal highs and lows.

TMLM-Channel-v2.2
Indicator

TMLM-Channel-v2.2

iMA

This indicator utilizes fractal high-low identification to construct multi-timeframe trend channels, providing dynamic price corridor visualizations and volatility-adjusted stop-loss calculations.

TMLM-Channel-v2
Indicator

TMLM-Channel-v2

This indicator identifies structural trend channels by plotting linear regression paths and dynamic support/resistance boundaries based on fractal high and low pivots.

Today Trend last
Indicator

Today Trend last

This indicator identifies potential trade entries by calculating three distinct action tiers based on the previous day's price range, pivot centers, and specific resistance/support boundaries to determine optimal long and short signals at the market open.

Today Trend last_v1
Indicator

Today Trend last_v1

The indicator identifies intraday trade entries by calculating dynamic support and resistance levels based on previous daily price action, then mapping multi-tiered reversal rates and profit targets.

Today Trend
Indicator

Today Trend

This indicator identifies intraday directional biases by calculating pivot price zones based on the previous day's high and low range to trigger specific buy and sell signals at the session open.

Today Trend_v1
Indicator

Today Trend_v1

The logic identifies intraday bias by mapping the previous day's high and low into a five-point pivot structure to determine directional entries and dynamic reversal levels at the market open.

TodayHighLow
Indicator

TodayHighLow

Identifies and plots the absolute daily price extremes by mapping multi-timeframe session high and low data onto the current chart.

Today_Trend_last
Indicator

Today_Trend_last

This indicator identifies daily trend directions by calculating geometric pivot points from previous daily price action to generate specific entry signals, profit targets, and reversal levels.

Tommytrend Pivot
Indicator

Tommytrend Pivot

This indicator calculates daily pivot levels and multiple support/resistance boundaries based on the previous trading session's price range and closing values.

TOPTREND
Indicator

TOPTREND

iBands

This indicator identifies trend reversals and dynamic exit points by calculating a non-repainting trailing stop based on Bollinger Band extremes and adjusted risk volatility.

TorR.11
Indicator

TorR.11

iADX

This indicator evaluates market dynamics across multiple timeframes by analyzing ADX thresholds and directional index velocity to distinguish between active trends and consolidative ranges.

ToR_1.02
Indicator

ToR_1.02

iADX

This indicator visualizes real-time trend strength and direction across multiple timeframes simultaneously using ADX thresholds to differentiate between active momentum and stagnant consolidation.

ToR_1.10
Indicator

ToR_1.10

iADX

This indicator analyzes Average Directional Index (ADX) values across five distinct timeframes to distinguish between trending and ranging market states, utilizing visual cues for momentum strength and directional bias.

ToR_1.12
Indicator

ToR_1.12

iADX

This indicator evaluates market dynamics across multiple timeframes by calculating ADX levels and DI crossovers to distinguish between ranging, strengthening, and weakening trends.

ToR_1.20
Indicator

ToR_1.20

iCCIiADX

This indicator simultaneously analyzes ADX and CCI across multiple timeframes to distinguish between high-momentum trends and low-volatility ranging environments.

ToR_1.20_v1
Indicator

ToR_1.20_v1

iCCIiADX

This indicator synchronizes ADX and CCI data across multiple timeframes to visualize real-time market regime shifts between trending momentum and ranging consolidation.

ToR_1[1].02
Indicator

ToR_1[1].02

iADX

This indicator synthesizes multi-timeframe ADX values and directional indicators to visually distinguish between trending momentum, ranging consolidation, and potential trend reversals.

ToR_1[2].02
Indicator

ToR_1[2].02

iADX

This indicator synthesizes ADX values across multiple temporalities to distinguish between high-velocity trending phases and low-momentum consolidation zones.

ToR_1[3].02
Indicator

ToR_1[3].02

iADX

This indicator evaluates market dynamics by synchronizing ADX strength and directional indicators across multiple timeframes to distinguish between trending, ranging, and transitional price states.

ToR_1[3].03
Indicator

ToR_1[3].03

iADX

This indicator evaluates market structure by monitoring ADX strength across various timeframes to distinguish between active trending momentum and sideways ranging behavior.

ToR_1[3][1].03
Indicator

ToR_1[3][1].03

iADX

This indicator synthesizes ADX values across six concurrent timeframes to visually distinguish between high-momentum trends, directional shifts, and sideways price consolidation.

to_ind_Acceleration_Bands
Indicator

to_ind_Acceleration_Bands

iMAOnArray

This indicator calculates dynamic upper and lower boundaries by weighting price expansion relative to the median midpoint and smoothing the resulting variance through moving averages.

to_ind_Adjustable_Trading_Bands
Indicator

to_ind_Adjustable_Trading_Bands

iATR

This indicator constructs a multi-layered volatility band by projecting ATR-adjusted price extremes onto a smoothed historical window to identify significant trend boundaries.

to_ind_Better_Bollinger_Bands
Indicator

to_ind_Better_Bollinger_Bands

iMA

This indicator utilizes a dual-layered recursive smoothing algorithm to calculate dynamic volatility bands based on the absolute deviation of price from a weighted moving average.

to_ind_CandlCode_ICS
Indicator

to_ind_CandlCode_ICS

iMAOnArray

This indicator quantifies candlestick morphology by synthesizing body size, upper/lower shadow proportions, and relative volatility boundaries using dynamic Bollinger Band thresholds.

TP_ChannelWidth
Indicator

TP_ChannelWidth

This indicator quantifies price expansion by calculating the distance between period extremes and visualizing directional momentum via high-low amplitude distribution.

TP_HeikenAshi
Indicator

TP_HeikenAshi

This indicator calculates a smoothed price action visualization by averaging the open prices of the previous four bars to determine trend momentum and candle body dynamics.

TP_SAR_Colored_Arrows
Indicator

TP_SAR_Colored_Arrows

iSAR

Identifies trend reversals by detecting price crossovers relative to the Parabolic SAR volatility boundary.

Trace_History
Indicator

Trace_History

This indicator parses external CSV datasets to visually map high-impact economic milestones and currency-specific volatility events onto historical price charts.

TrackTrend_MACD
Indicator

TrackTrend_MACD

iMACD

This indicator aggregates and displays the real-time directional momentum of the Moving Average Convergence Divergence across multiple concurrent timeframes in a single on-chart summary.

TrackTrend_MACD_Color
Indicator

TrackTrend_MACD_Color

iMACDiADXiRSI

This indicator synchronizes and visualizes real-time trend orientation across multiple timeframes by evaluating MACD main and signal line momentum shifts.

Trade What You See
Indicator

Trade What You See

This indicator identifies directional momentum by comparing current price action against a calculated percentage-based retracement of the highest highs and lowest lows within a rolling period.

tradechannel
Indicator

tradechannel

This indicator identifies dynamic support and resistance boundaries by detecting recursive fractal extrema and projecting segmented Fibonacci projection zones.

TradeHedgeCLOSEALL_v5
Indicator

TradeHedgeCLOSEALL_v5

Iterates through all active market orders to identify specific magic numbers and execute recursive closing attempts with retry logic.

TradeHedgeDISPLAY_v2
Indicator

TradeHedgeDISPLAY_v2

This indicator aggregates the real-time net profit of all open positions matching a specific magic number and displays the running balance as a dynamic text label on the current chart bar.

TradePrice-T03
Indicator

TradePrice-T03

This indicator calculates a double-smoothed triple exponential moving average on both high and low prices to generate dynamically converging boundary lines.

Indicator

Trader Dash Board

iMA
Traders Dynamic Index VISUAL ALERTS
Indicator

Traders Dynamic Index VISUAL ALERTS

iMAOnArrayiRSI

This hybrid indicator synchronizes RSI price action with standard deviation bands to identify trend velocity, market strength, and breakout potential through multi-layered signal crossover logic.

Traders Dynamic Index Visual Alerts_v2
Indicator

Traders Dynamic Index Visual Alerts_v2

iMAOnArrayiRSI

This hybrid indicator synthesizes RSI-based price action with dynamic standard deviation bands to simultaneously map trend direction, market strength, and volatility contraction.

Traders_Dynamic_Index
Indicator

Traders_Dynamic_Index

iMAOnArrayiRSI

A multi-layered hybrid indicator that synthesizes RSI momentum, standard deviation-based volatility bands, and moving average crossovers to identify trend strength and structural reversals.

Traders_Dynamic_Index_001
Indicator

Traders_Dynamic_Index_001

iMAOnArrayiRSI

This indicator synthesizes RSI price action, dual moving average crossovers, and Fibonacci-weighted standard deviation bands to provide a multi-layered view of trend trajectory, market velocity, and compression zones.

Indicator

Traders_Dynamic_Index_TDI_With_Alerts_TH

iMAOnArrayiRSI
Traders_Dynamic_Index_v2
Indicator

Traders_Dynamic_Index_v2

iMAOnArrayiRSI

A hybrid technical indicator that synchronizes RSI price action, smoothed signal crossovers, and Fibonacci-based volatility bands to identify trend strength and market expansion.

Traders_Dynamic_Index_Visual_Alerts_sound
Indicator

Traders_Dynamic_Index_Visual_Alerts_sound

iMAOnArrayiRSI

This multi-layered oscillator synthesizes RSI price action with standard deviation bands and moving averages to decode instantaneous momentum, structural trend shifts, and compression-based volatility cycles.

TraderWawasan Indi Rantai~
Indicator

TraderWawasan Indi Rantai~

This indicator identifies trend reversal points by synchronizing price action against multi-period ZigZag peak and trough coordinates.

TradeSig
Indicator

TradeSig

iMA

This indicator visualizes the divergence between a standard simple moving average and an offset version to identify momentum shifts.

TradeSig_v2
Indicator

TradeSig_v2

iMA

This indicator quantifies the directional momentum by calculating the discrete difference between two shifted Simple Moving Averages based on typical price values.

TradeSig_v5
Indicator

TradeSig_v5

iMA

This indicator calculates a multi-stage smoothed exponential moving average derivative to identify price momentum shifts relative to a delayed trend baseline.