Three_Color
Indicator

Three_Color

iMA

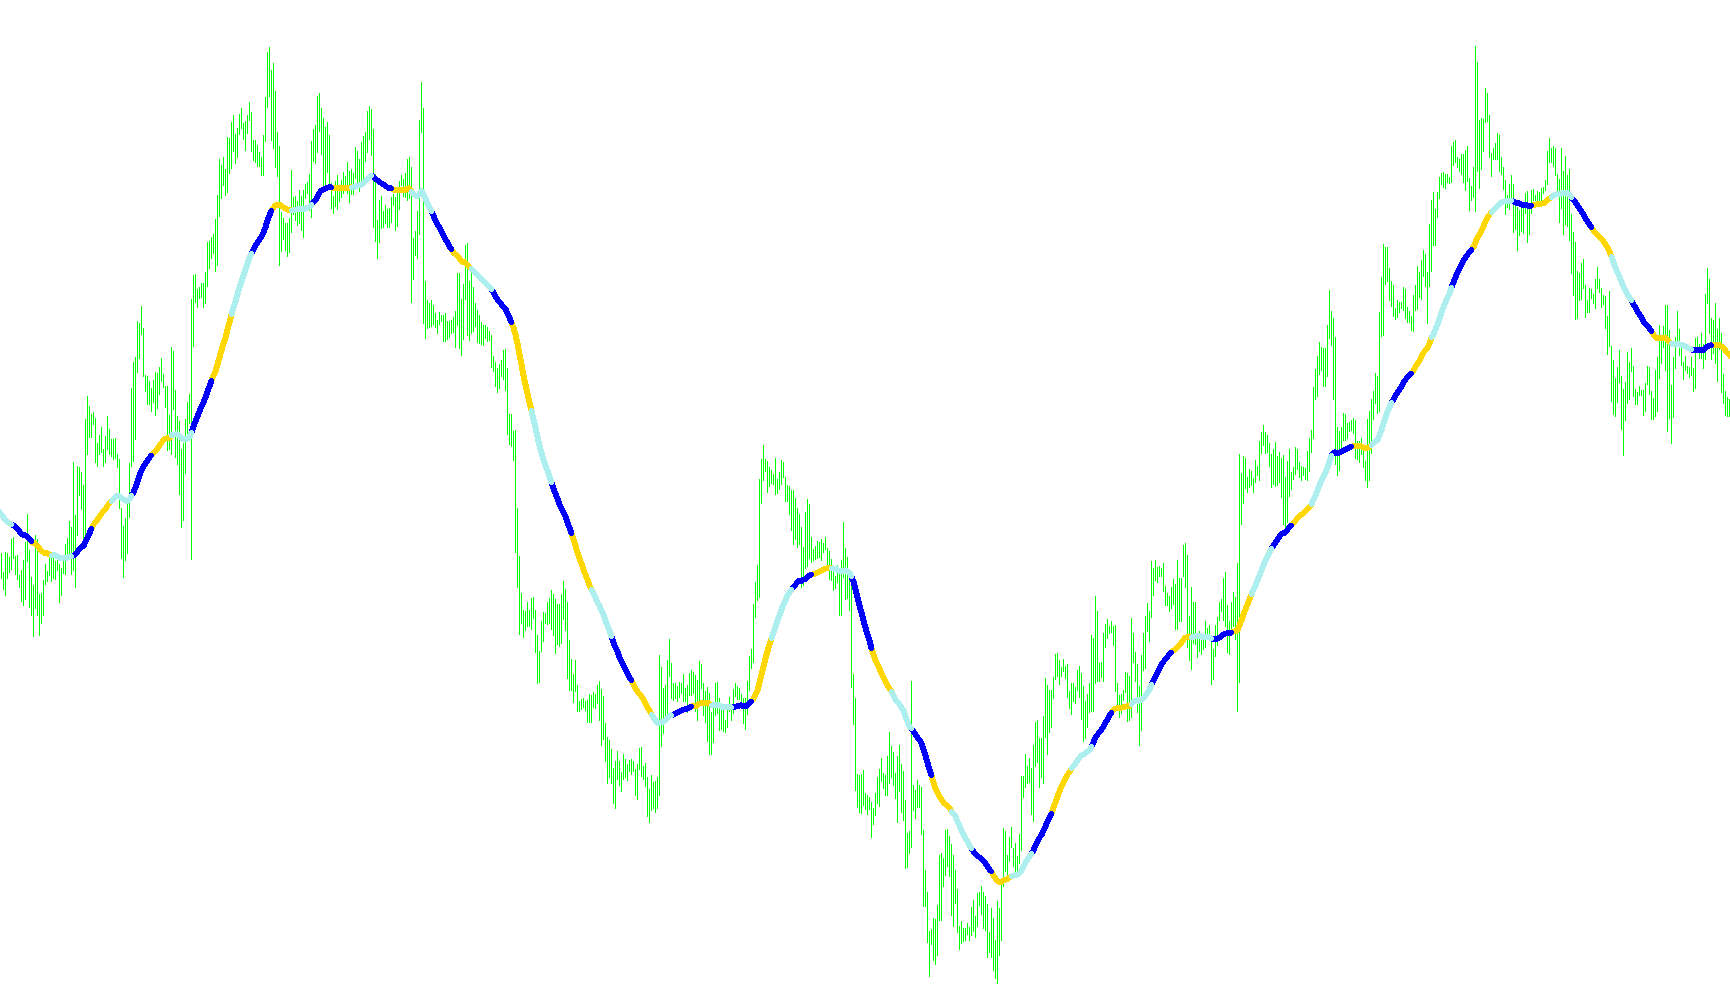
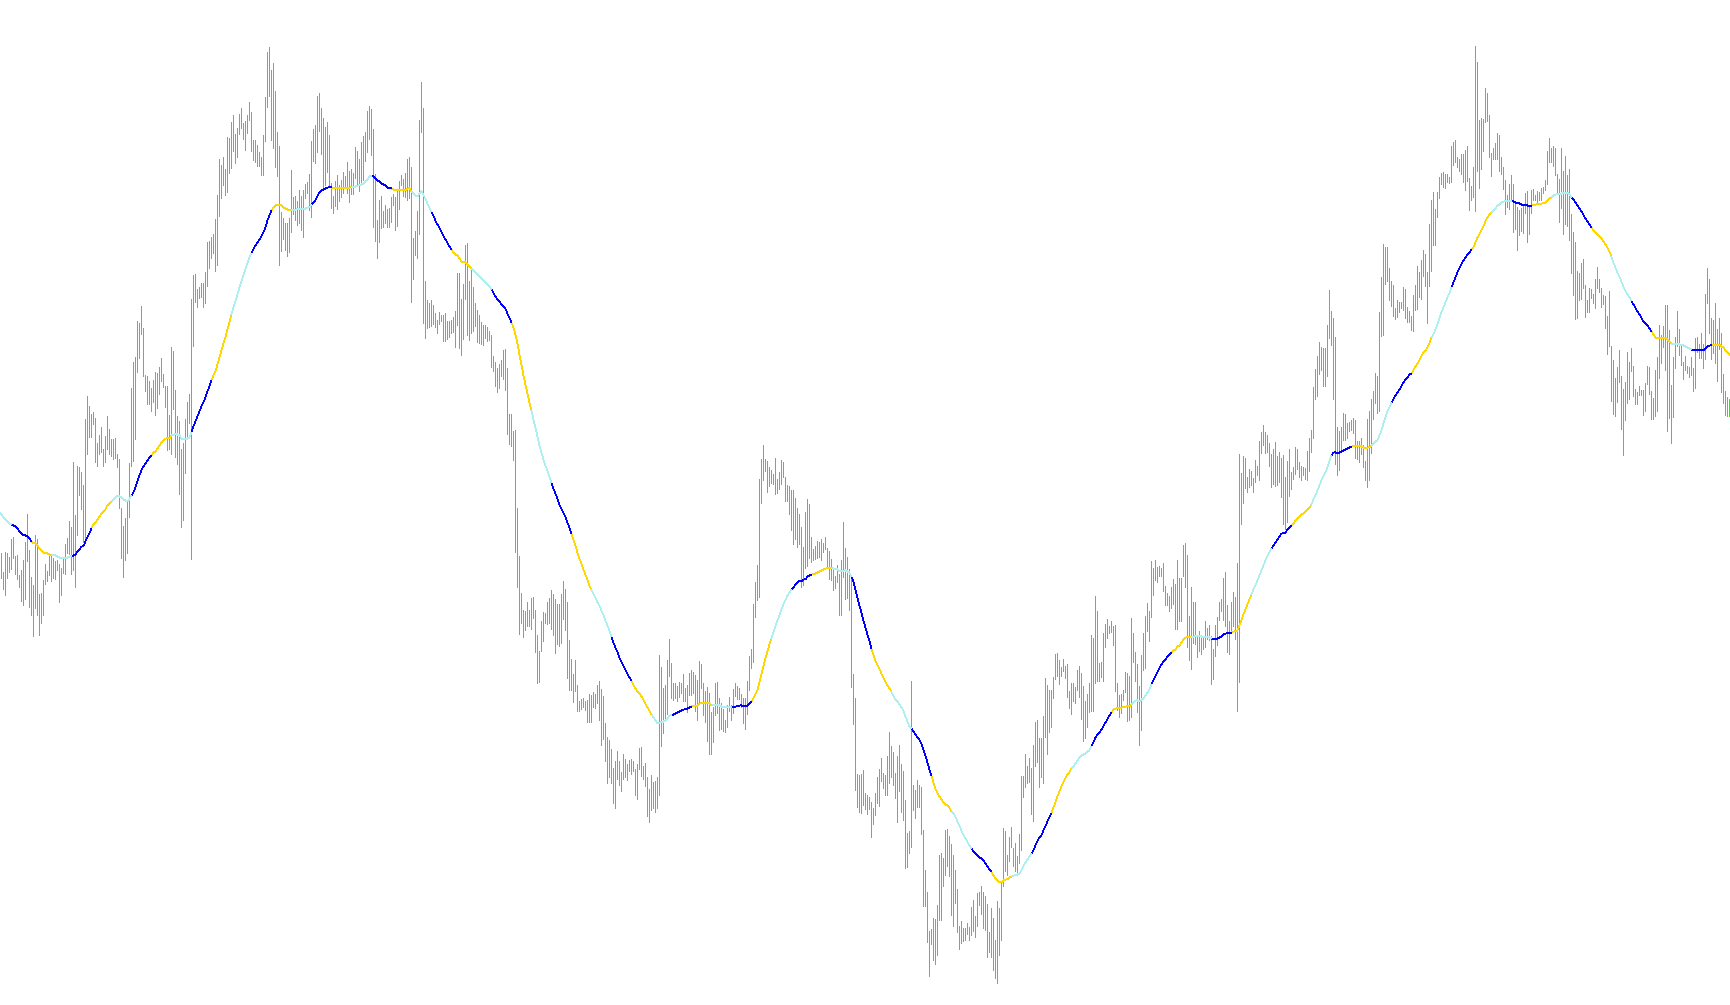
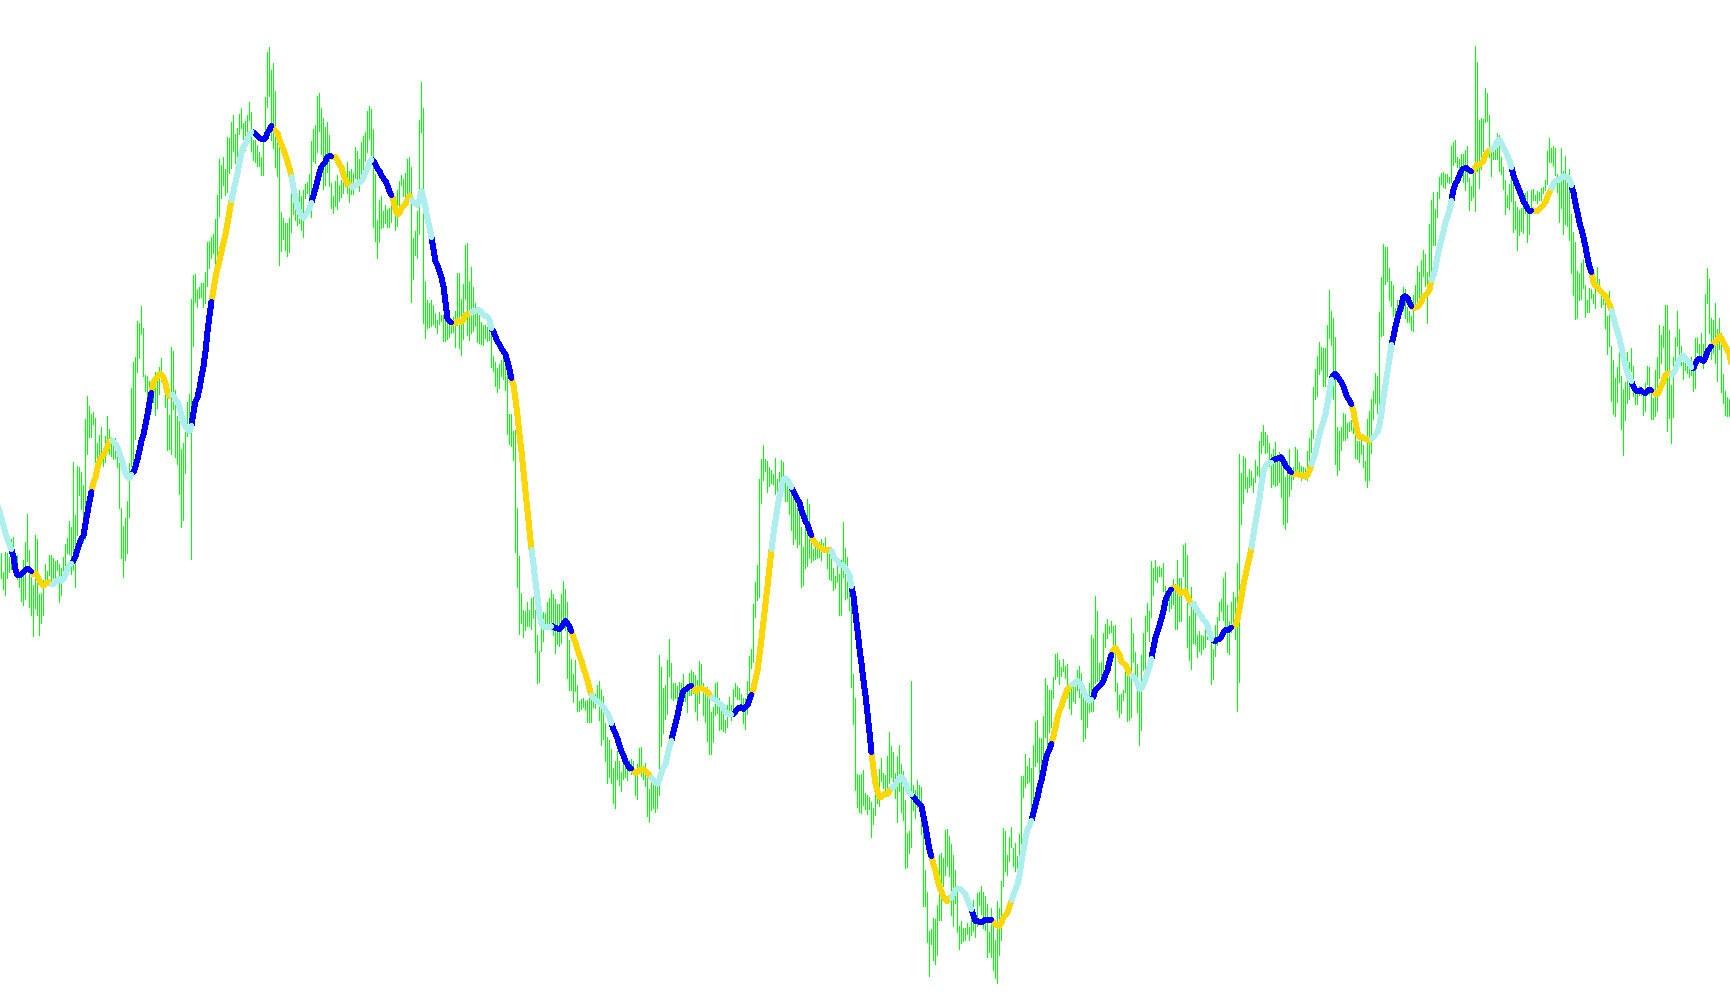
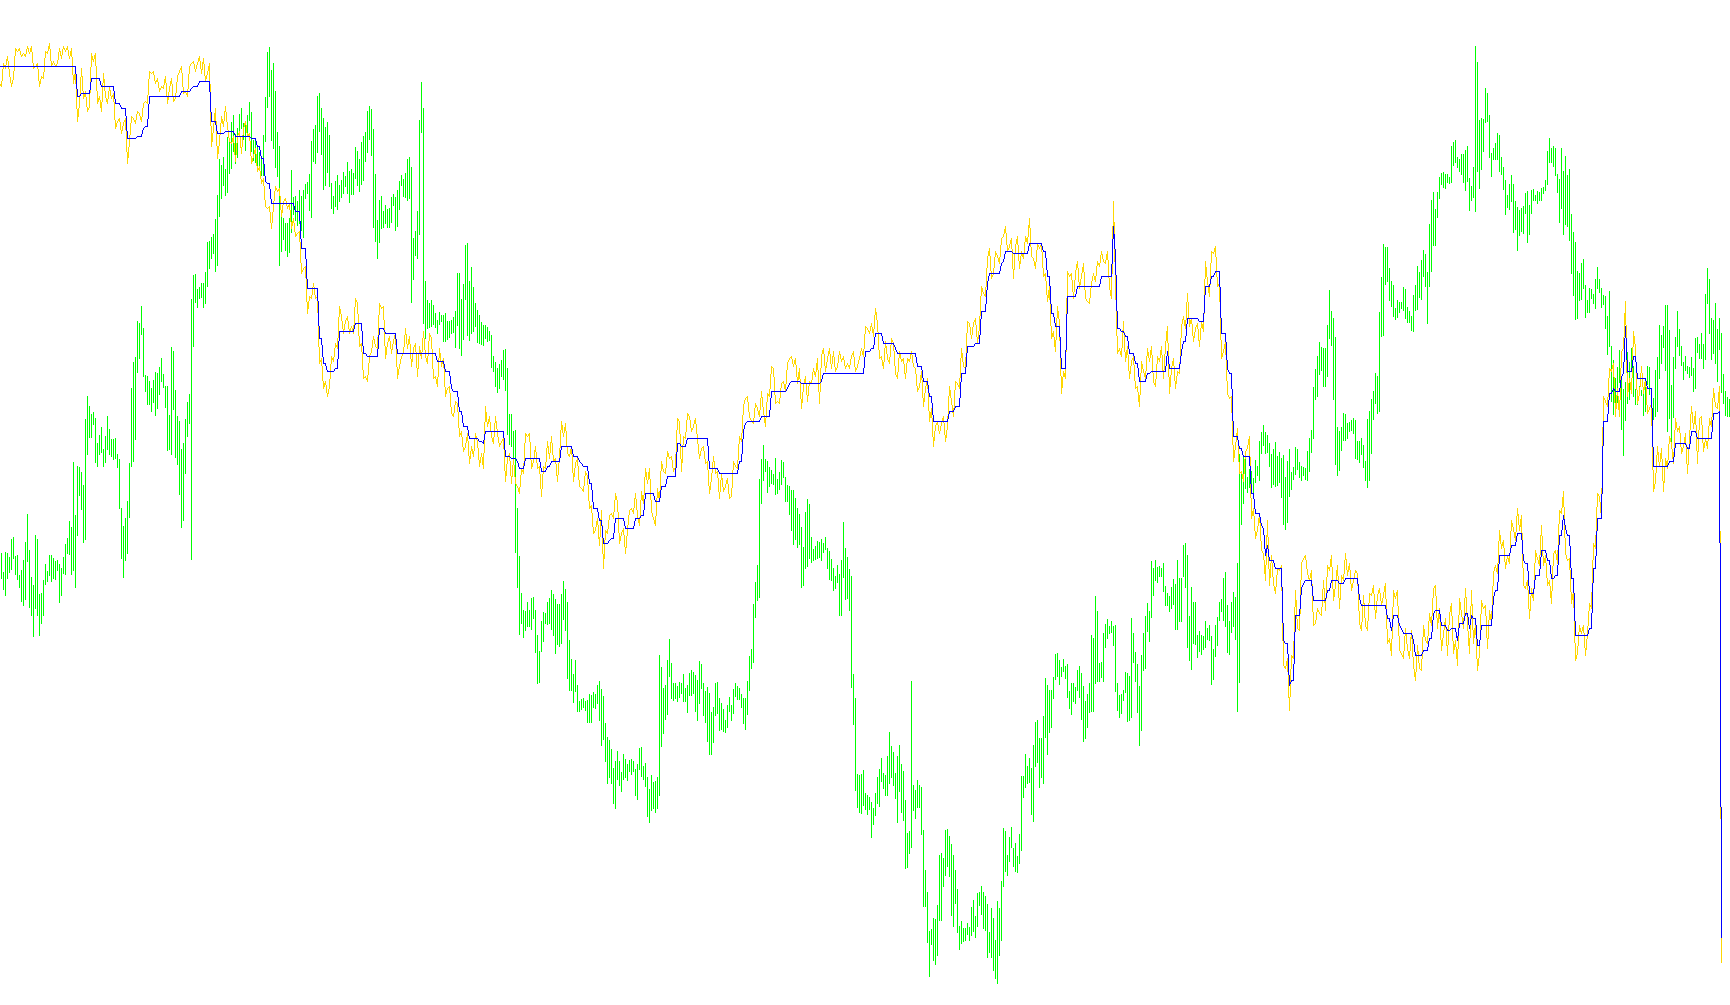
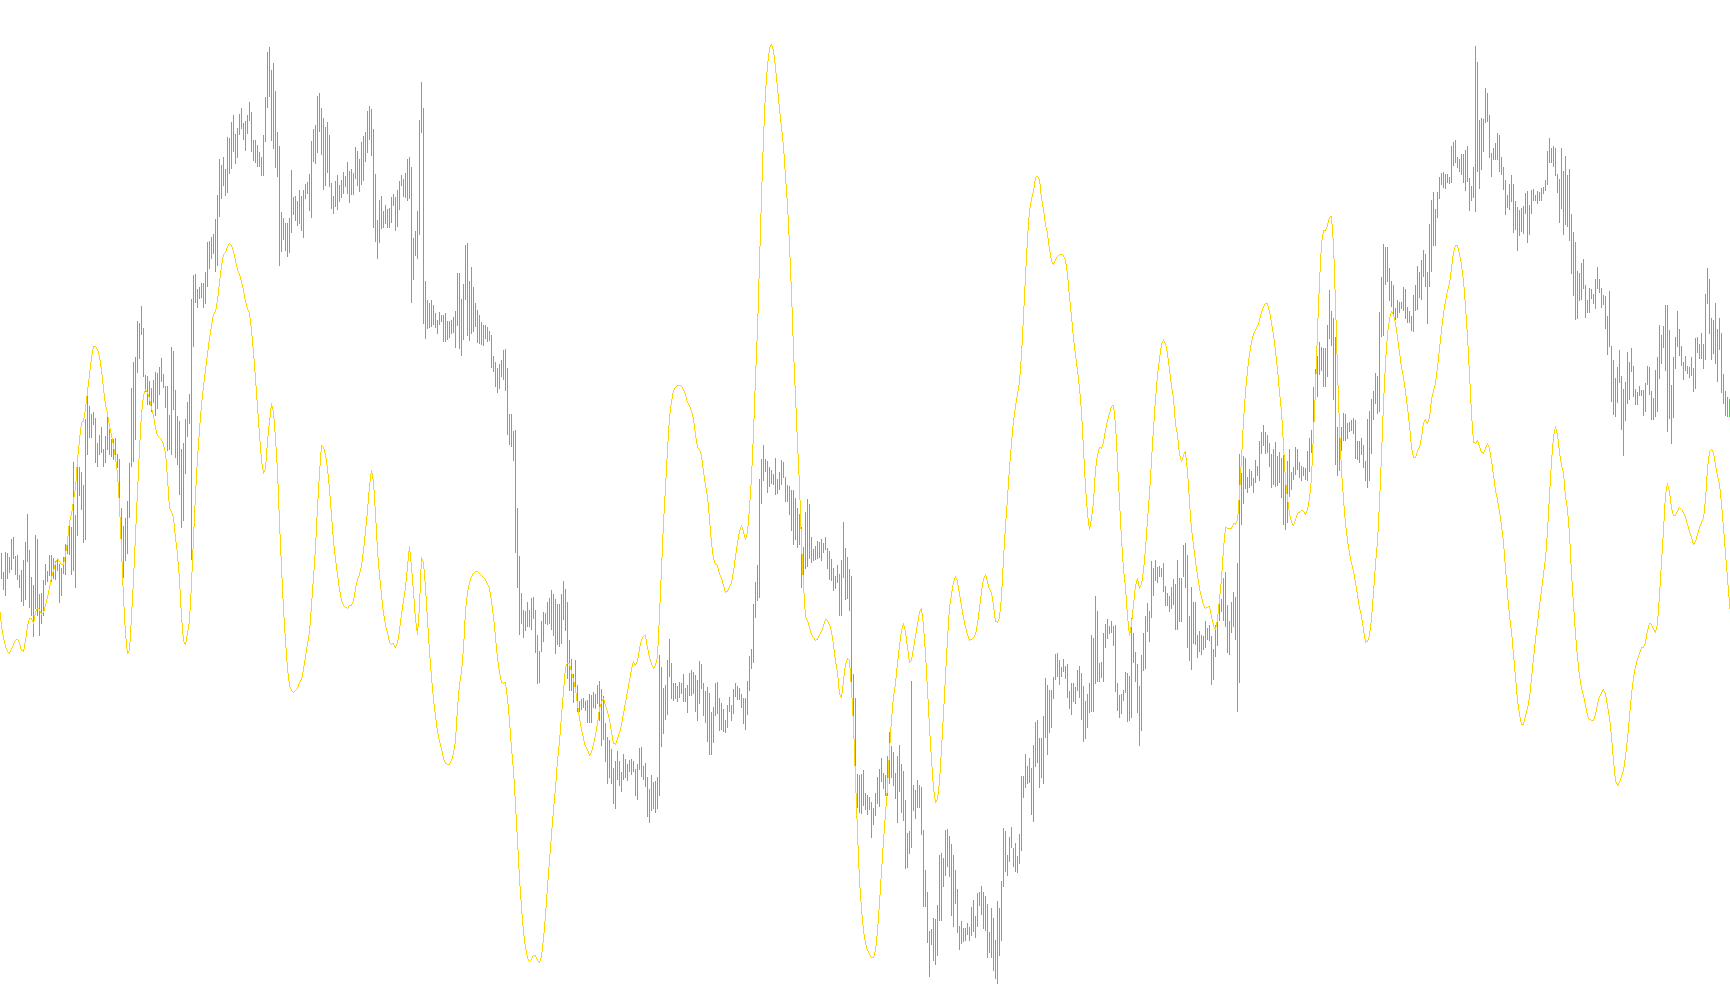
This indicator segments historical price data into three distinct chronological windows to display sequential simple moving average phases using separate color buffers.

Three_Color_ma
Indicator

Three_Color_ma

iMA

This indicator segments historical price data into three distinct chronological phases, visually separating the moving average values into independent color-coded clusters.

Three_Color_ma_strict
Indicator

Three_Color_ma_strict

iMA

This indicator renders three distinct moving average segments on the chart by cycling active buffers across specific price intervals to visualize rhythmic trend shifts.

Three_Color_v1
Indicator

Three_Color_v1

iMA

This indicator segments the price action into three distinct chronological phases by plotting synchronized Simple Moving Averages in a rotating sequential buffer.

THV T3 Trix MTF
Indicator

THV T3 Trix MTF

This indicator synchronizes high-level momentum data across multiple timeframes to visualize dual-speed trend reversals using colored histogram and line components.

THV T3 Trix
Indicator

THV T3 Trix

This indicator calculates the Rate of Change (ROC) for two distinct TRIX-based momentum signals, utilizing a recursive triple exponential smoothing method to identify trend velocity and acceleration.

THV3_Trix_v4.01_Div
Indicator

THV3_Trix_v4.01_Div

This indicator calculates a smoothed Trix, identifies divergences between price and the Trix, and generates alerts based on Trix crossovers, signal line crosses, slope changes, and divergence patterns, displaying these events with labels and optional sound or email alerts.

THV_T3_Trix_MTF_01
Indicator

THV_T3_Trix_MTF_01

This indicator aggregates multi-timeframe TRIX T3 momentum data to visualize dual-speed trend transitions and direction shifts via dynamic histogram coloring.

Indicator

TH_MTF_Bar1.4_alerts

iCCIiMACDiADXiOsMA
Tick-Tack-toe_v1.1
Indicator

Tick-Tack-toe_v1.1

This script discretizes historical price action into a normalized grid system to reconstruct trend reversals and directional momentum into an independent binary data file.

Tick-Tack-toe_v1
Indicator

Tick-Tack-toe_v1

This script normalizes price action into a discrete grid system to identify structural reversals and trend continuations by filtering out minor market noise.

Indicator

Tick

TickAdaptiveRSI_v1
Indicator

TickAdaptiveRSI_v1

This indicator captures high-frequency momentum by calculating moving averages of sub-millisecond price velocity derived from Adaptive RSI fluctuations.

Ticker Awesome Oscillator
Indicator

Ticker Awesome Oscillator

This indicator calculates the momentum shift between a fast and slow simple moving average of real-time ticker prices to visualize bullish and bearish trend strength.

Ticker Bars
Indicator

Ticker Bars

This indicator reconstructs price action into custom-defined volume bars by tracking sequential price changes and rendering them as dynamic trend objects.

Ticker Candles
Indicator

Ticker Candles

This indicator synthesizes raw price ticks into custom synthetic candles to visualize high-frequency volatility and price movement patterns within a separate window.

Ticker FATL SATL
Indicator

Ticker FATL SATL

This indicator calculates distinct momentum profiles by applying specific linear weight coefficients to historical price data points to derive trend intensity values.

Ticker FATL
Indicator

Ticker FATL

The indicator calculates a customized momentum metric by applying a specific weighted linear regression to the last 39 price ticks.

Ticker MACD
Indicator

Ticker MACD

This indicator calculates moving average divergences based on discrete price ticks rather than standard candle intervals to identify real-time momentum shifts.

Ticker Renko Box
Indicator

Ticker Renko Box

This indicator synthesizes real-time price action into discrete Renko blocks by calculating fixed-size price movements and dynamically shifting historical visual objects to maintain structural continuity.

Ticker Renko
Indicator

Ticker Renko

This indicator transforms standard M1 price action into a synthetic Renko chart by filtering price movements through a fixed box-size threshold to isolate directional momentum.

Ticker RTSL
Indicator

Ticker RTSL

This indicator calculates a specialized weighted moving average by applying a fixed 99-point coefficient matrix to historical price ticks.

Ticker SATL
Indicator

Ticker SATL

The indicator calculates a weighted sum of recent price ticks using 65 unique coefficients to generate a smoothed trend line.

Ticker SATL_v1
Indicator

Ticker SATL_v1

This indicator calculates a multi-coefficient weighted sum of historical price points to project a dynamic trend line based on a specific numerical kernel.

Ticker Trail
Indicator

Ticker Trail

The indicator tracks live price fluctuations and plots a constrained boundary line that limits vertical deviations based on a user-defined step threshold.

Ticker TrailCD
Indicator

Ticker TrailCD

This indicator calculates a normalized momentum delta by tracking the cumulative price trajectory against two distinct trailing offsets to identify structural shifts.

Ticker Trail_v1
Indicator

Ticker Trail_v1

This indicator visualizes historical price movements and calculates a trailing volatility boundary by mapping chronological tick sequences against fixed point offsets.

Ticker Trail_v2
Indicator

Ticker Trail_v2

This indicator tracks historical price points and applies a fixed-distance smoothing threshold to visualize a trailing boundary relative to the ticker's movement.
Ticker ZigZag
Indicator

Ticker ZigZag

This indicator identifies structural price pivots by monitoring tick-level movements and triggering directional reversals only when a predefined volatility threshold is breached.
Ticker
Indicator

Ticker

This indicator tracks historical price points in a discrete array to calculate a rolling simple moving average based on exact tick progression.

TickLogger
Indicator

TickLogger

This script captures and archives real-time bid and ask price fluctuations into a timestamped CSV database for historical volatility analysis.

TickLoggerForFXT
Indicator

TickLoggerForFXT

Captures and serializes real-time price fluctuations into timestamped CSV records for historical telemetry analysis.

TickLoggerForFXT1
Indicator

TickLoggerForFXT1

This script captures and persists real-time bid price snapshots into a timestamped CSV file for historical telemetry analysis.

TickPrice
Indicator

TickPrice

This indicator dynamically maps price action by generating visual rectangles that encapsulate real-time tick movements, automatically segmenting and shifting historical data once a predefined pip range threshold is breached.

Ticks-2
Indicator

Ticks-2

This indicator visualizes high-frequency price updates by shifting a dynamic buffer to map instantaneous Bid values while managing temporal delimiters and horizontal price anchors.

Ticks
Indicator

Ticks

Captures and exports high-frequency price fluctuations into a CSV file by recording the opening, peak, trough, and closing prices over a user-defined number of ticks.

TickSave
Indicator

TickSave

This expert advisor captures and archives real-time bid prices for multiple specific instruments into structured CSV files, organized by server and month.

TicksInMySQL
Indicator

TicksInMySQL

This script establishes a persistent link to an external database to asynchronously archive real-time account metrics and price data.

TickSmoother_v1.1
Indicator

TickSmoother_v1.1

This indicator analyzes real-time price fluctuations by calculating multiple moving average types (SMA, EMA, SMMA, LWMA) based on discrete tick data rather than standard candlestick OHLC values.

Ticks_mod_v1.0
Indicator

Ticks_mod_v1.0

This indicator captures and shifts live Bid, Ask, and Open price movements into a dynamic sub-window buffer to visualize intra-bar price fluctuations.

Ticks_mod_v1.0a
Indicator

Ticks_mod_v1.0a

This indicator captures real-time price movement by logging the cumulative trajectory of bid-side fluctuations and counting sequential positive versus negative price shifts.

Ticks_Volume_Indicator
Indicator

Ticks_Volume_Indicator

iMAOnArray

This indicator quantifies market aggression by calculating the percentage divergence between smoothed upward and downward tick volumes to reveal underlying supply and demand dominance.

TickTime_Ron_v03a
Indicator

TickTime_Ron_v03a

This indicator monitors real-time price velocity by identifying significant directional imbalances within a rolling window of recent ticks.

TickUpDown_Ron_v01a
Indicator

TickUpDown_Ron_v01a

This indicator quantifies real-time price directionality by accumulating discrete upward and downward tick movements within the current candle.

Indicator

Tickwatcher

iAOiADXiSAR
Tickwatcher3
Indicator

Tickwatcher3

iADX

This indicator synchronizes ADX strength and Heiken Ashi price action across multiple timeframes to provide a unified visual dashboard of trend momentum.

Tick_on_Chart  Own Window
Indicator

Tick_on_Chart Own Window

This indicator tracks real-time price fluctuations by mapping historical bid values into a fixed-period array to identify recent high and low extremes relative to current market ticks.

Tick_on_Chart
Indicator

Tick_on_Chart

This indicator captures real-time price fluctuations by mapping historical tick progression against current Bid volatility to visualize price movement density.

Tick_on_Chart_001
Indicator

Tick_on_Chart_001

This indicator monitors real-time price fluctuations by mapping historical bid data into a rolling window to identify extreme local highs and lows relative to current price action.

Tick_on_Chart_multi3
Indicator

Tick_on_Chart_multi3

This indicator quantifies and visualizes the relative price movement of GBPUSD, EURUSD, and USDCHF against their baseline start points to identify aggregate currency trend shifts.