test_FATL_v1
Download script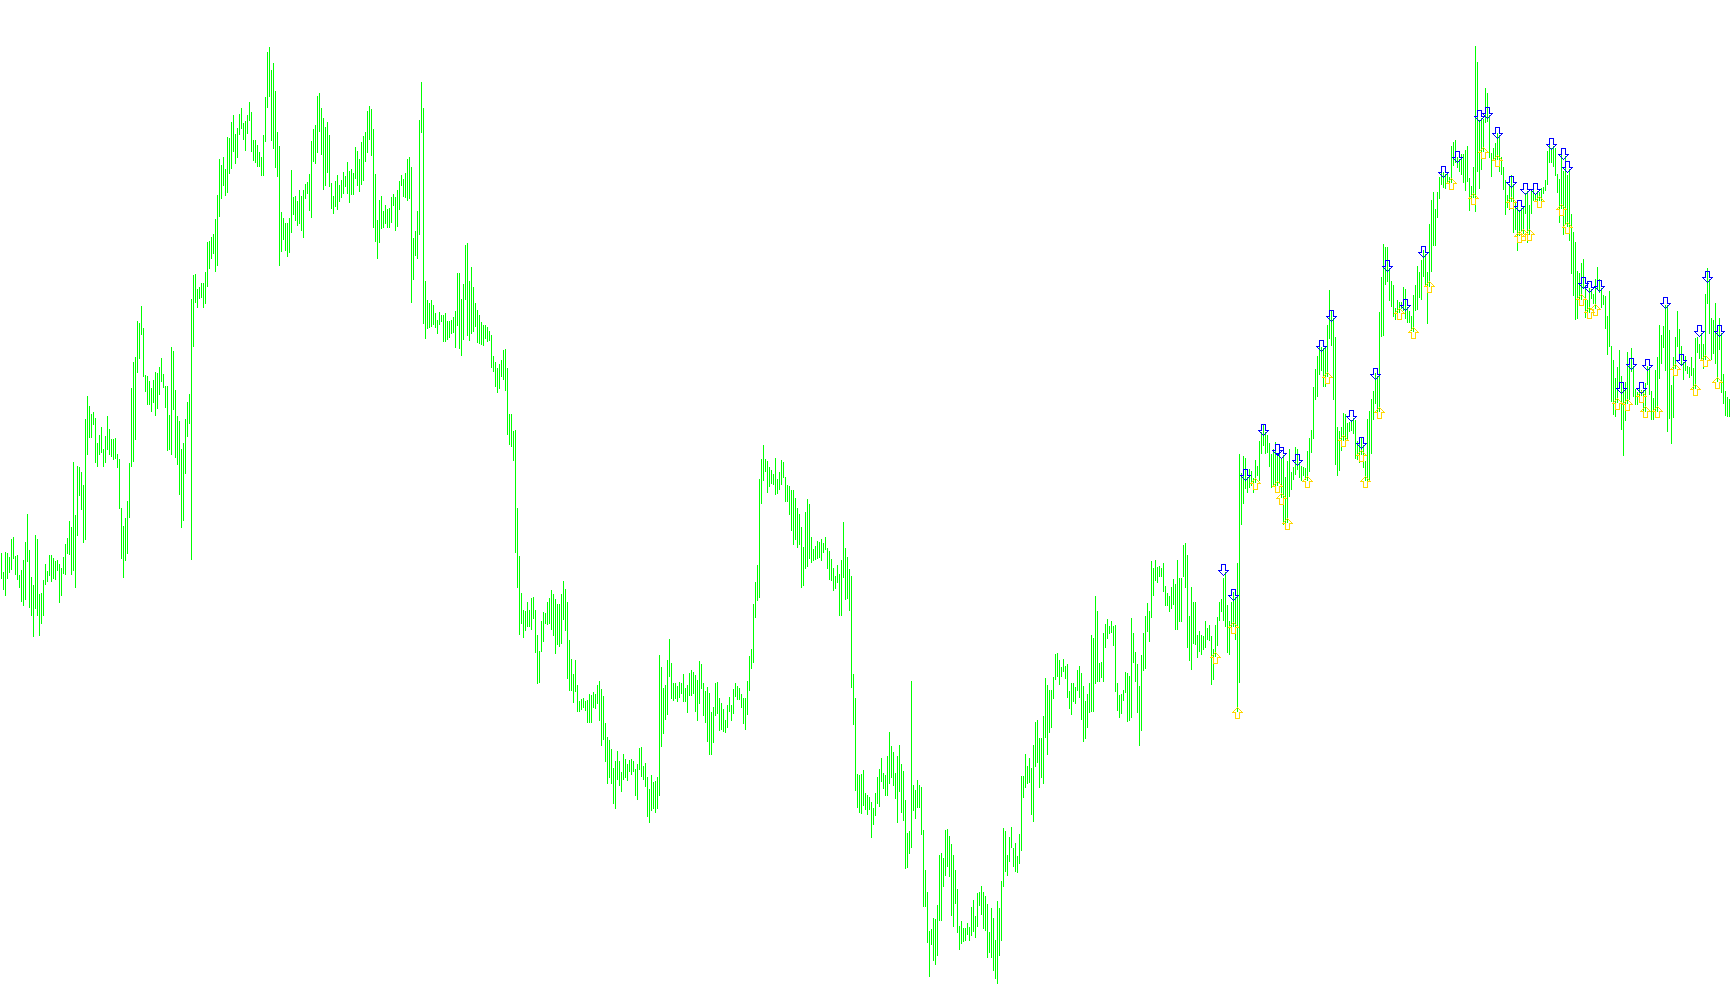
This script is designed as a custom technical analysis indicator for the MetaTrader platform. Its primary purpose is to identify specific trend shifts in price action by analyzing historical closing prices over a fixed window of time.
How the Logic Works
1. Data Analysis Window The tool looks back at a specific number of historical bars (defaulting to 300) to calculate market momentum. To make these calculations accurate, it requires a minimum history of 38 bars before it begins providing signals.
2. The Calculation Method Rather than using a simple moving average, the script employs a weighted mathematical formula. It takes the closing prices of the last 39 periods and applies specific decimal weights to each one. This means that some historical price points have a much stronger influence on the final result than others, allowing the indicator to react more precisely to relevant market movements.
3. Identifying Trend Shifts The script performs this complex calculation twice for every candle: once for the current state and once for the previous state. By subtracting the second value from the first, it determines the "direction" of the momentum:
- If the result is positive, it identifies an upward bias.
- If the result is negative, it identifies a downward bias.
4. Visual Signals The core functionality of this script is to notify you only at the exact moment the trend changes (the "flip").
- Bullish Signal: When the momentum switches from negative to positive, the script places a Blue arrow just below the price candle.
- Bearish Signal: When the momentum switches from positive to negative, the script places a Red arrow just above the price candle.
Summary for the User
This is a "trend-change" indicator. It filters out the noise of standard price movement by using a weighted calculation and only alerts you on your chart when the underlying momentum shifts direction. Instead of highlighting every move, it highlights the specific moment where the market transitions from one trend to another.
//+------------------------------------------------------------------+
//| FATLs.mq4
//| Ramdass - Conversion only
//+------------------------------------------------------------------+

#property indicator_chart_window
#property indicator_buffers 2
#property indicator_color1 Blue
#property indicator_color2 Red

extern int CountBars=300;
//---- buffers
double UPBuffer[];
double DownBuffer[];
//+------------------------------------------------------------------+
//| Custom indicator initialization function                         |
//+------------------------------------------------------------------+
int init()
  {
   string short_name;
//---- indicator line
   IndicatorBuffers(2);
   SetIndexStyle(0,DRAW_ARROW);
   SetIndexArrow(0,241);
   SetIndexBuffer(0,UPBuffer);
   SetIndexStyle(1,DRAW_ARROW);
   SetIndexArrow(1,242);
   SetIndexBuffer(1,DownBuffer);
//----
   return(0);
  }
//+------------------------------------------------------------------+
//| FATLs                                                            |
//+------------------------------------------------------------------+
int start()
  {
   SetIndexDrawBegin(0,Bars-CountBars+38);
   SetIndexDrawBegin(1,Bars-CountBars+38);
   int i,counted_bars=IndicatorCounted();
   double val1, val2, i1;
   bool trend,old;
//----
   if(Bars<=38) return(0);
//---- initial zero
   if(counted_bars<38)
   {
      for(i=1;i<=0;i++) UPBuffer[CountBars-i]=0.0;
      for(i=1;i<=0;i++) DownBuffer[CountBars-i]=0.0;
   }
//----
   i=CountBars-38-1;
//   if(counted_bars>=38) i=Bars-counted_bars-1;
   while(i>=0)
     {
      val1=
0.4360409450*Close[i+0]
+0.3658689069*Close[i+1]
+0.2460452079*Close[i+2]
+0.1104506886*Close[i+3]
-0.0054034585*Close[i+4]
-0.0760367731*Close[i+5]
-0.0933058722*Close[i+6]
-0.0670110374*Close[i+7]
-0.0190795053*Close[i+8]
+0.0259609206*Close[i+9]
+0.0502044896*Close[i+10]
+0.0477818607*Close[i+11]
+0.0249252327*Close[i+12]
-0.0047706151*Close[i+13]
-0.0272432537*Close[i+14]
-0.0338917071*Close[i+15]
-0.0244141482*Close[i+16]
-0.0055774838*Close[i+17]
+0.0128149838*Close[i+18]
+0.0226522218*Close[i+19]
+0.0208778257*Close[i+20]
+0.0100299086*Close[i+21]
-0.0036771622*Close[i+22]
-0.0136744850*Close[i+23]
-0.0160483392*Close[i+24]
-0.0108597376*Close[i+25]
-0.0016060704*Close[i+26]
+0.0069480557*Close[i+27]
+0.0110573605*Close[i+28]
+0.0095711419*Close[i+29]
+0.0040444064*Close[i+30]
-0.0023824623*Close[i+31]
-0.0067093714*Close[i+32]
-0.0072003400*Close[i+33]
-0.0047717710*Close[i+34]
+0.0005541115*Close[i+35]
+0.0007860160*Close[i+36]
+0.0130129076*Close[i+37]
+0.0040364019*Close[i+38];

val2=
0.4360409450*Close[i+0+1]
+0.3658689069*Close[i+1+1]
+0.2460452079*Close[i+2+1]
+0.1104506886*Close[i+3+1]
-0.0054034585*Close[i+4+1]
-0.0760367731*Close[i+5+1]
-0.0933058722*Close[i+6+1]
-0.0670110374*Close[i+7+1]
-0.0190795053*Close[i+8+1]
+0.0259609206*Close[i+9+1]
+0.0502044896*Close[i+10+1]
+0.0477818607*Close[i+11+1]
+0.0249252327*Close[i+12+1]
-0.0047706151*Close[i+13+1]
-0.0272432537*Close[i+14+1]
-0.0338917071*Close[i+15+1]
-0.0244141482*Close[i+16+1]
-0.0055774838*Close[i+17+1]
+0.0128149838*Close[i+18+1]
+0.0226522218*Close[i+19+1]
+0.0208778257*Close[i+20+1]
+0.0100299086*Close[i+21+1]
-0.0036771622*Close[i+22+1]
-0.0136744850*Close[i+23+1]
-0.0160483392*Close[i+24+1]
-0.0108597376*Close[i+25+1]
-0.0016060704*Close[i+26+1]
+0.0069480557*Close[i+27+1]
+0.0110573605*Close[i+28+1]
+0.0095711419*Close[i+29+1]
+0.0040444064*Close[i+30+1]
-0.0023824623*Close[i+31+1]
-0.0067093714*Close[i+32+1]
-0.0072003400*Close[i+33+1]
-0.0047717710*Close[i+34+1]
+0.0005541115*Close[i+35+1]
+0.0007860160*Close[i+36+1]
+0.0130129076*Close[i+37+1]
+0.0040364019*Close[i+38+1];

i1=val1-val2;
UPBuffer[i]=0.0; DownBuffer[i]=0.0;

if (i1>0) trend=true;
if (i1<0) trend=false;

if ((! trend==old) && trend==true) UPBuffer[i]=Low[i]-5*Point;
if ((! trend==old) && trend==false) DownBuffer[i]=High[i]+5*Point;
old=trend;

      i--;
     }
   return(0);
  }
//+------------------------------------------------------------------+
Comments