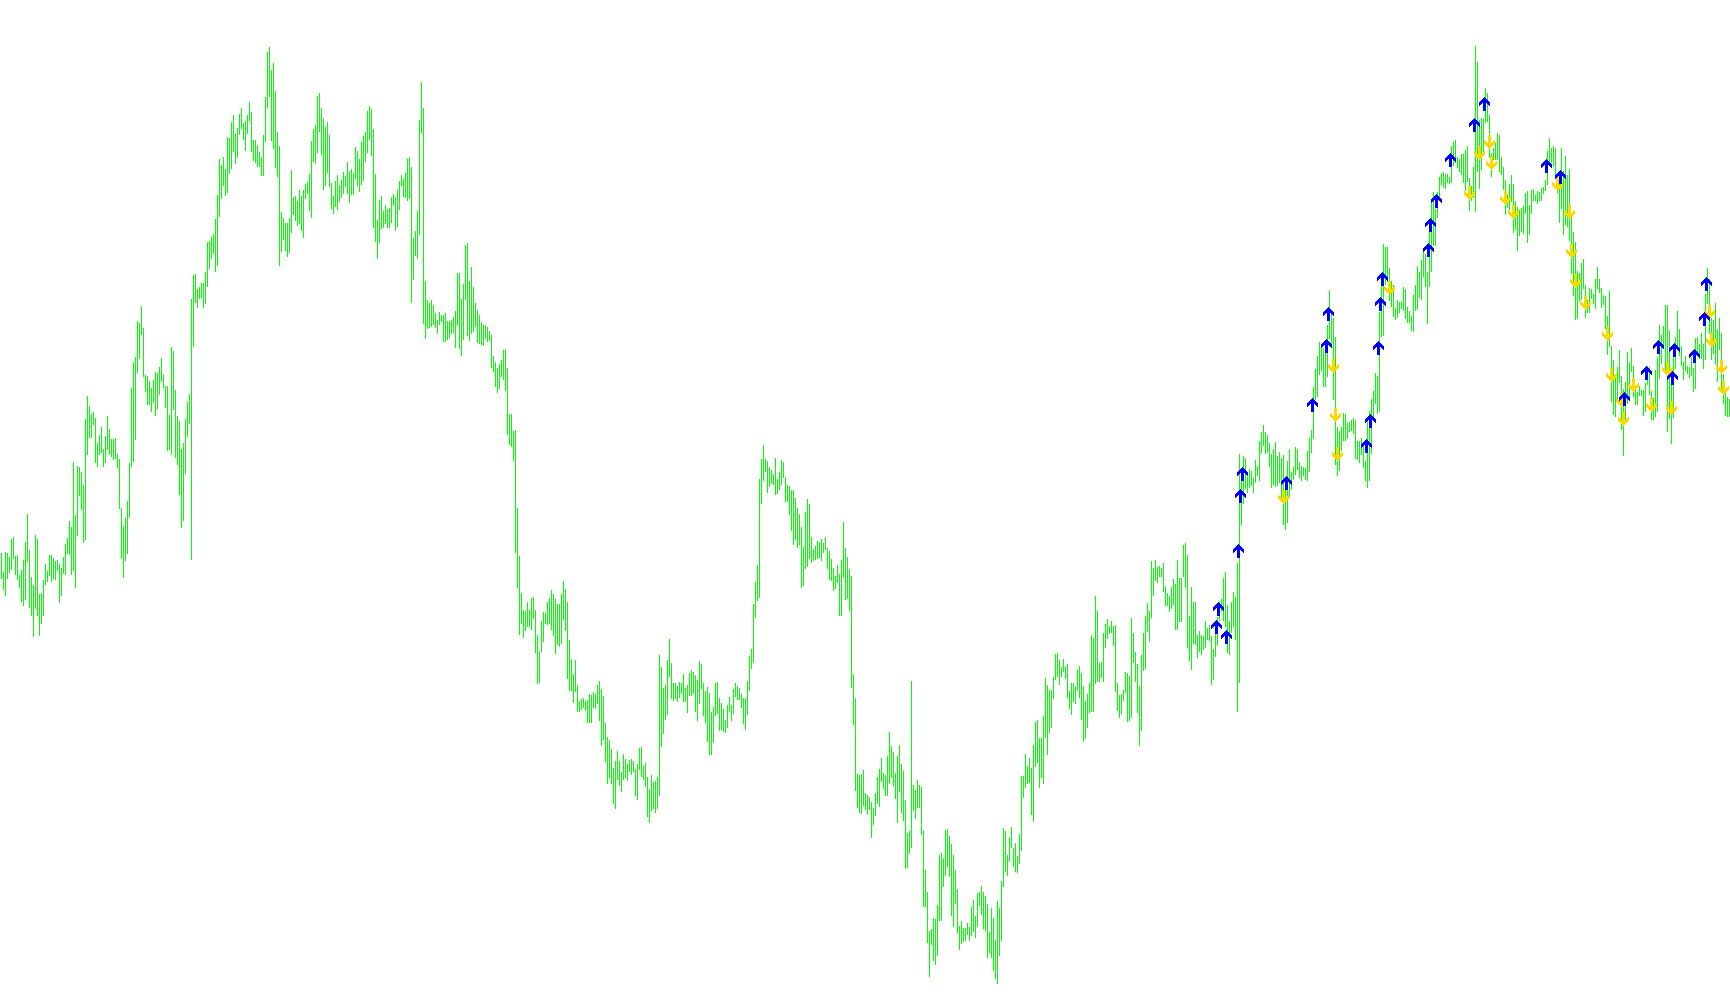
This tool is designed to help traders identify potential shifts in market momentum by analyzing price fluctuations through a specific mathematical average. Rather than looking at raw price spikes, the script calculates a "Typical Price" for each candle—a value derived from the average of the high, low, and closing prices.
How the Logic Works
The script monitors the movement of this Typical Price from one bar to the next. It focuses on identifying specific "directional changes" that meet a predetermined threshold. Here is the step-by-step breakdown of its operation:
- Data Calculation: The tool looks at the price data for each candlestick and determines its average value (the Typical Price).
- Momentum Tracking: It compares the current bar's Typical Price against the previous bar's price to calculate the "change" or difference between them.
- Signal Identification: Instead of reacting to every tiny wiggle in the market, the script uses a sensitivity filter. It only triggers a signal if the price change is significant enough to cross a specific numerical threshold (0.0005).
Visual Signals on Your Chart
The indicator provides clear visual cues directly on your trading platform to highlight these momentum shifts:
- Sell Opportunities: When the price drops significantly (falling below the negative threshold), the script places a specific red arrow on the chart. This indicates a downward move in momentum.
- Buy Opportunities: When the price rises significantly (climbing above the positive threshold), the script places a white arrow on the chart. This indicates an upward move in momentum.
By filtering out minor market "noise" and only highlighting movements that exceed a specific strength, this tool aims to help traders spot clear trends where the price is moving with enough conviction to potentially influence the next market move.
/*-----------------------------+
|			       |
| Shared by www.Aptrafx.com    |
|			       |
+------------------------------*/

//+------------------------------------------------------------------+
//|                                           MultiMovingAverage.mq4 |
//+------------------------------------------------------------------+
#property copyright "Ron T"
#property link      "http://www.lightpatch.com"

#property indicator_chart_window
#property indicator_buffers 3
#property indicator_color1 Red
#property indicator_color2 White
#property indicator_color3 DeepSkyBlue

//---- buffers
double ExtMapBuffer1[];
double ExtMapBuffer2[];
double ExtMapBuffer3[];


//+------------------------------------------------------------------+
//| Custom indicator initialization function                         |
//|------------------------------------------------------------------|

int init()
  {

   SetIndexStyle(0,DRAW_ARROW);
   SetIndexBuffer(0, ExtMapBuffer1);
   SetIndexArrow(0,234); //down red

   SetIndexStyle(1,DRAW_ARROW);
   SetIndexBuffer(1, ExtMapBuffer2);
   SetIndexArrow(1,233); //up white

   SetIndexStyle(2,DRAW_ARROW);
   SetIndexBuffer(2, ExtMapBuffer3);
   SetIndexArrow(2,224);

   return(0);
  }


//+------------------------------------------------------------------+
//| Custor indicator deinitialization function                       |
//+------------------------------------------------------------------+
int deinit()
  {
   int i;

   for( i=0; i<Bars; i++ ) ExtMapBuffer1[i]=0;
   for( i=0; i<Bars; i++ ) ExtMapBuffer2[i]=0;
   for( i=0; i<Bars; i++ ) ExtMapBuffer3[i]=0;

   return(0);
  }


//+------------------------------------------------------------------+
//| Custom indicator iteration function                              |
//+------------------------------------------------------------------+
int start()
  {
   double curTYP=0;
   double oldTYP=0;
   double change=0;

   int pos=Bars/5;

   Print ("Start SHOW5TICKS with bars=",pos);

   while(pos>=0)
     {
      oldTYP=curTYP;
      curTYP=(High[pos]+Low[pos]+Close[pos])/3;
      change=curTYP-oldTYP;

      if ( change < -0.0005 )
        {
         ExtMapBuffer1[pos]=curTYP;  //up white
         ExtMapBuffer2[pos]=0;
         //Print ("would SELL here ",CurTime());
        }

      if ( change > 0.0005 )
        {
         ExtMapBuffer1[pos]=0;
         ExtMapBuffer2[pos]=curTYP;  //down red
         //Print ("would BUY  here ",CurTime());
        }

 	   pos--;
     }

   return(0);
  }
//+------------------------------------------------------------------+
Comments