ThreePoleSuperSmootherFilter
Download script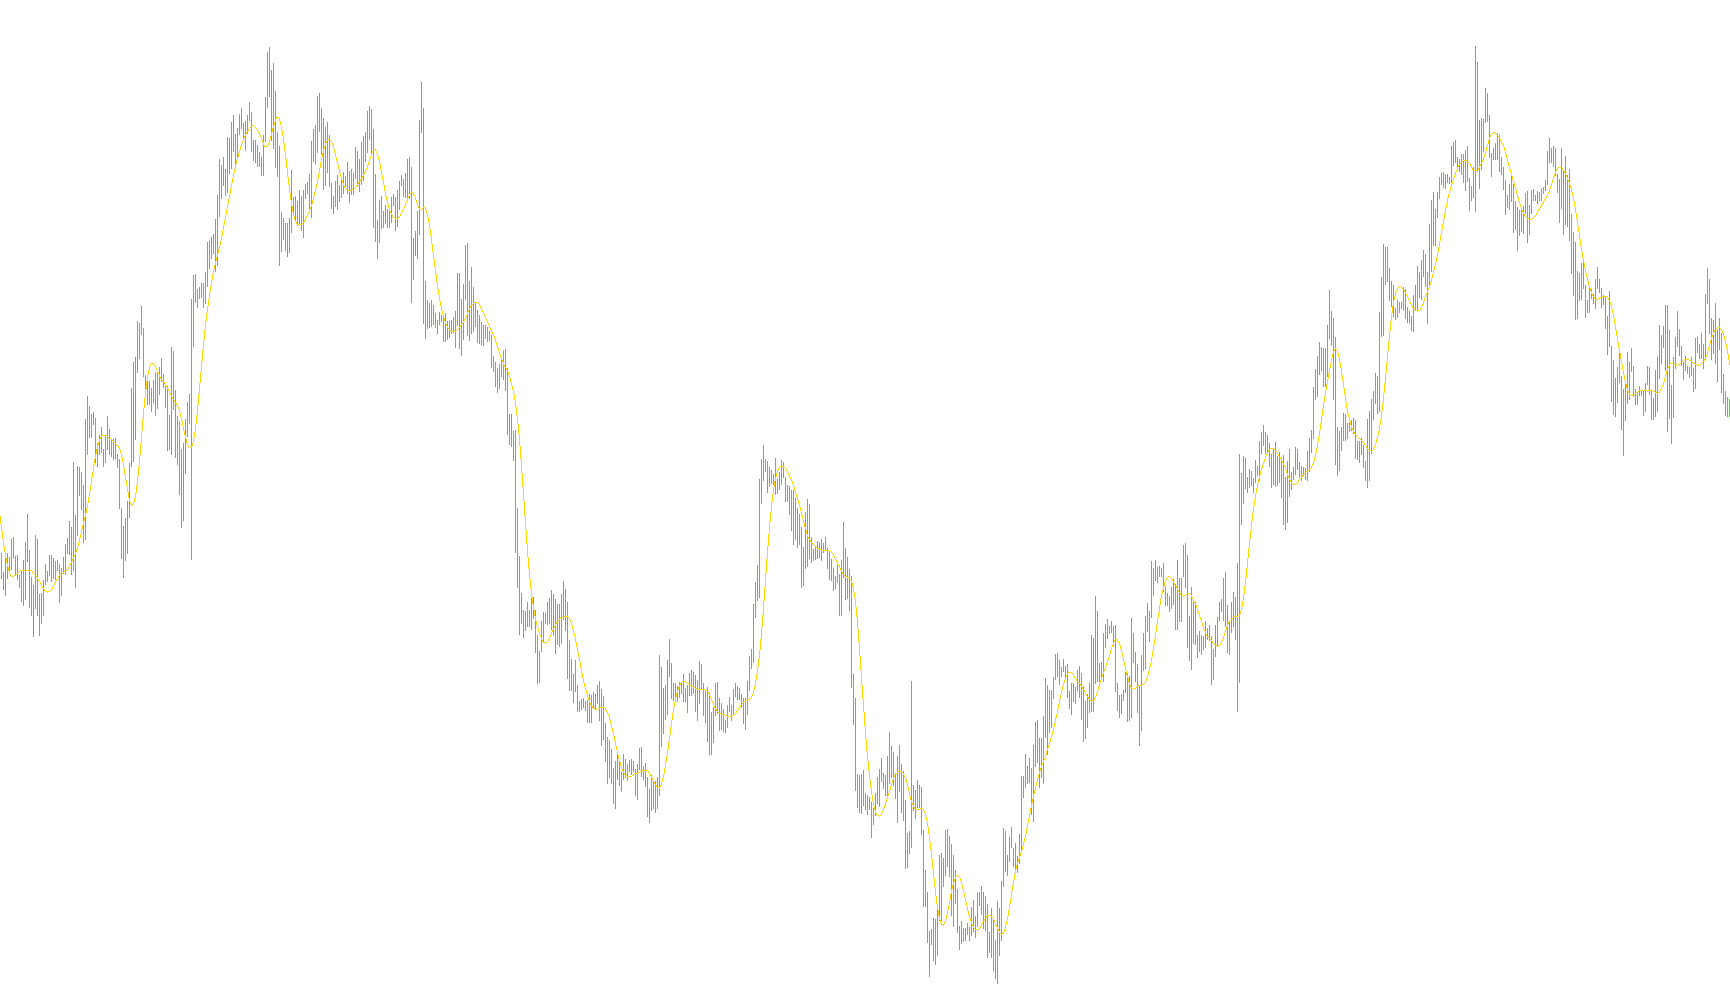
Overview
The Three-Pole Super Smoother Filter is a specialized technical analysis tool designed to clean up market price data. Its primary goal is to remove "noise"—the small, erratic fluctuations in price that can make it difficult for traders to identify the true underlying direction of a trend. By smoothing out these distractions, the indicator helps provide a clearer picture of the market's momentum.
How the Logic Works
1. Data Input Selection Instead of looking at just the closing price, the tool calculates a central value for every candle by averaging the high and low prices. This provides a more balanced starting point for its calculations, ensuring that extreme spikes or sudden wicks don't disproportionately skew the results.
2. The Filtering Mechanism (The "Super Smoother") The script employs a sophisticated mathematical approach known as a "Three-Pole" filter. In plain terms, this means the tool looks back at several previous data points simultaneously to determine the current trend. Rather than just reacting to what is happening now, it weighs multiple previous values against one another using a specific set of coefficients.
3. Customization via Cutoff Period The logic is governed by a user-defined "Cutoff Period." This acts as the sensitivity dial for the indicator:
- A shorter period makes the filter more responsive to recent price changes, allowing it to hug the price action more closely.
- A longer period creates a much smoother line, effectively "filtering out" more noise but potentially introducing a slight delay in reacting to sudden market reversals.
4. Dynamic Calculation When the tool runs, it performs a recursive calculation. It takes the current smoothed value and combines it with the previous three values, adjusted by the mathematical coefficients derived during the setup phase. This creates a fluid, continuous line on your chart that represents the "true" filtered price movement.
Summary for Traders
Think of this indicator as a high-quality lens for your charts. While raw price action can often look jagged and confusing, the Three-Pole Super Smoother acts like a stabilizer. It strips away the minor vibrations of the market to reveal the core trajectory, helping you identify whether the prevailing trend is moving upward, downward, or remaining neutral with greater clarity.
//+------------------------------------------------------------------+
//|                                 ThreePoleSuperSmootherFilter.mq4 |
//|                                                                  |
//| Three-Pole Super Smoother Filter                                 |
//|                                                                  |
//| Algorithm taken from book                                        |
//|     "Cybernetics Analysis for Stock and Futures"                 |
//| by John F. Ehlers                                                |
//|                                                                  |
//|                                              contact@mqlsoft.com |
//|                                          http://www.mqlsoft.com/ |
//+------------------------------------------------------------------+
#property copyright "Coded by Witold Wozniak"
#property link      "www.mqlsoft.com"

#property indicator_chart_window
#property indicator_buffers 1
#property indicator_color1 Red

extern int CutoffPeriod = 15;

double Filter[];

int buffers = 0;
int drawBegin = 0;

double tempReal, rad2Deg, deg2Rad;
double coef1, coef2, coef3, coef4;

int init() {
    drawBegin = 4;
    initBuffer(Filter, "Three-Pole Super Smoother Filter", DRAW_LINE);
    IndicatorBuffers(buffers);
    IndicatorShortName("Three-Pole Super Smoother Filter [" + CutoffPeriod + "]");
    tempReal = MathArctan(1.0);
    rad2Deg = 45.0 / tempReal;
    deg2Rad = 1.0 / rad2Deg;
    double a1 = MathExp(-3.14159 / CutoffPeriod);
    double b1 = 2 * a1 * MathCos(deg2Rad * 1.414 * 180 / CutoffPeriod);
    double c1 = a1 * a1;
    coef2 = b1 + c1;
    coef3 = -(c1 + b1 * c1);
    coef4 = c1 * c1;
    coef1 = 1.0 - coef2 - coef3 - coef4;
    return (0);
}

int start() {
    if (Bars <= drawBegin) return (0);
    int countedBars = IndicatorCounted();
    if (countedBars < 0) return (-1);
    if (countedBars > 0) countedBars--;
    int s, limit = Bars - countedBars - 1;
    for (s = limit; s >= 0; s--) {
        Filter[s] = coef1 * P(s) +
                    coef2 * Filter[s + 1] +
                    coef3 * Filter[s + 2] +
                    coef4 * Filter[s + 3];
        if (s > Bars - 4) {
            Filter[s] = P(s);
        }
    }
    return (0);
}

double P(int index) {
    return ((High[index] + Low[index]) / 2.0);
}

void initBuffer(double array[], string label = "", int type = DRAW_NONE, int arrow = 0, int style = EMPTY, int width = EMPTY, color clr = CLR_NONE) {
    SetIndexBuffer(buffers, array);
    SetIndexLabel(buffers, label);
    SetIndexEmptyValue(buffers, EMPTY_VALUE);
    SetIndexDrawBegin(buffers, drawBegin);
    SetIndexShift(buffers, 0);
    SetIndexStyle(buffers, type, style, width);
    SetIndexArrow(buffers, arrow);
    buffers++;
}
Comments