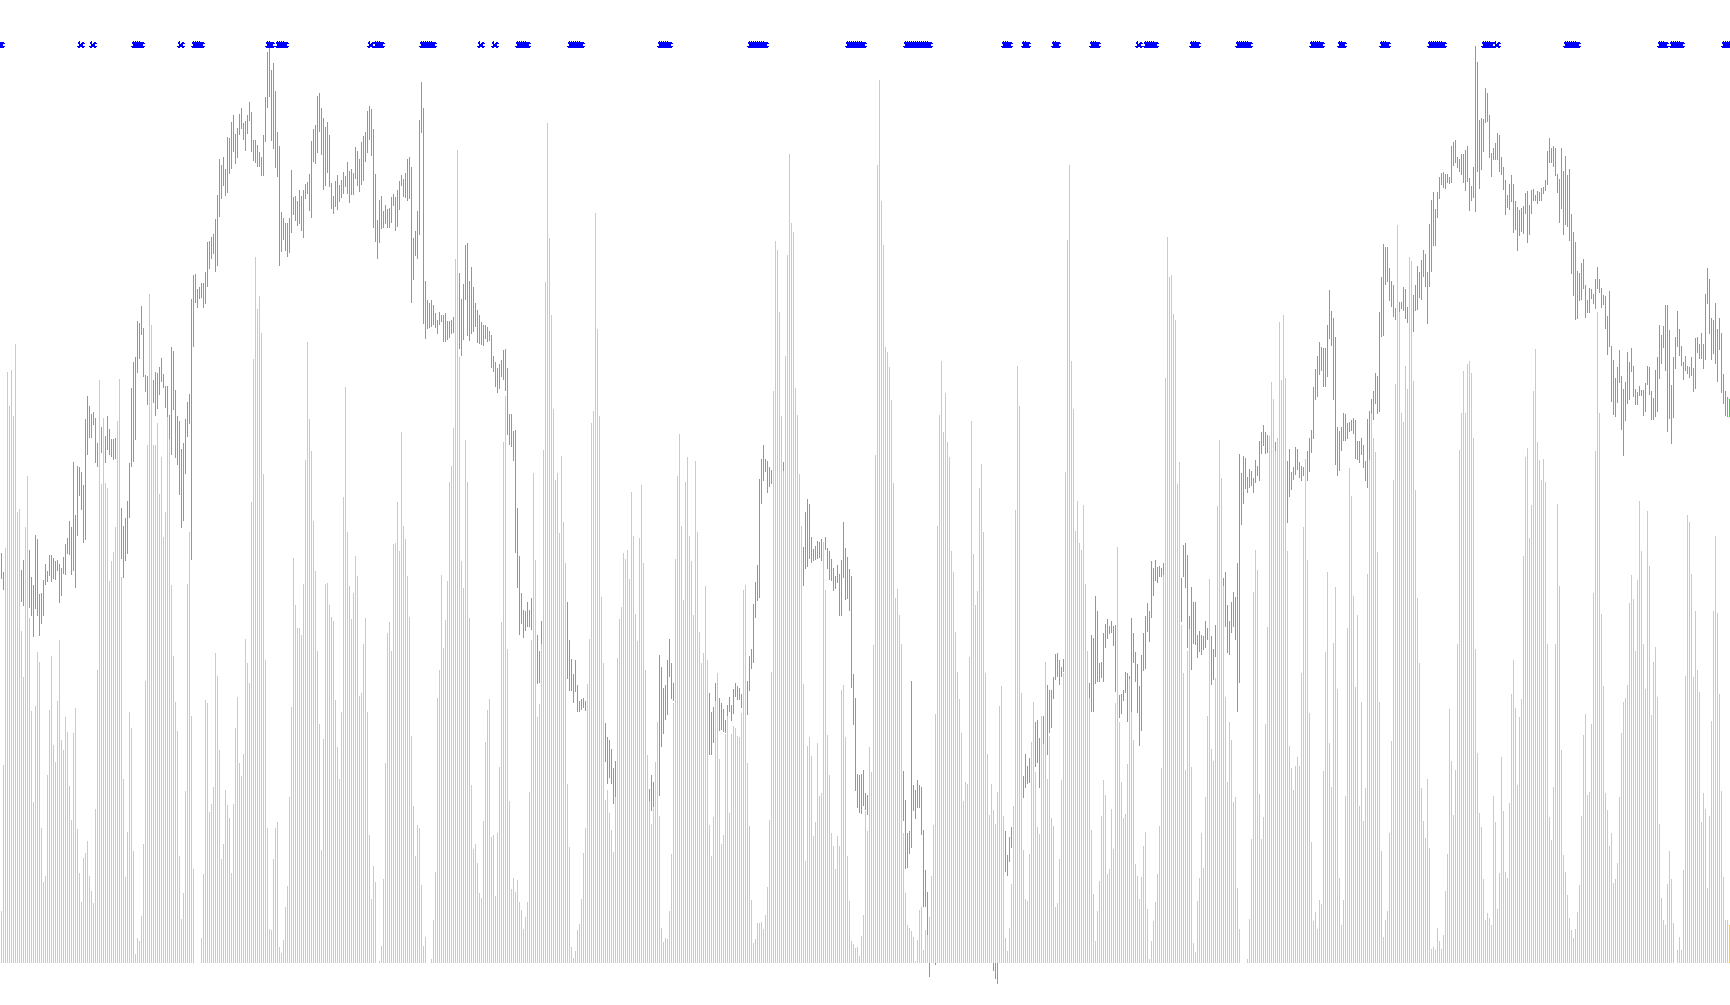
This tool is designed to help traders visualize market momentum by analyzing the relationship between multiple "Stochastic" indicators simultaneously. Instead of looking at just one moving average of price action, this script creates a visual representation of how different time horizons are behaving in relation to one another.
How the Logic Works
Multi-Period Analysis The core of this script is its ability to monitor seven different time periods at once. By calculating the Stochastic values for various lengths (ranging from short-term to long-term), the tool captures a "rainbow" of market data. Each period represents a different perspective on price movement—some showing immediate fluctuations and others showing broader, slower trends.
The Variance Calculation (The Delta) The primary logic of the script involves measuring the "spread" or difference between these various periods:
- It identifies the highest value among all seven Stochastic periods.
- It identifies the lowest value among all seven Stochastic periods.
- It calculates the Delta, which is the mathematical distance between that maximum and minimum value.
Visualizing Market Compression The visual output on your chart serves as a gauge of market "tension":
- High Delta: When the difference between the highest and lowest periods is large, it indicates that different timeframes are moving in divergent directions (high volatility or a strong trend).
- Low Delta (The Limit): The script features a specific threshold (the "Limit"). When the gap between all these different periods becomes very small—meaning all timeframes are essentially agreeing or moving in tight synchronization—the tool triggers a visual signal.
Summary for the Trader
Essentially, this indicator tells you when the market is reaching a state of extreme convergence. It identifies moments where short-term noise and long-term trends are lining up perfectly. For a trader, this often highlights areas of significant "compression" where price action might be preparing for a breakout or a meaningful shift in direction, providing a clearer picture of market sentiment than a standard single-line indicator could offer alone.
//+--------------------------------------------------------------+
//| Thread_Hist_1.mq4 |
//| Based on Spudfyre's Thread theory |
//| Display Stochastics rainbow based on different periods. |
//| |
//| emda |
//+--------------------------------------------------------------+
//| |
//| Remake for Alert-Signal"X" by kamita |
//+--------------------------------------------------------------+

#property copyright "Copyright ? 2007, Spudfyre & Emda"
#property link "http://www.forexfactory.com/showthread.php?t=37111"
//----
#property indicator_separate_window
#property indicator_minimum 0
#property indicator_maximum 100
#property indicator_buffers 3

#property indicator_color1 DarkGray
#property indicator_width1 3

#property indicator_color2 OrangeRed
#property indicator_width2 3

#property indicator_color3 Blue

#property indicator_level1 10.0
#property indicator_level2 15.0
#property indicator_level3 0
#property indicator_level4 0
#property indicator_levelcolor Gray

//---- input parameters
extern double Limit = 6.0;

//---- buffers
double BufferDelta[];
double Buffer_UP[];
double Buffer_DN[];

//+--------------------------------------------------------------+
//| Custom indicator initialization function |
//+--------------------------------------------------------------+
int init()
{
IndicatorBuffers(8);
SetIndexStyle(0, DRAW_HISTOGRAM);
SetIndexBuffer(0, BufferDelta);

SetIndexBuffer(1, Buffer_UP);
//SetIndexStyle(1, DRAW_LINE);
SetIndexStyle(1, DRAW_ARROW);
SetIndexArrow(1, 251);

SetIndexStyle(2, DRAW_LINE);
SetIndexBuffer(2, Buffer_DN);

//---- name for DataWindow and indicator subwindow label
string short_name;
short_name="Thread_Hist_Alert";
IndicatorShortName(short_name);
SetIndexLabel(0, "MPS wall");

return(0);
}

//-----------------------------------------------------------

int start()
{
int counted_bars=IndicatorCounted();
if (counted_bars<0) return(-1);

if (counted_bars>0) counted_bars--;
int pos=Bars-counted_bars;

//---- main calculation loop
while(pos>=0)
{
double sl1 = iStochastic(NULL,0,5,3,3,0,0,0,pos);
double sl2 = iStochastic(NULL,0,9,3,3,0,0,0,pos);
double sl3 = iStochastic(NULL,0,11,3,3,0,0,0,pos);
double swa = iStochastic(NULL,0,14,3,3,0,0,0,pos);
double su1 = iStochastic(NULL,0,17,3,3,0,0,0,pos);
double su2 = iStochastic(NULL,0,20,3,3,0,0,0,pos);
double su3 = iStochastic(NULL,0,24,3,3,0,0,0,pos);
double smatrix[7];
smatrix[0]=su1;
smatrix[1]=su2;
smatrix[2]=su3;
smatrix[3]=swa;
smatrix[4]=sl1;
smatrix[5]=sl2;
smatrix[6]=sl3;
double maxstoch = smatrix[ArrayMaximum(smatrix)];
double minstoch = smatrix[ArrayMinimum(smatrix)];
BufferDelta[pos]=maxstoch-minstoch;
if( BufferDelta[pos]<Limit ) Buffer_UP[pos]=80;
pos--;
}
return(0);
}
//+--------------------------------------------------------------+
Comments