t3_Aroon_Horn_Osc
Indicator

t3_Aroon_Horn_Osc

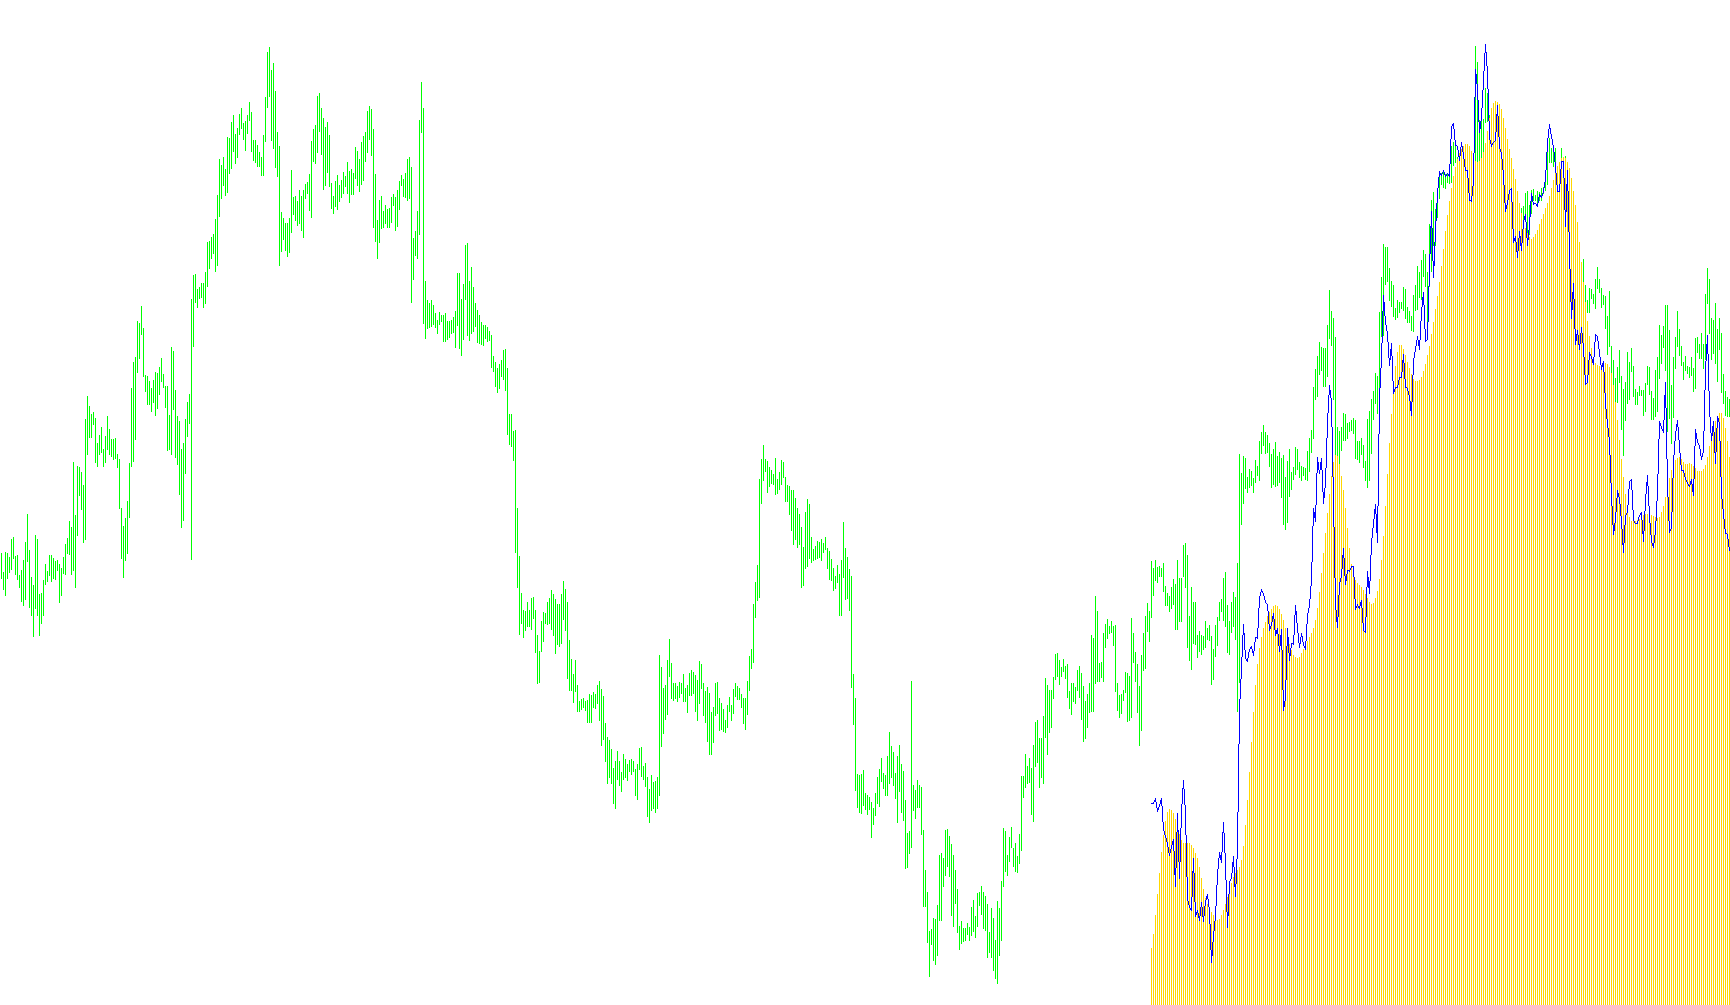
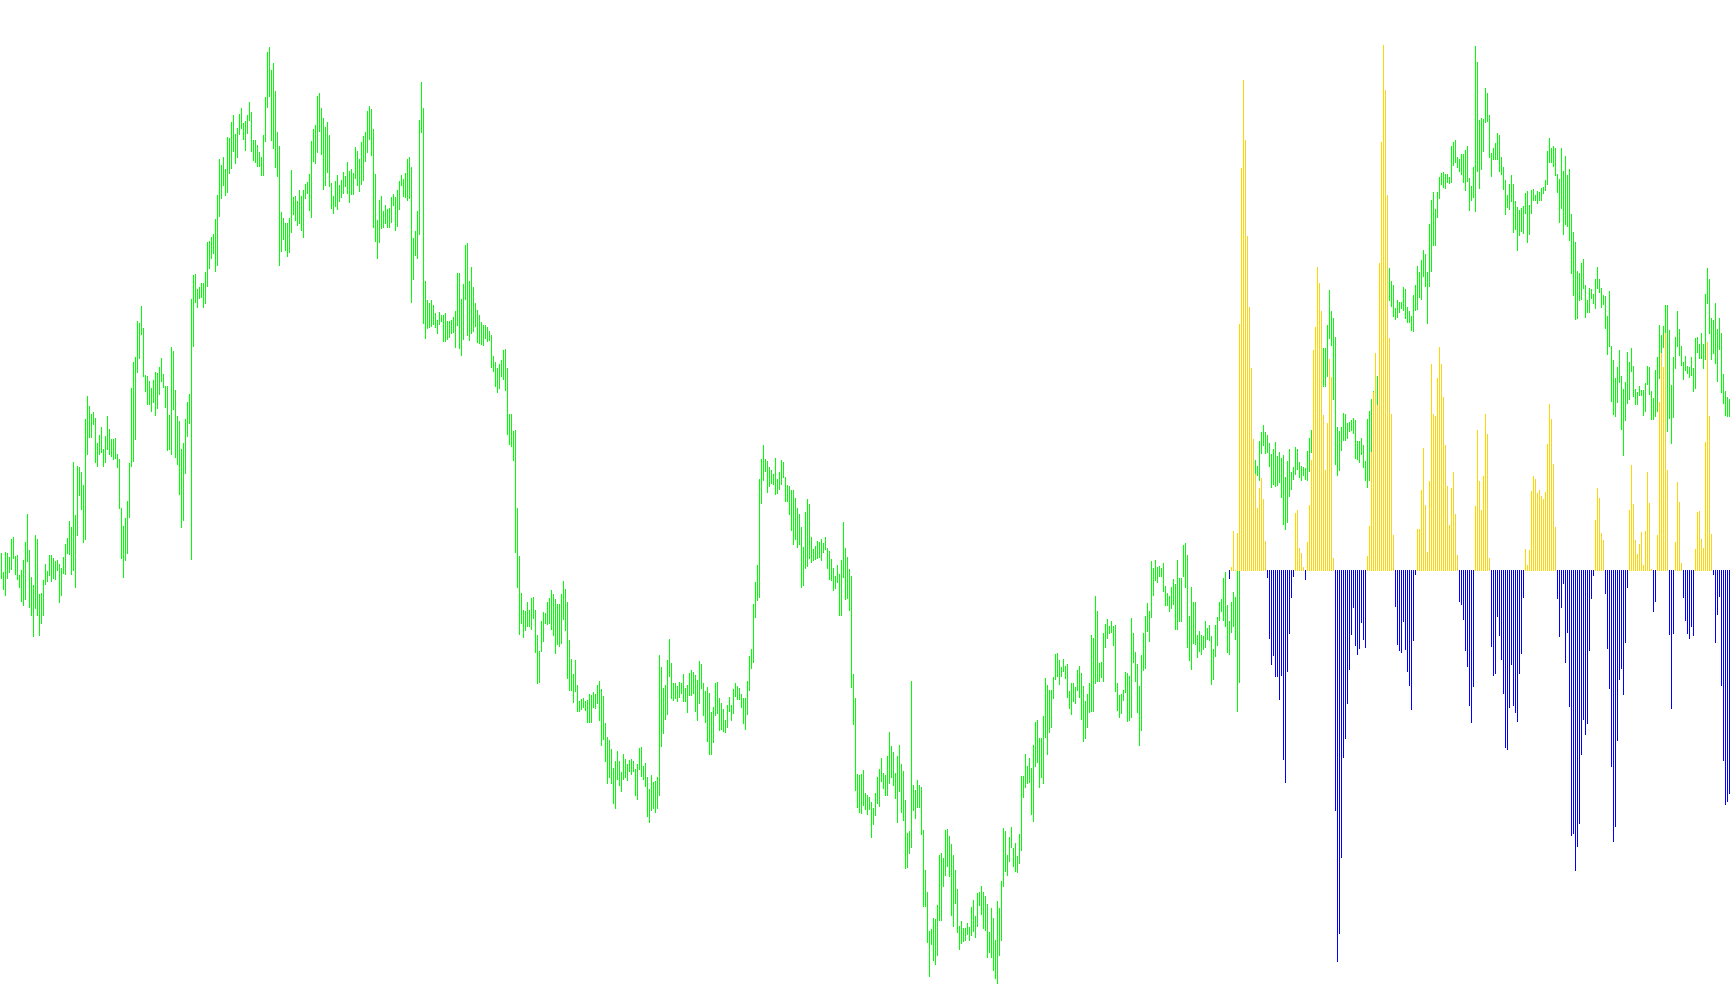
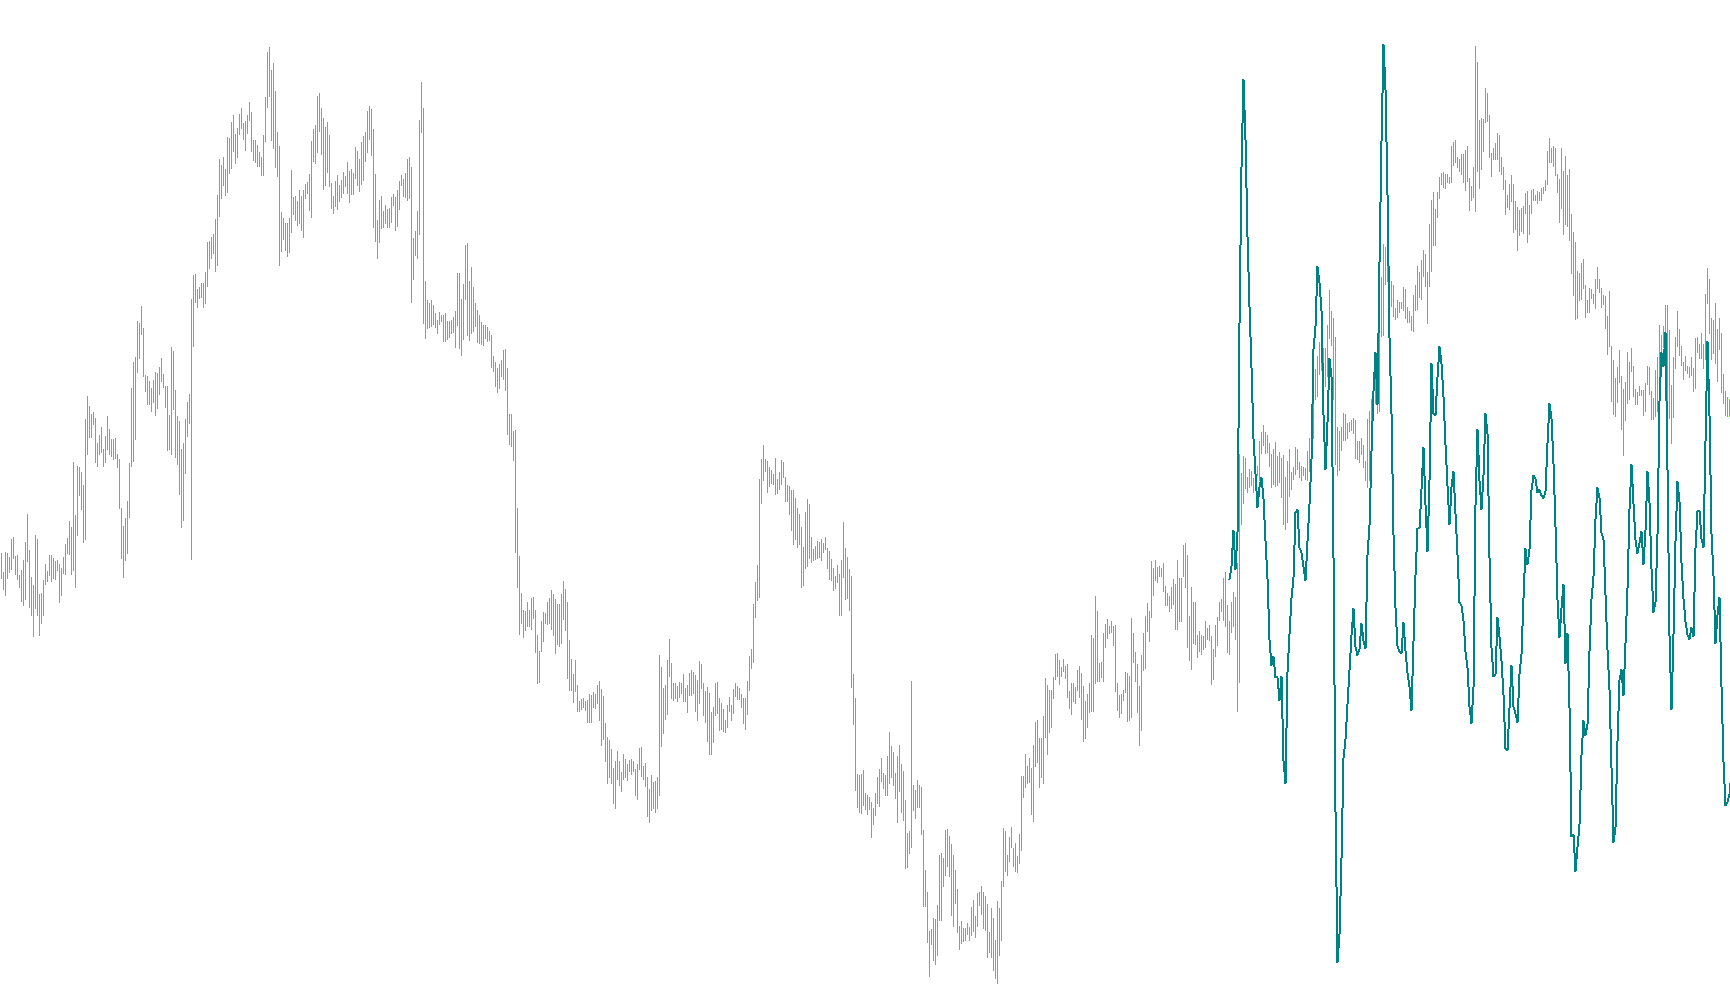
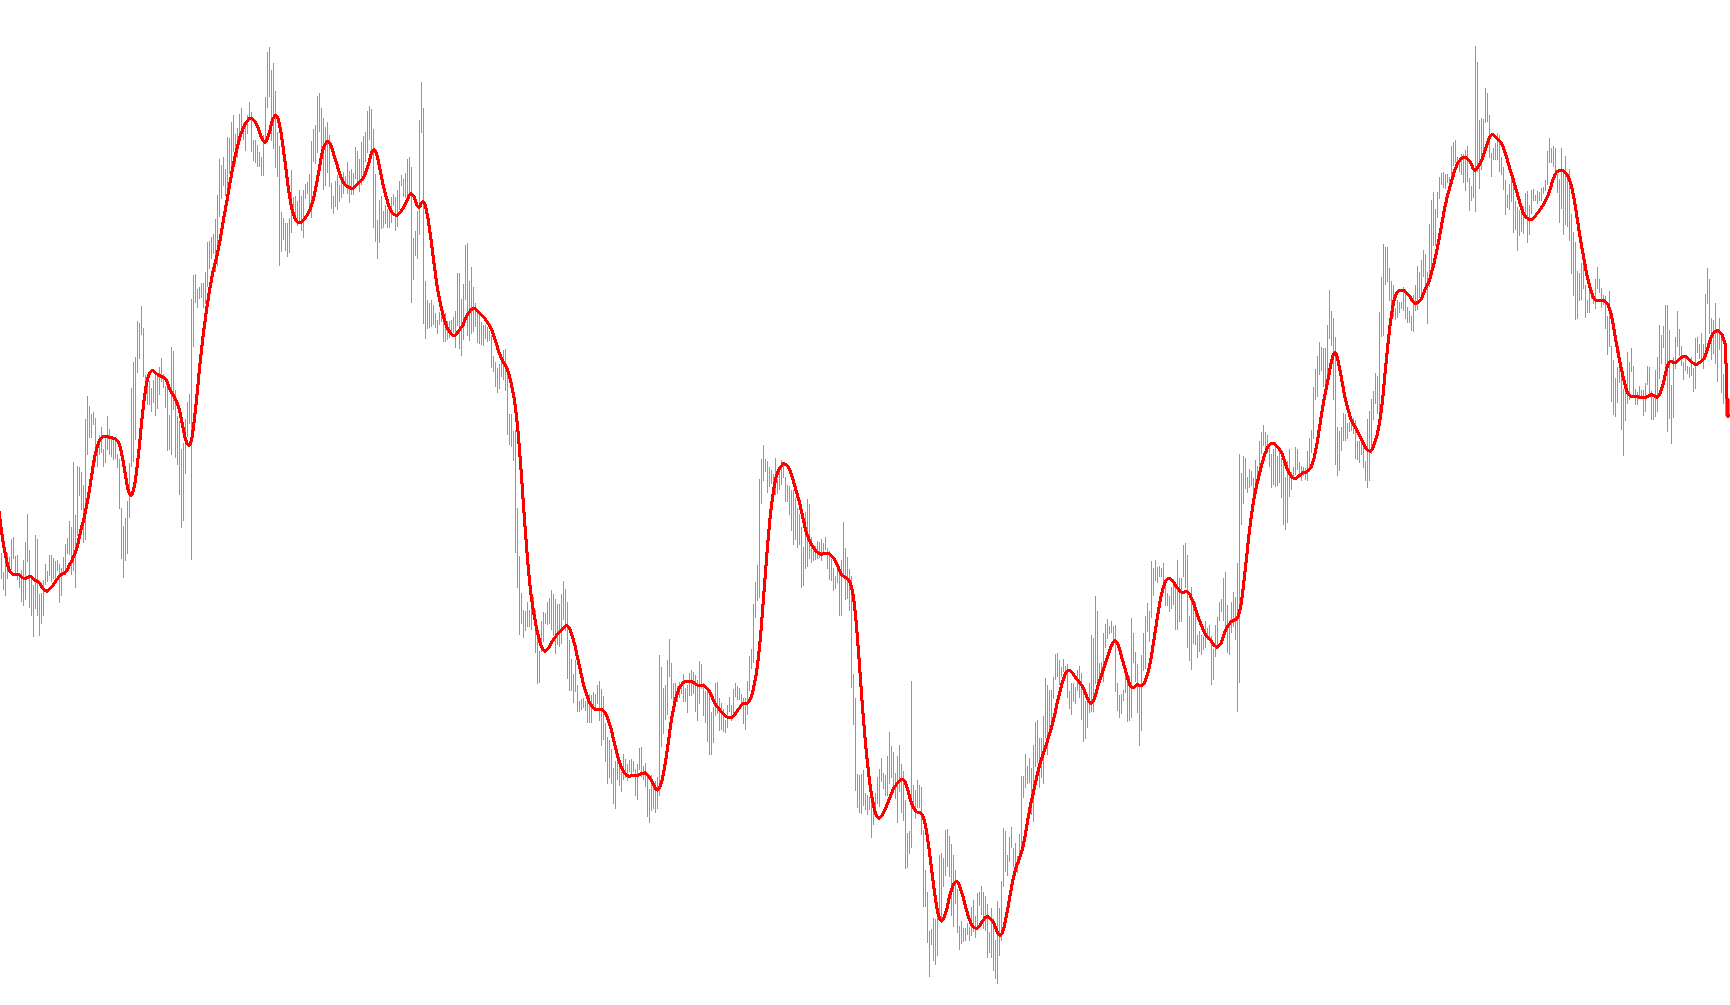
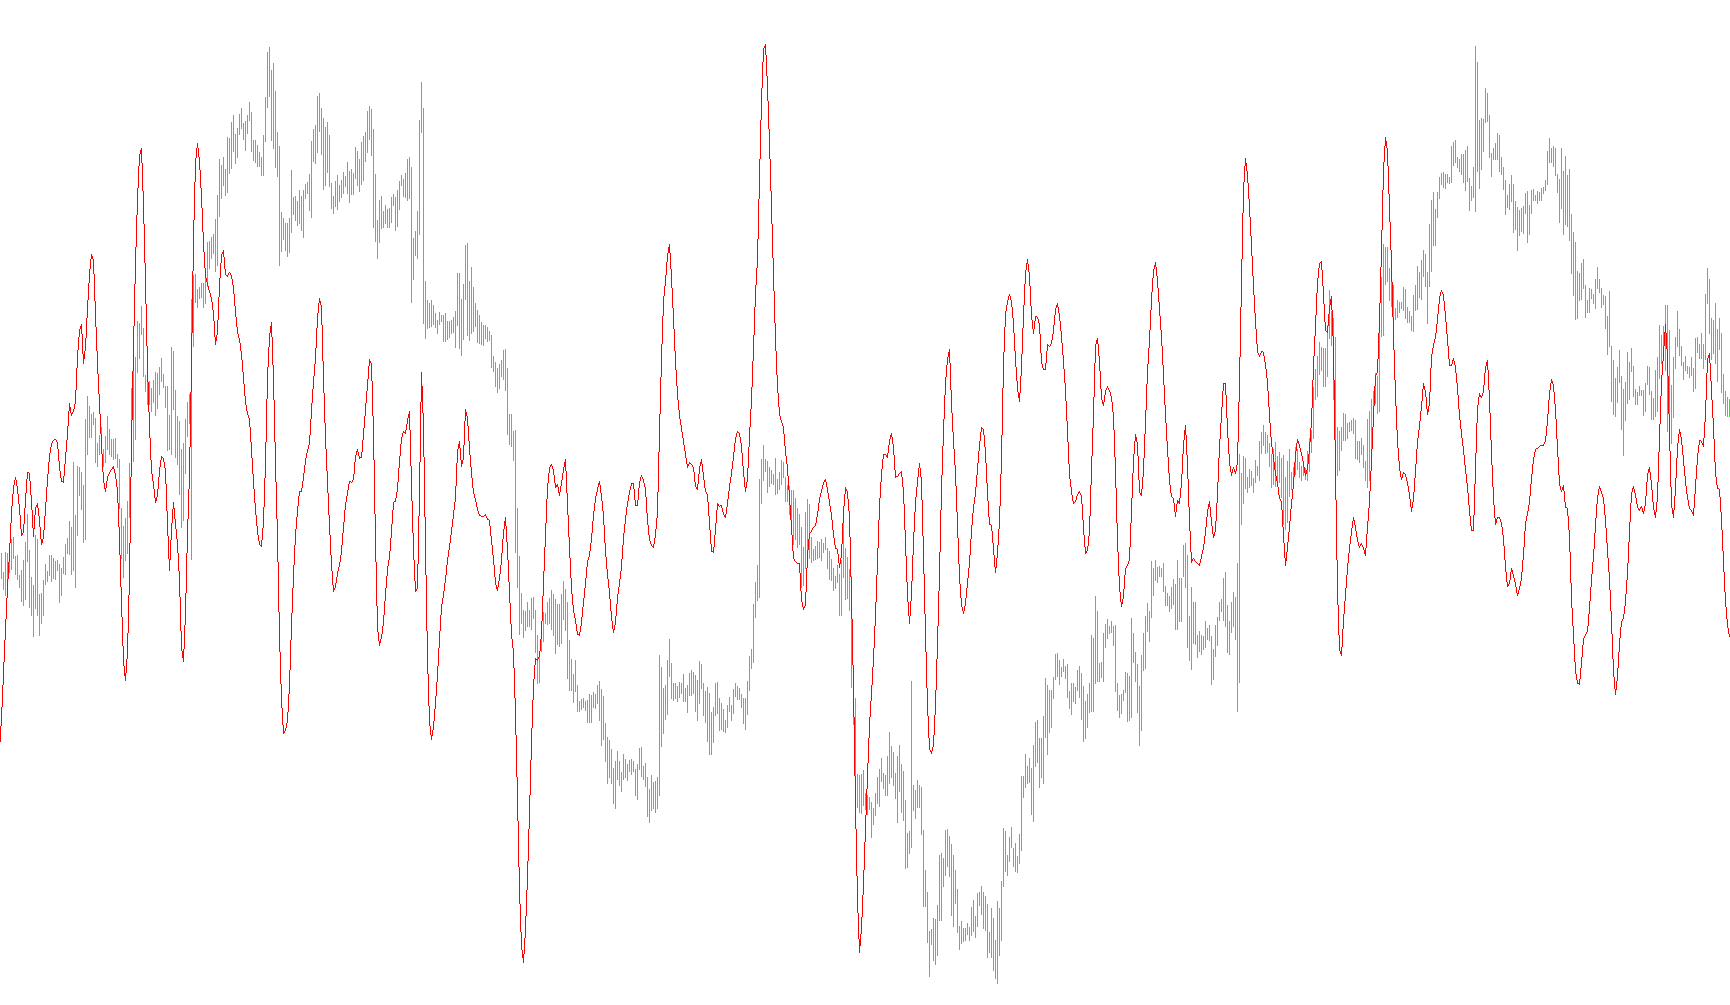
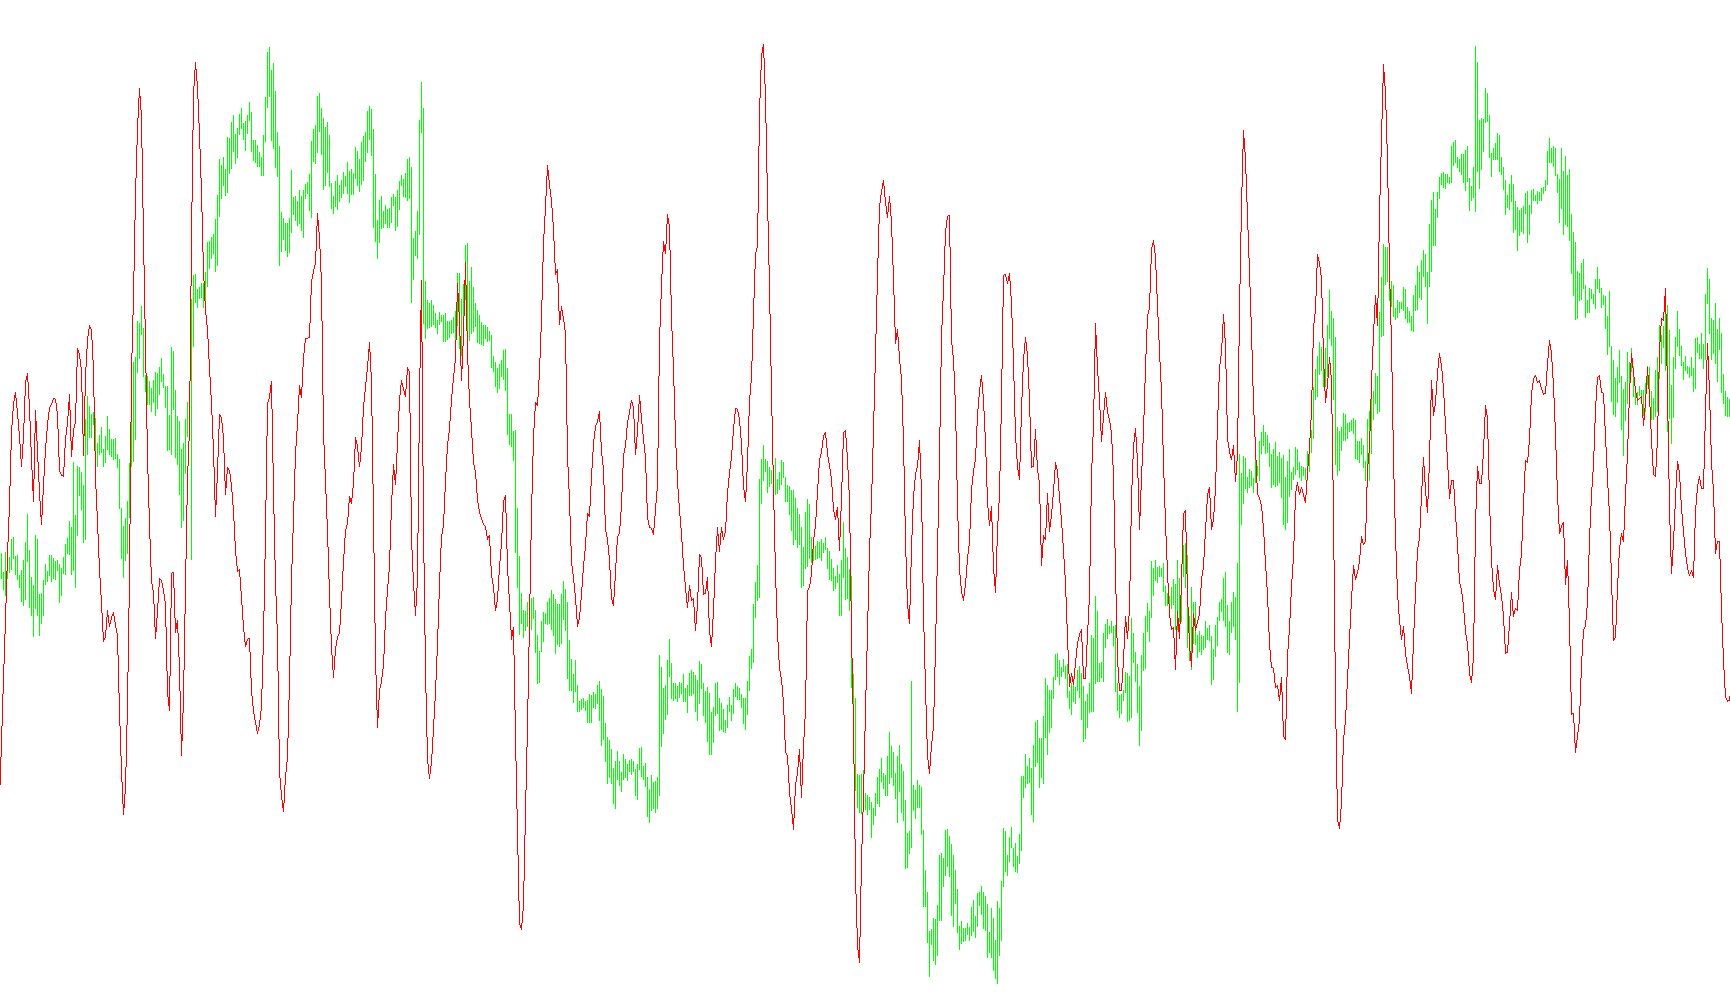
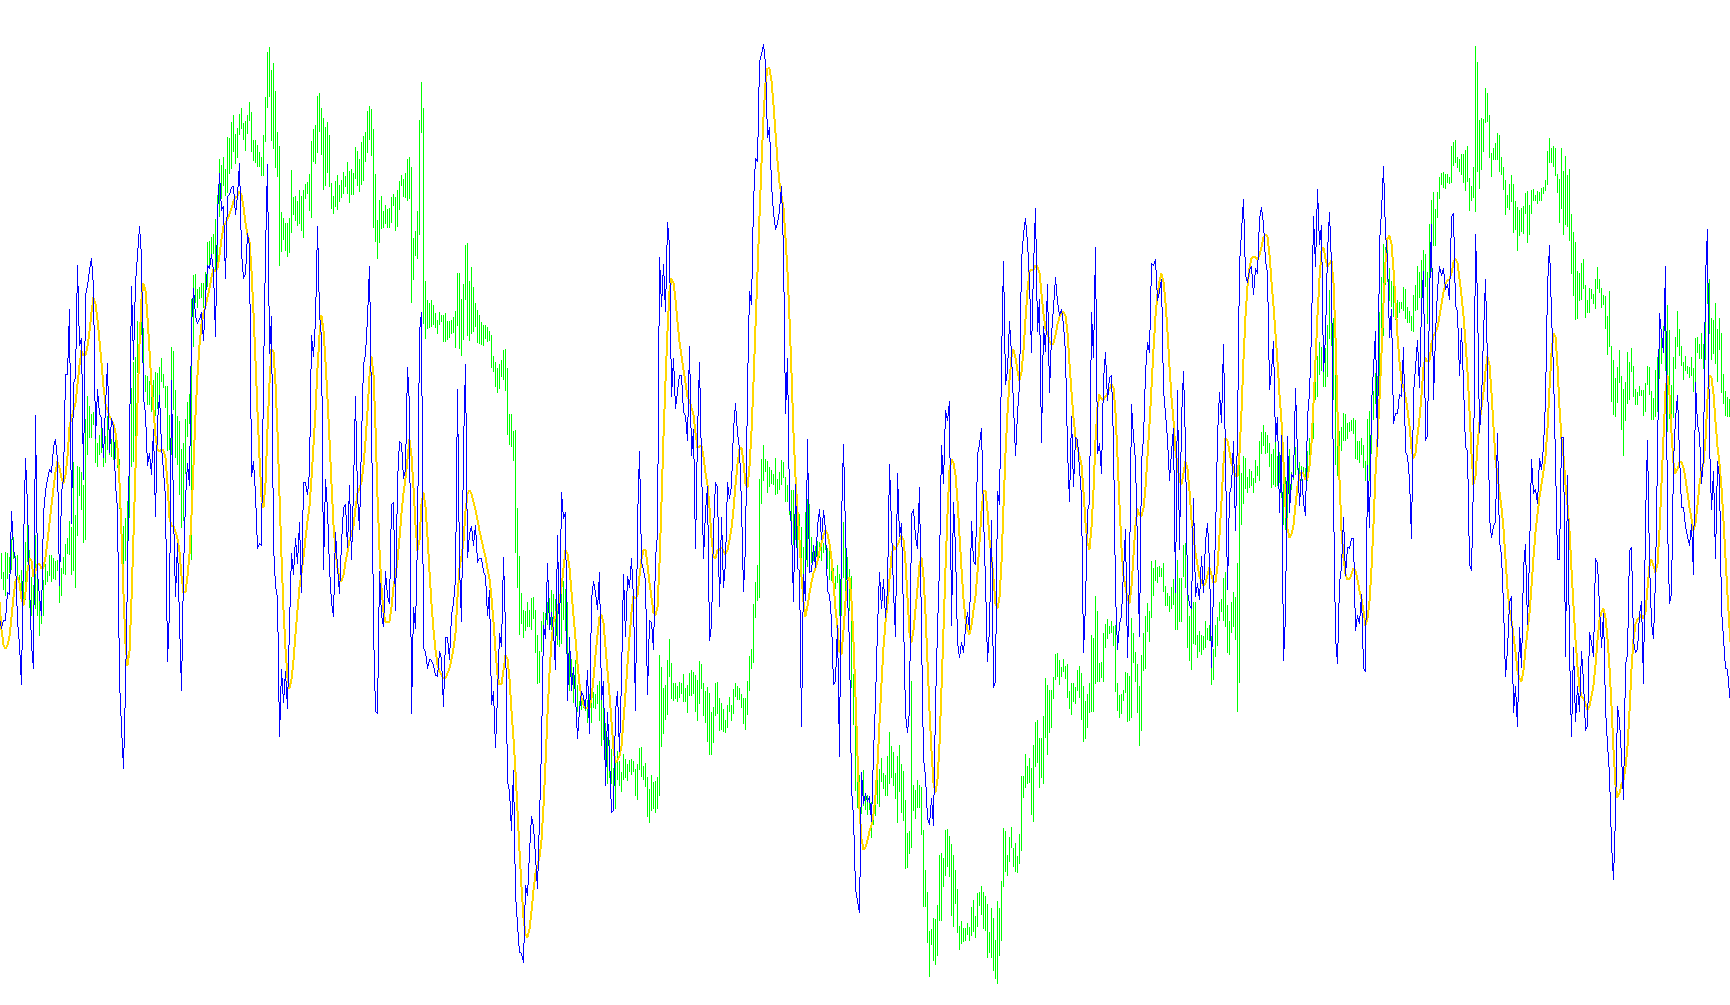
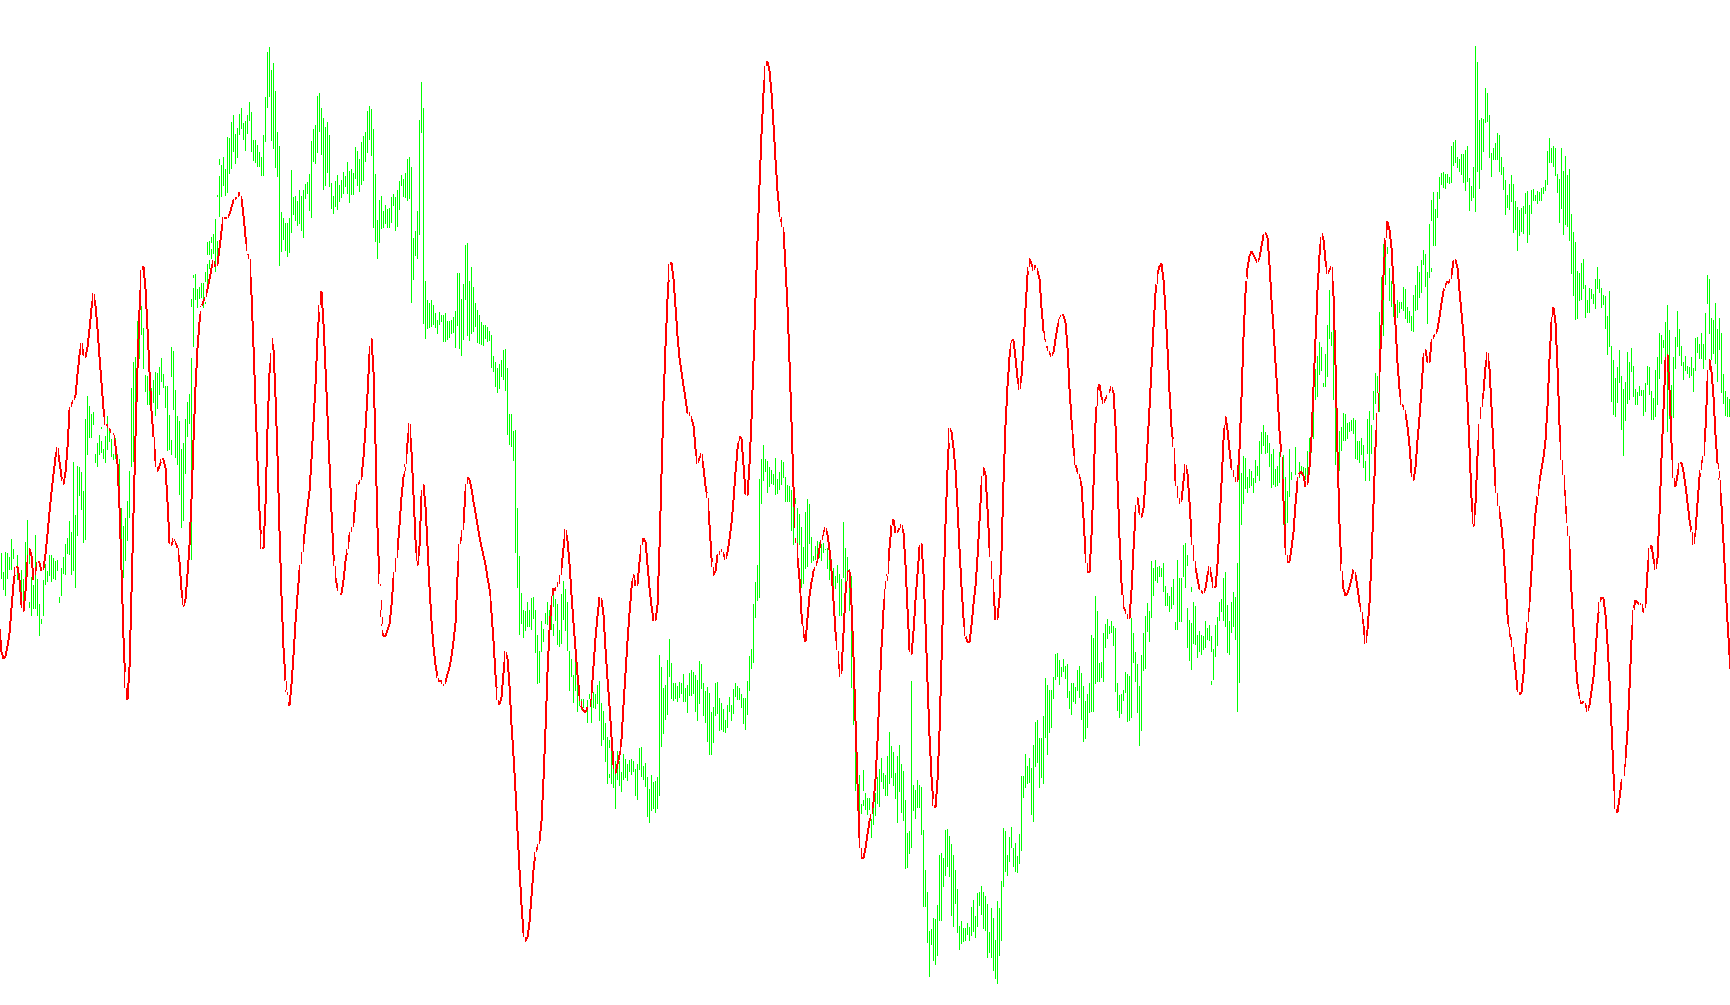
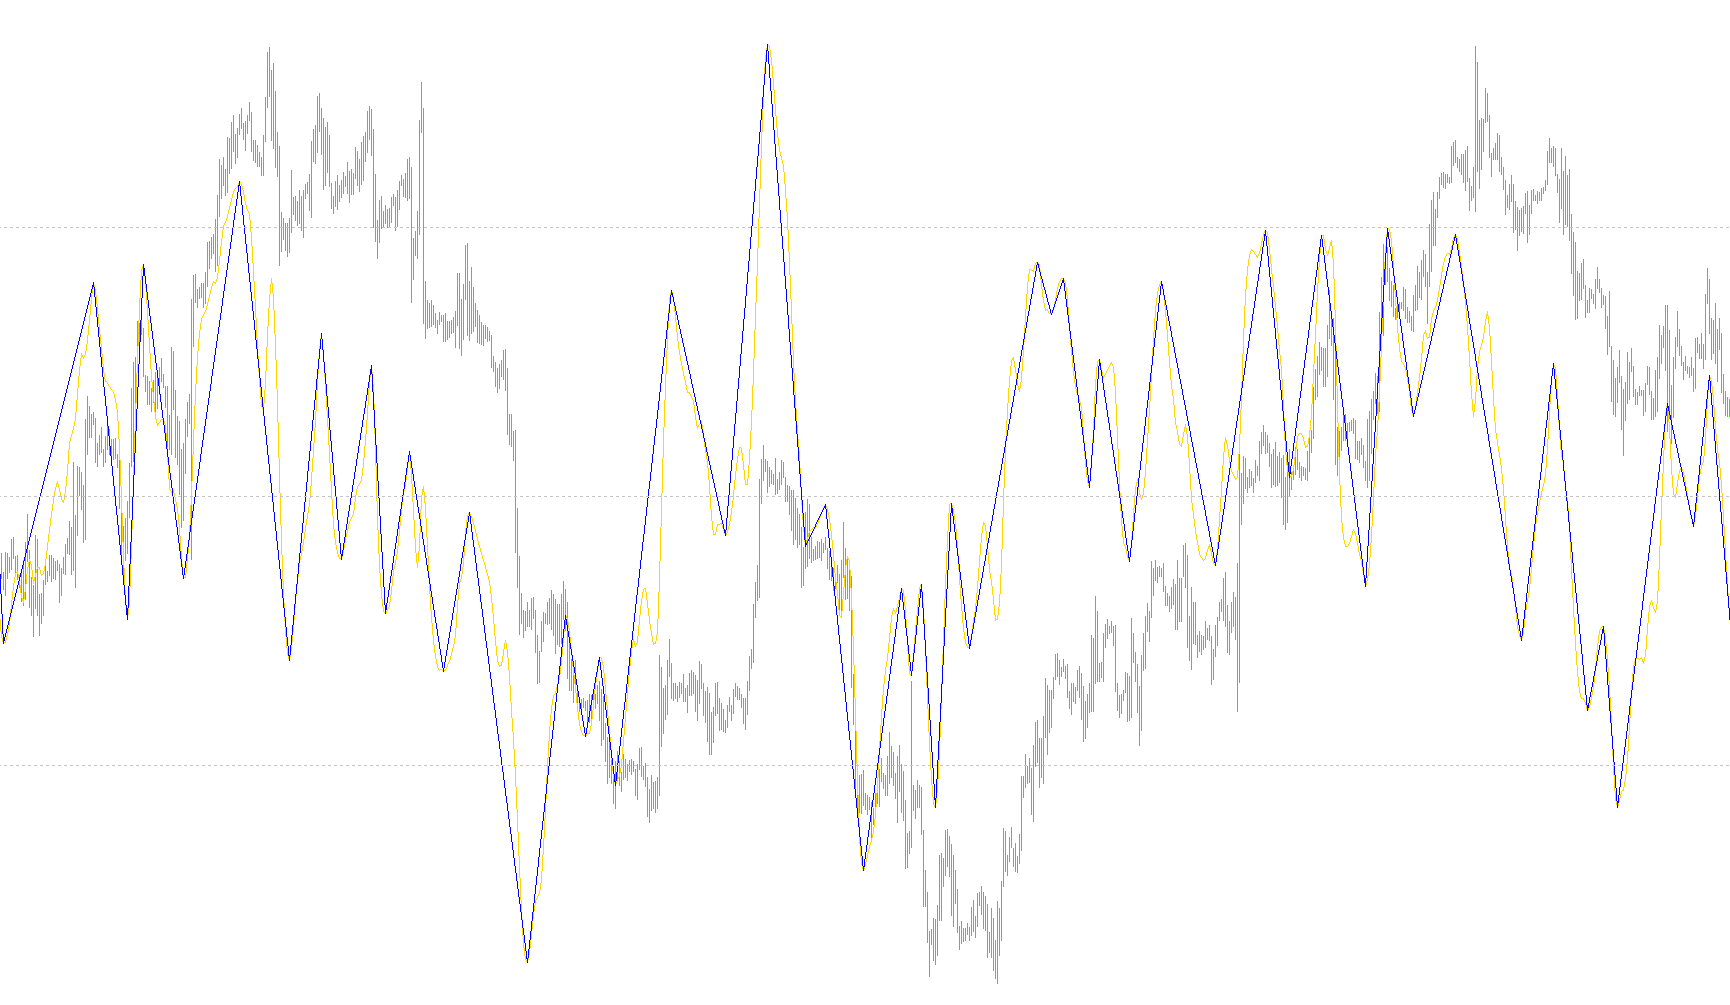
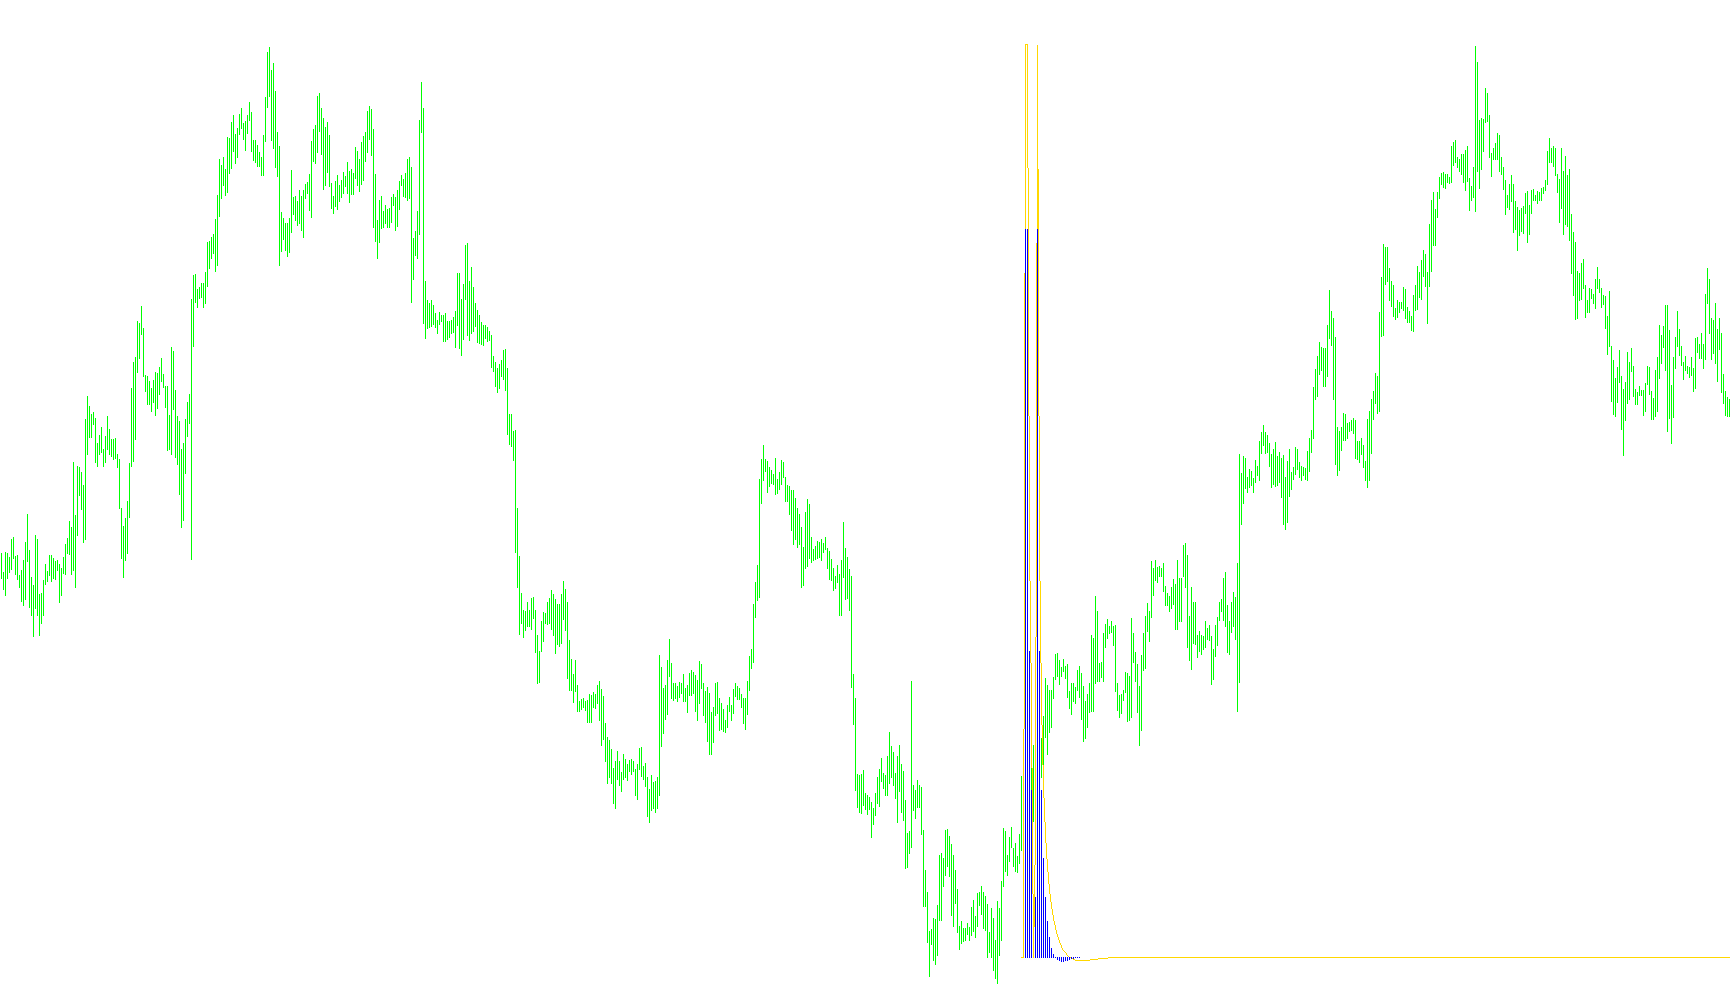
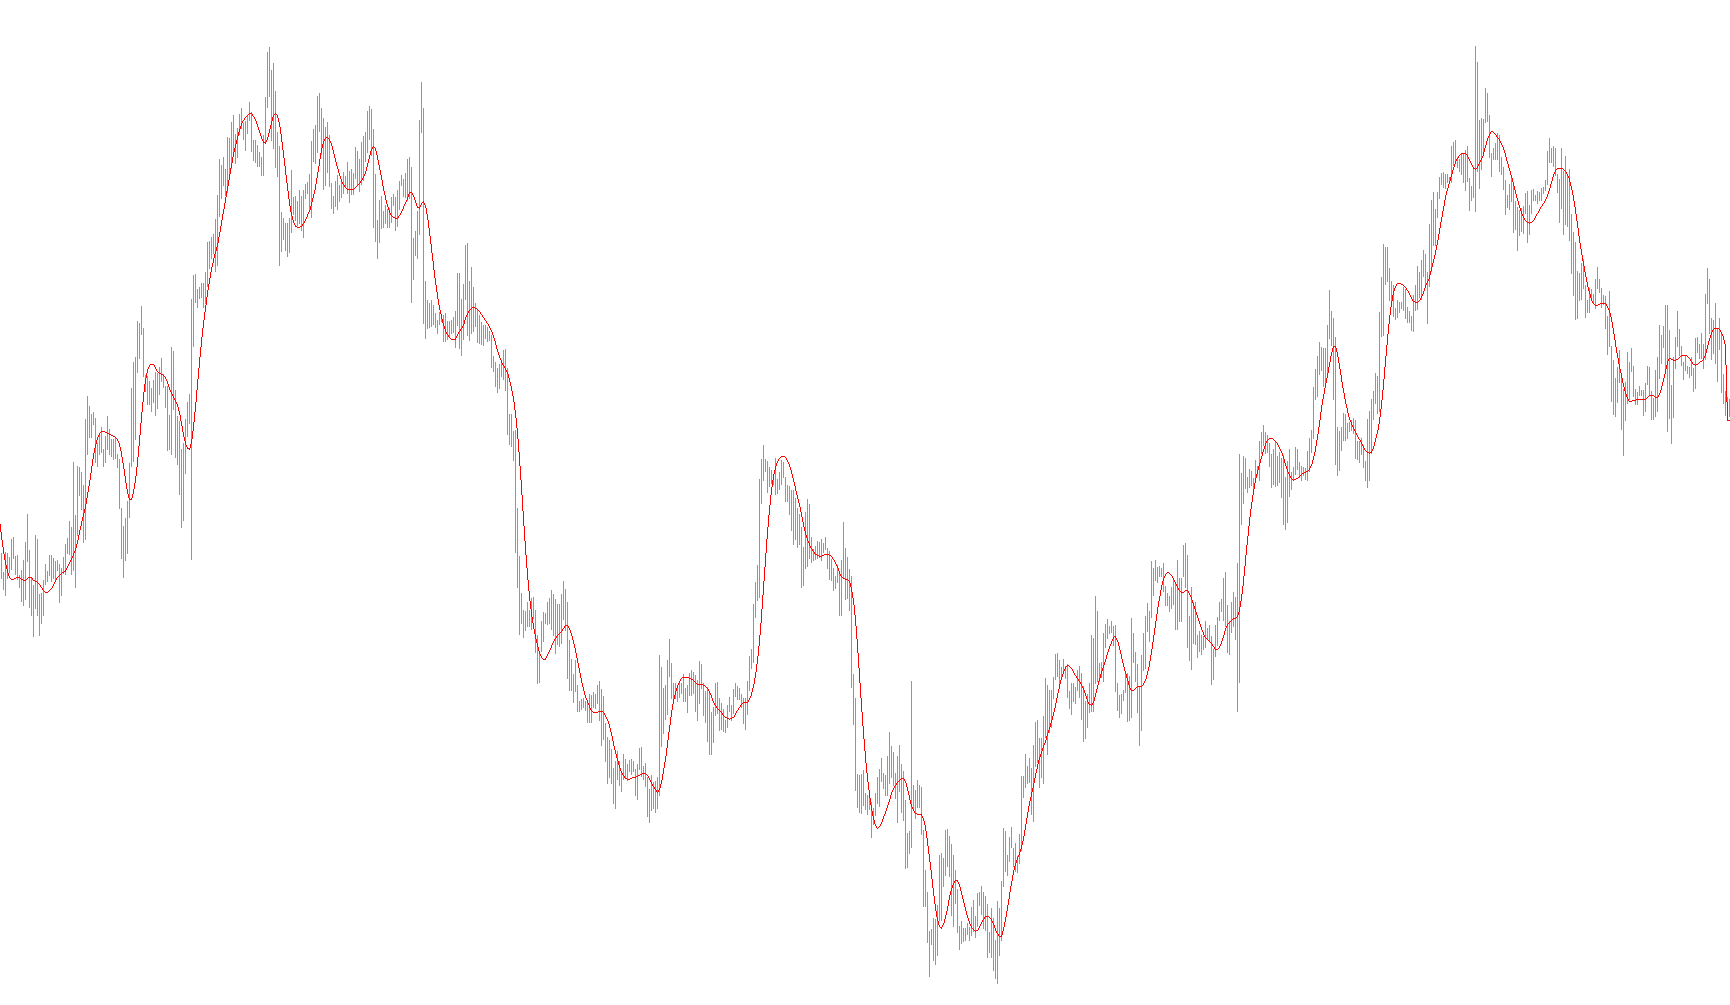
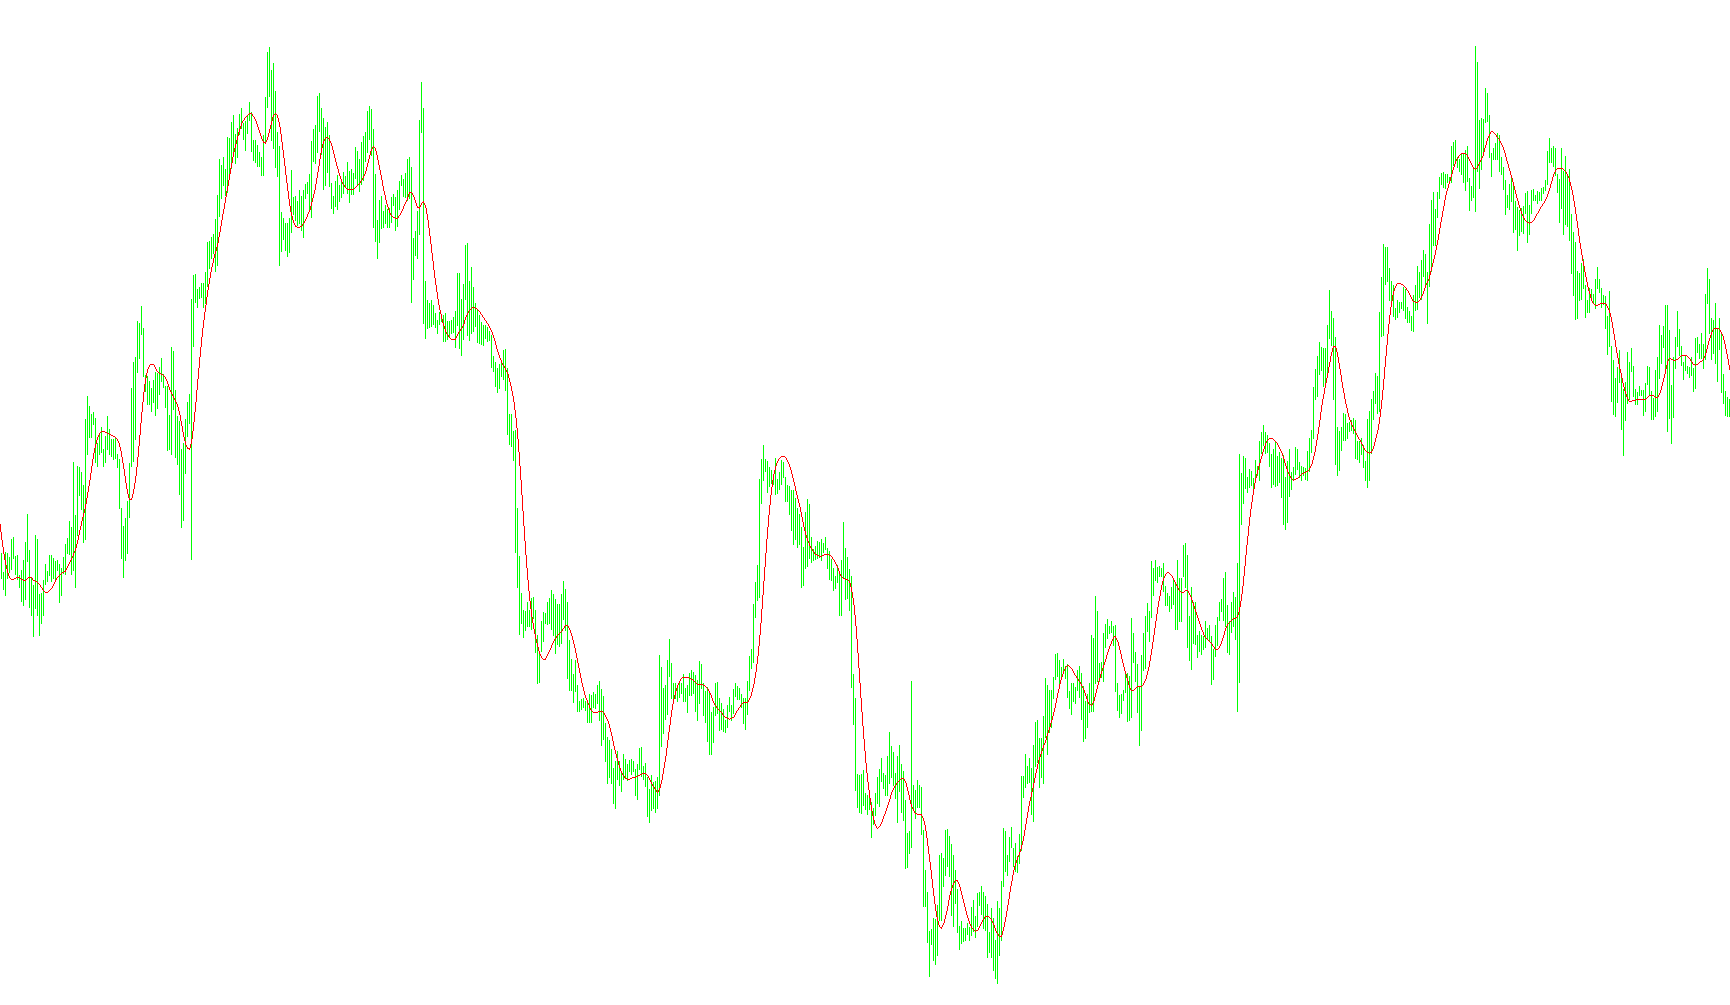
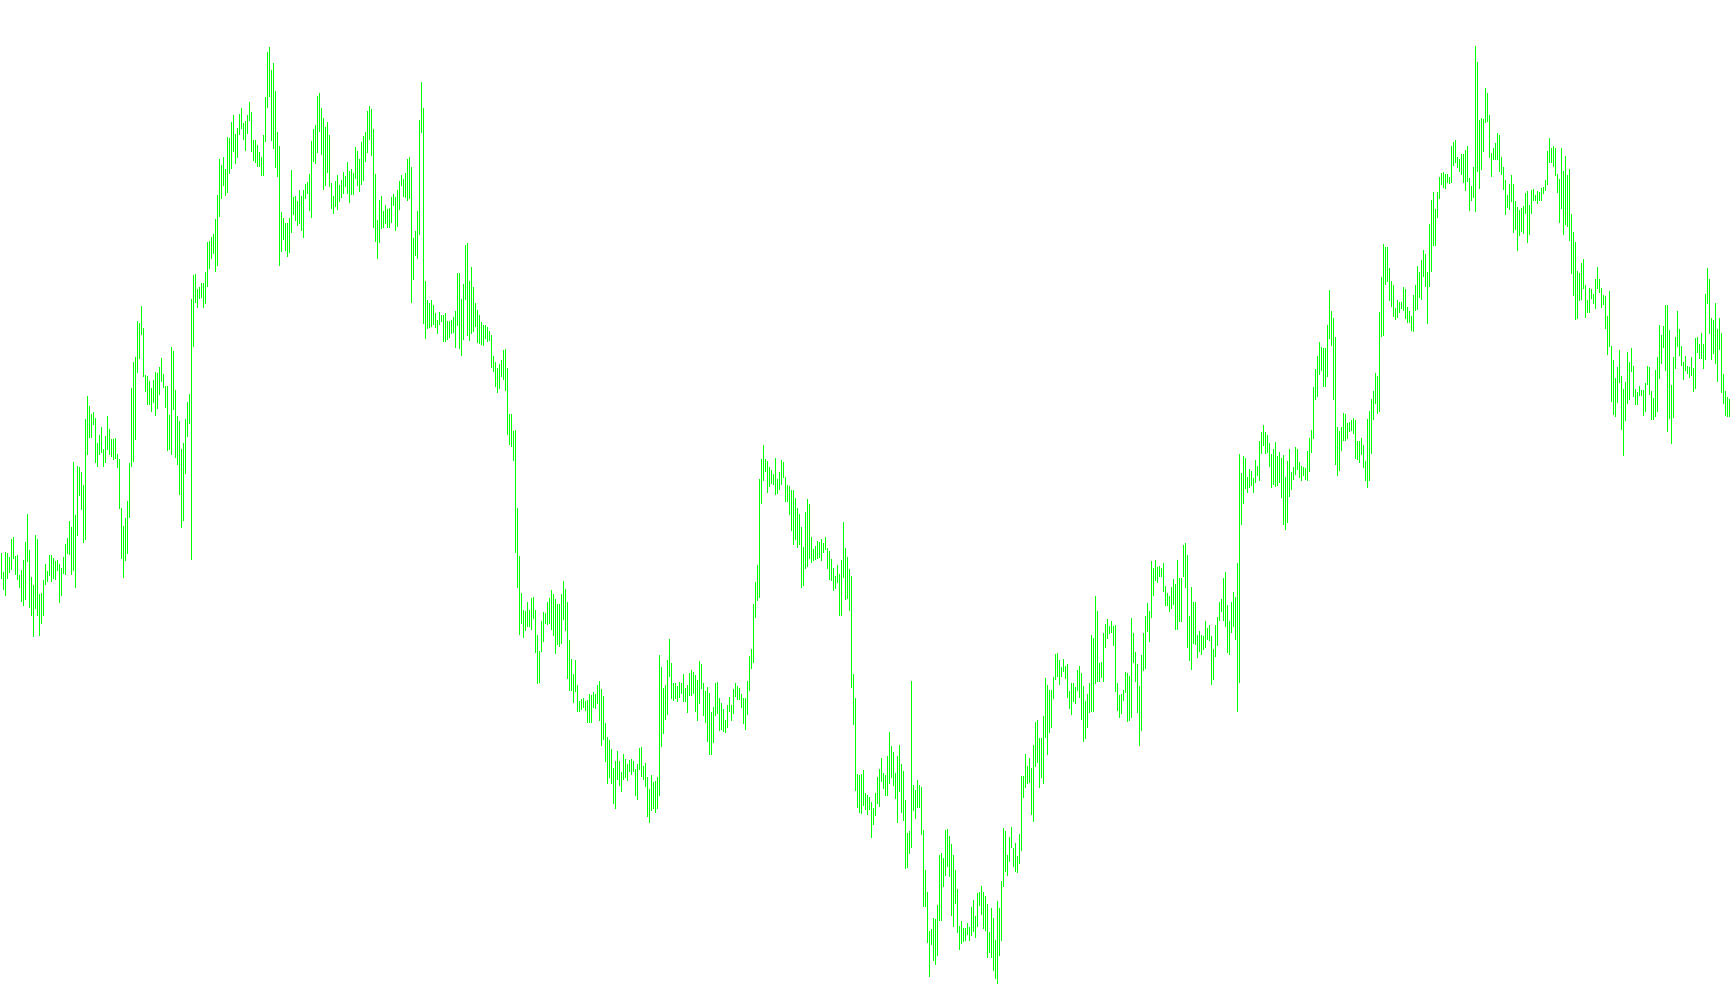
This indicator applies a triple-smoothed T3 filtering algorithm to the differential values of the Aroon Horn oscillator to isolate persistent directional trends.

t3_Aroon_Horn_Osc_v1
Indicator

t3_Aroon_Horn_Osc_v1

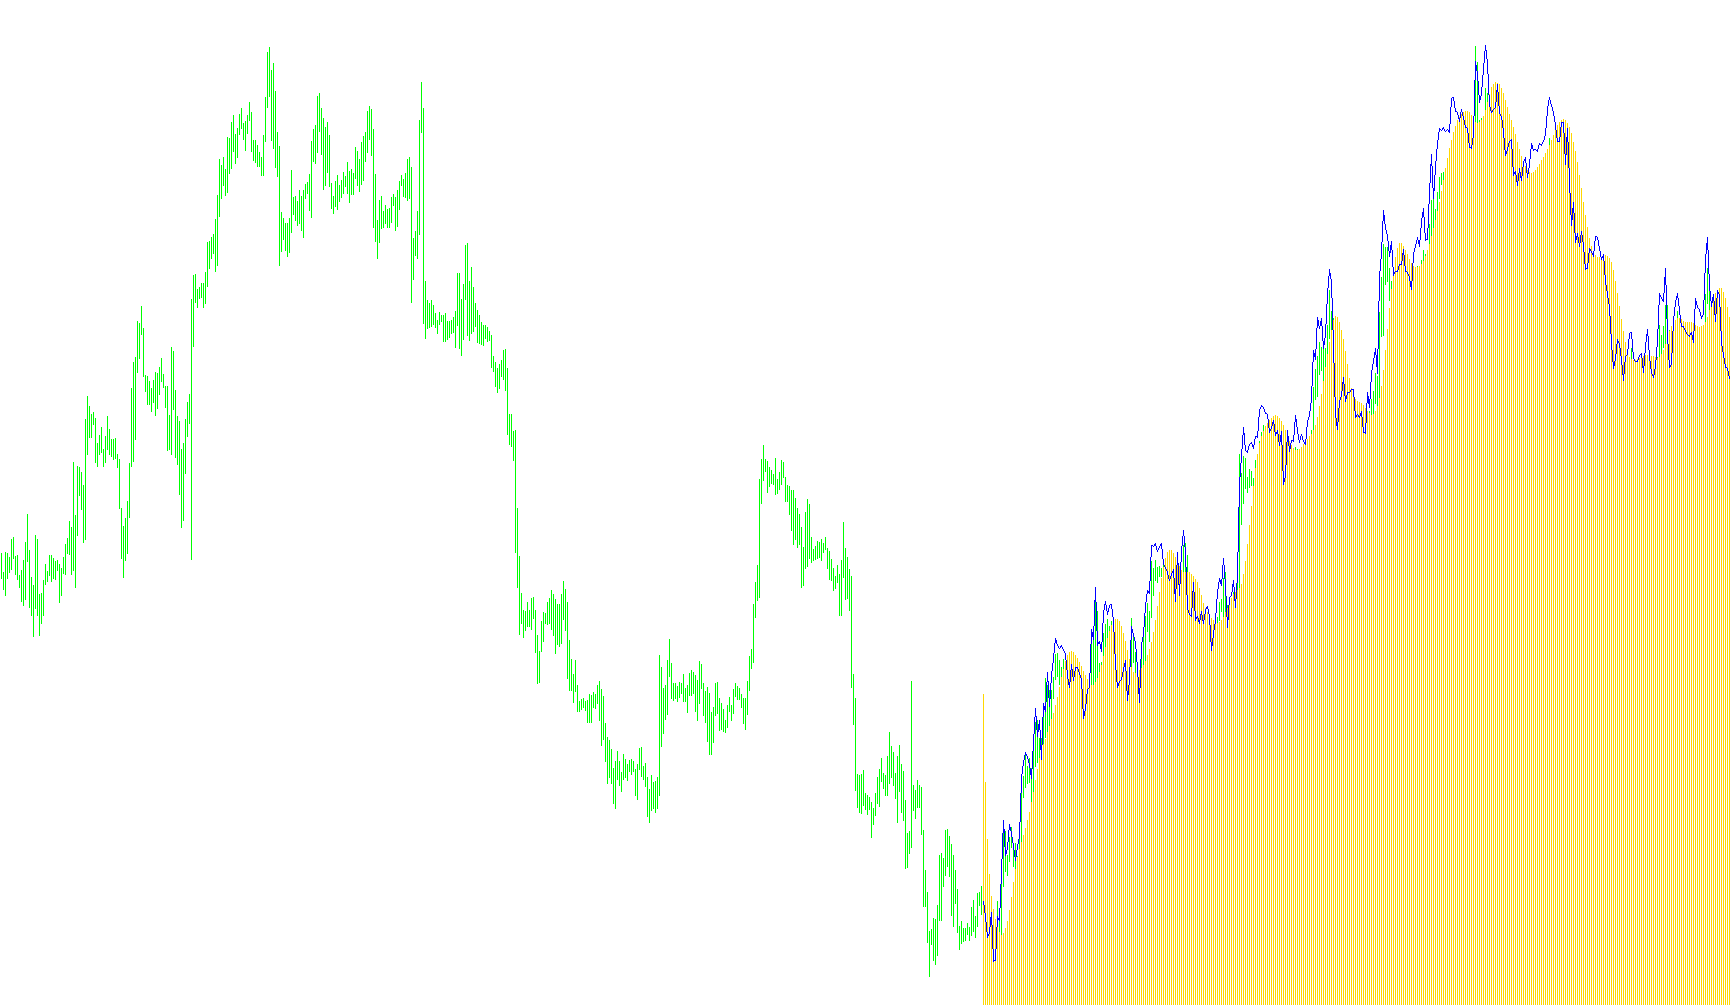
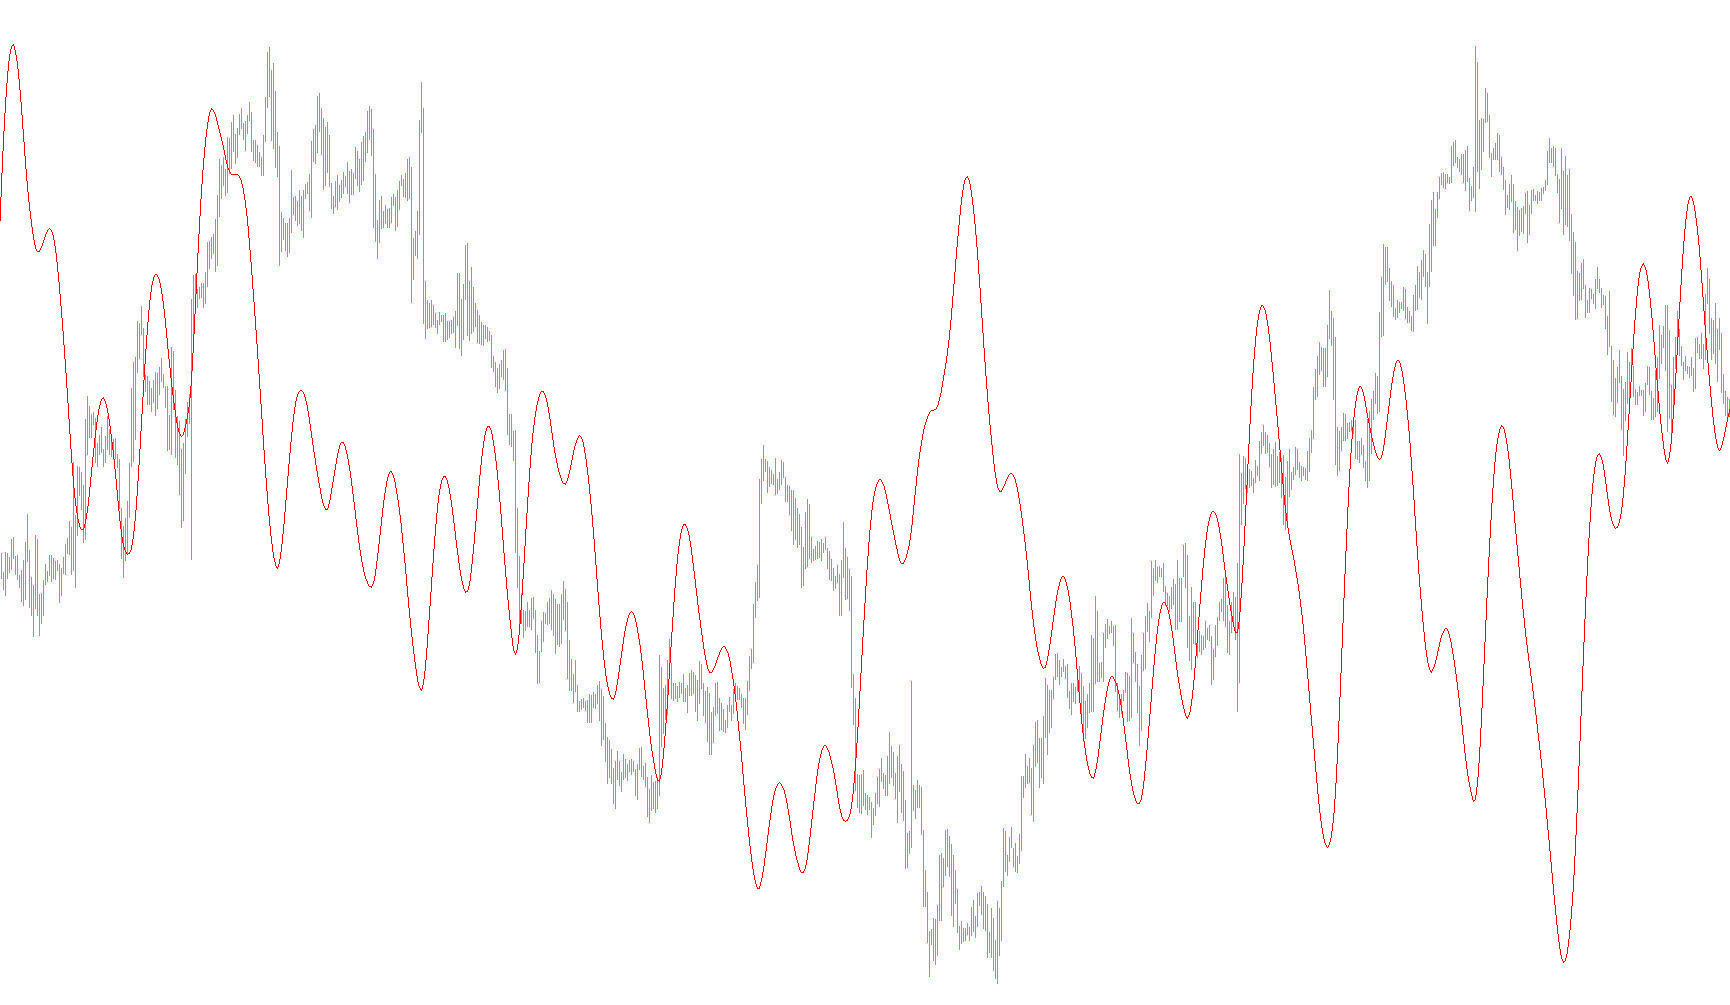
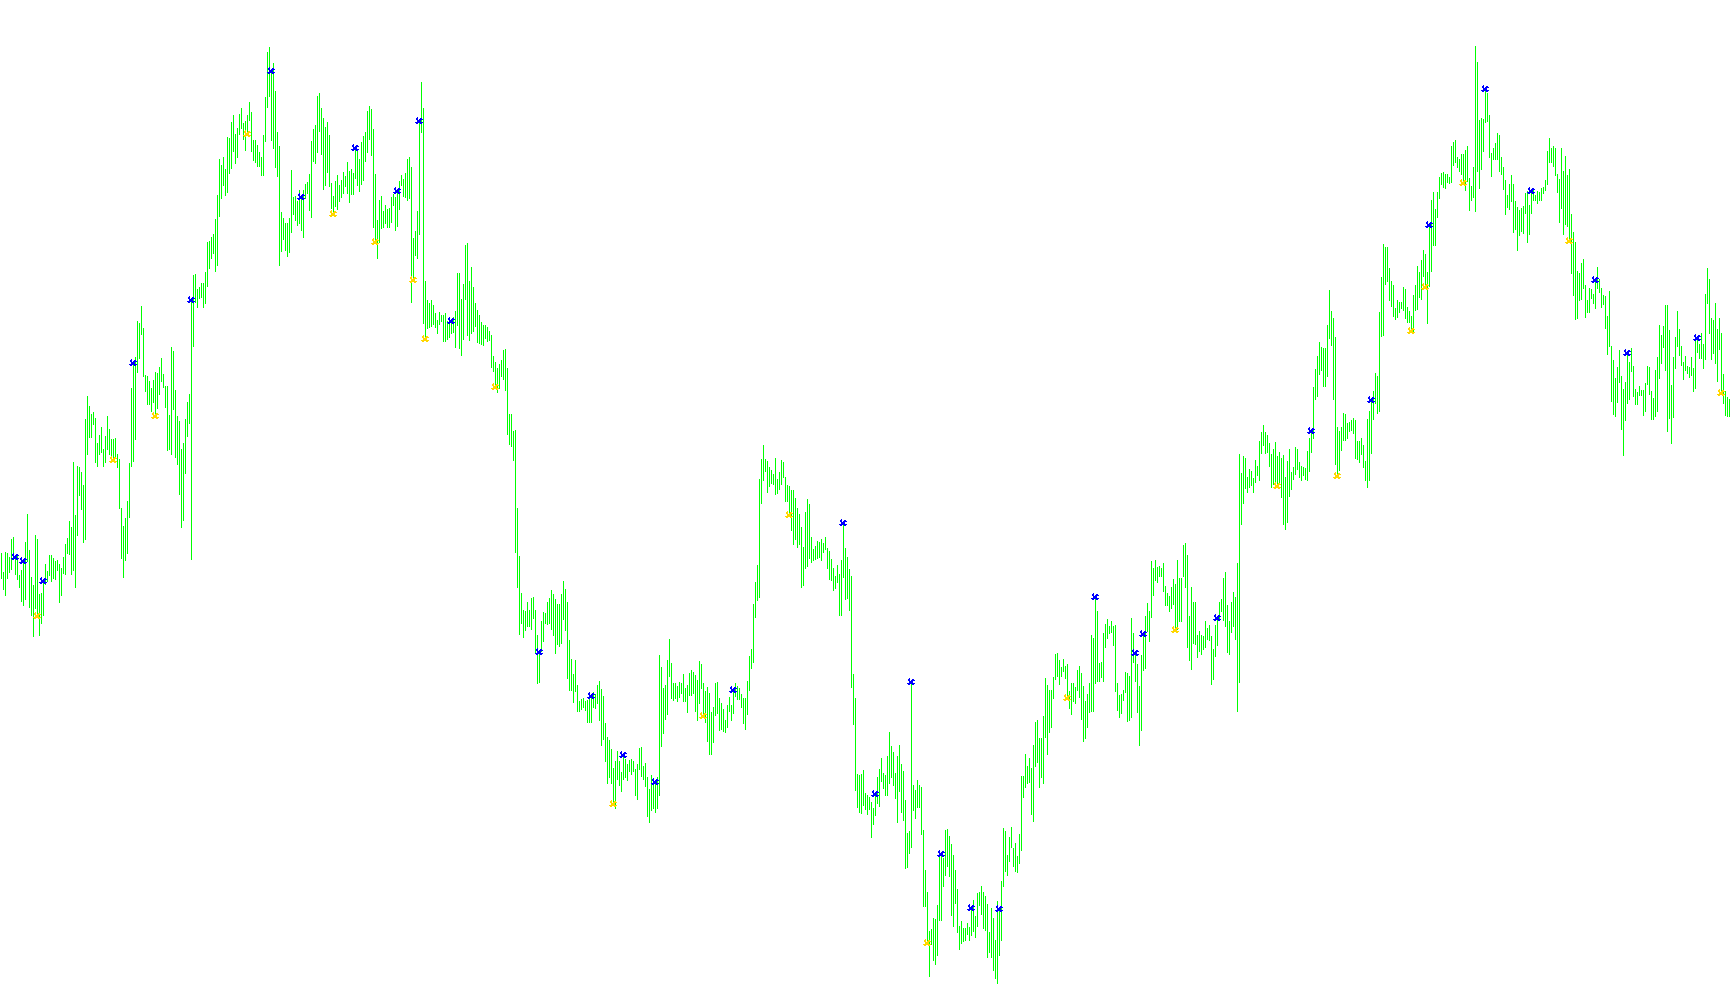
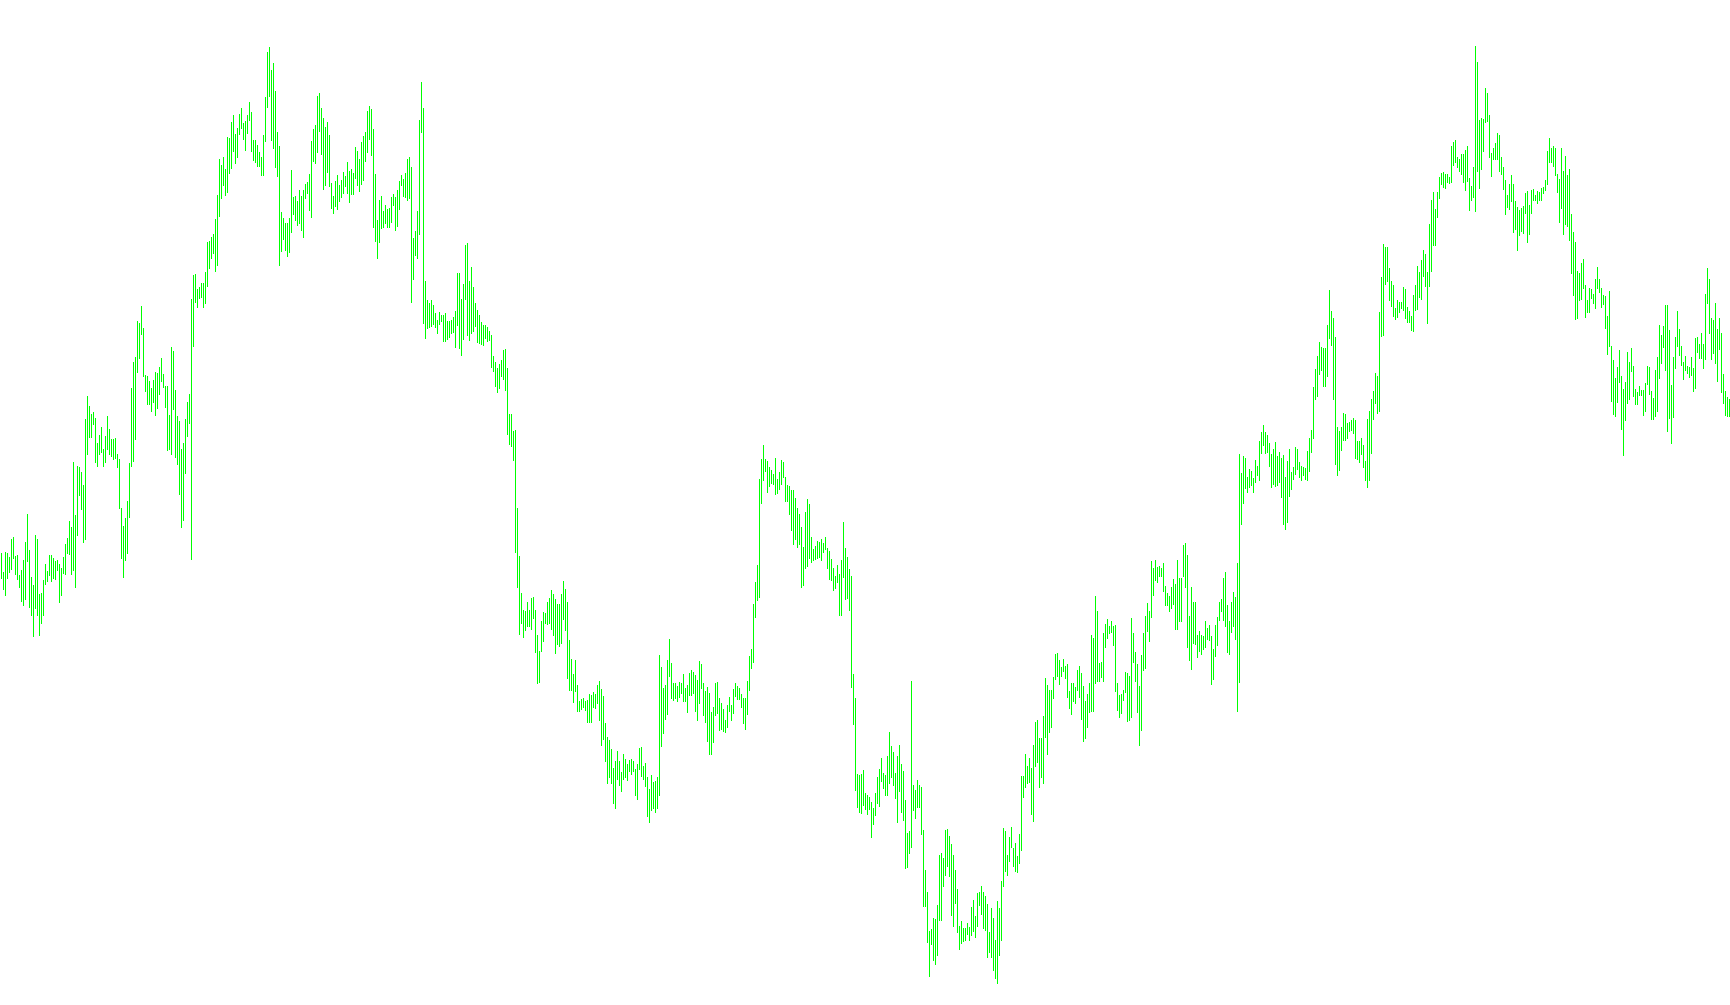
This indicator calculates a smoothed momentum metric by applying a triple exponential moving average (T3) filter to the rate of change between consecutive Aroon Horn values.

t3_Aroon_Horn_v1
Indicator

t3_Aroon_Horn_v1

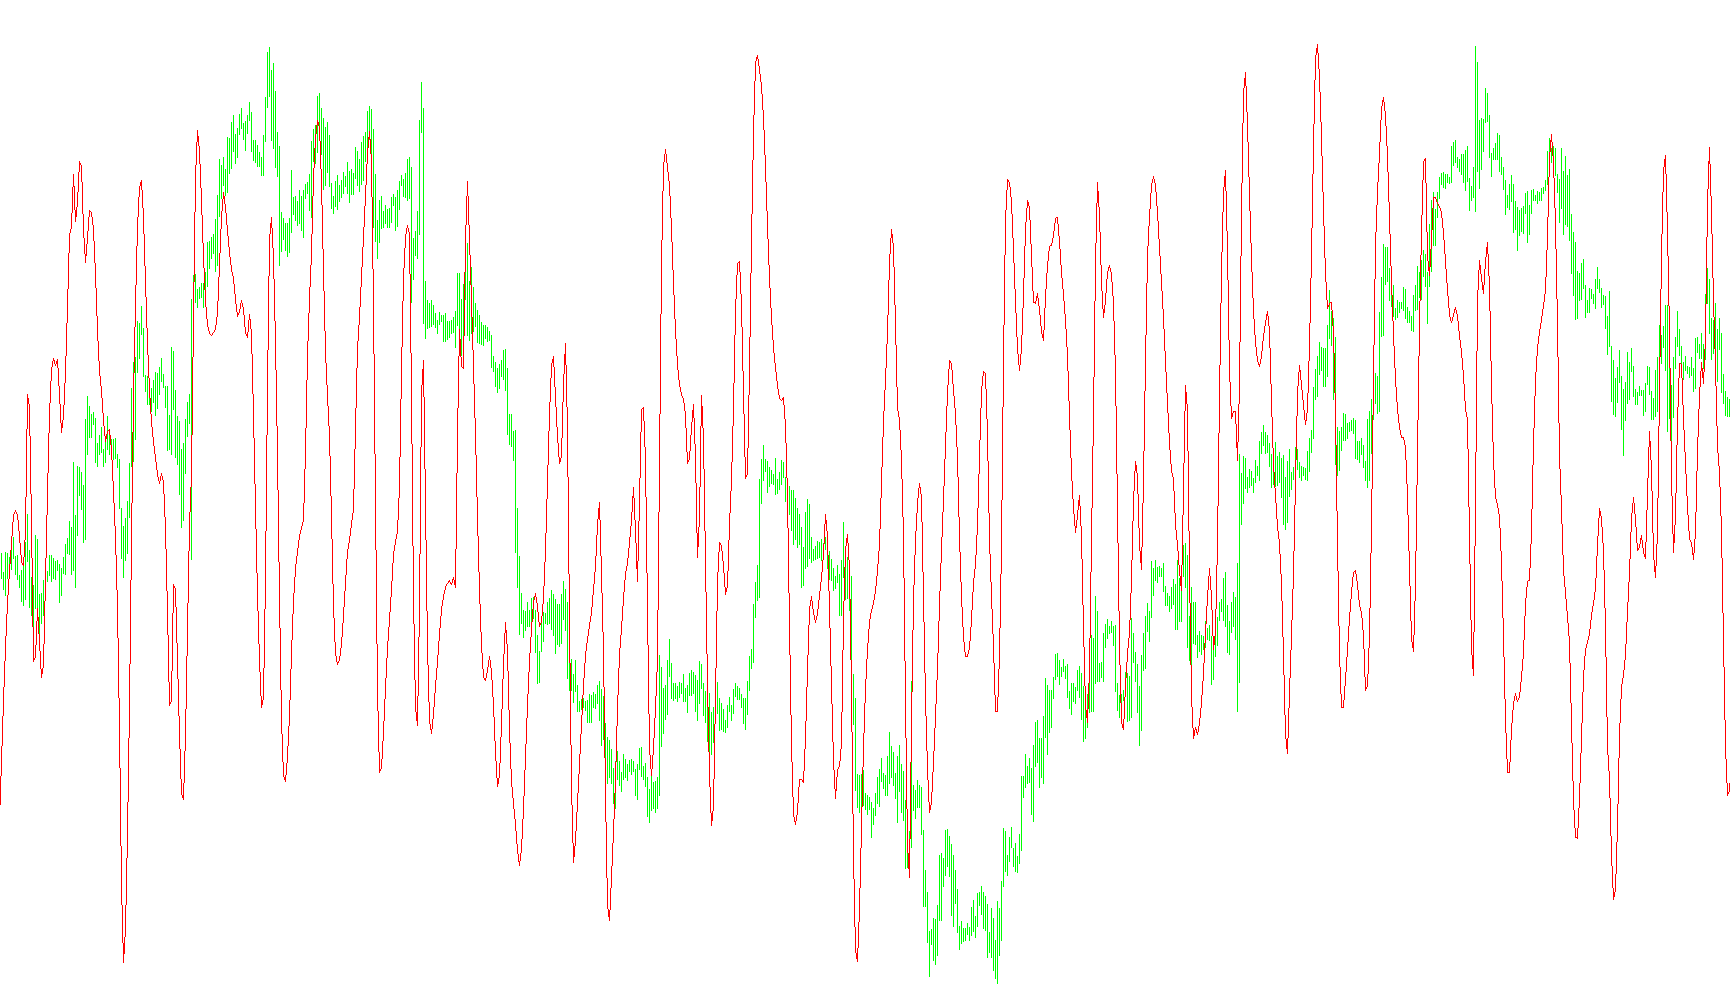
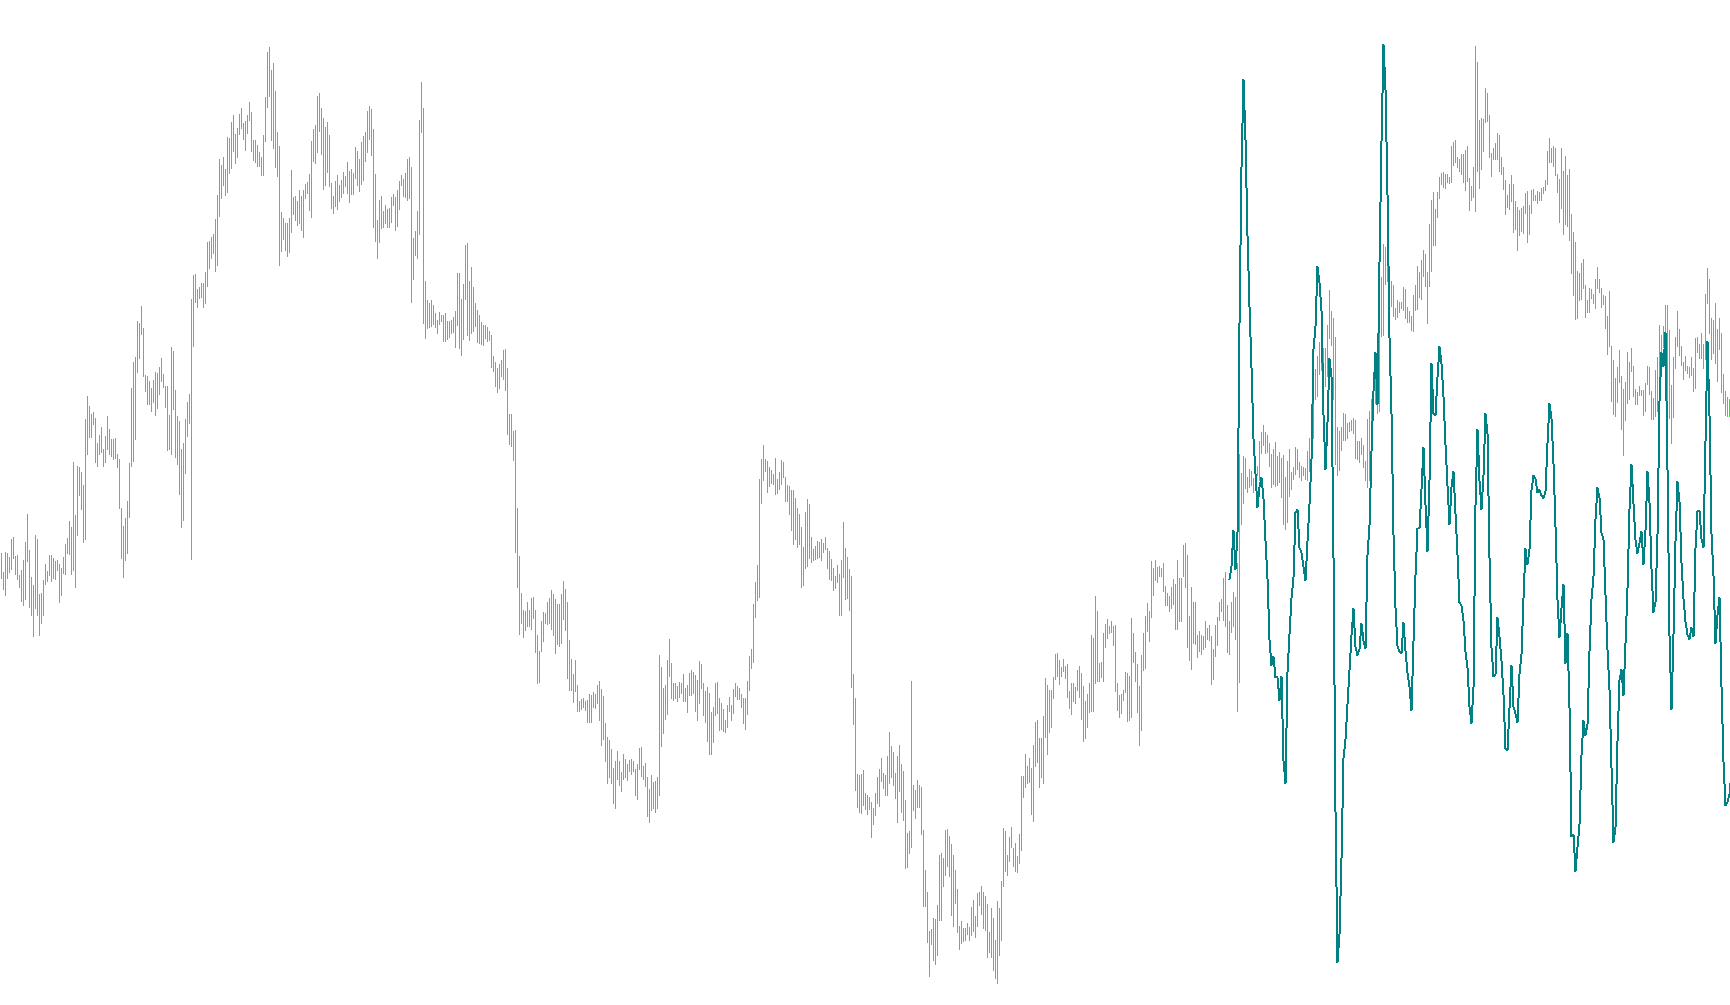
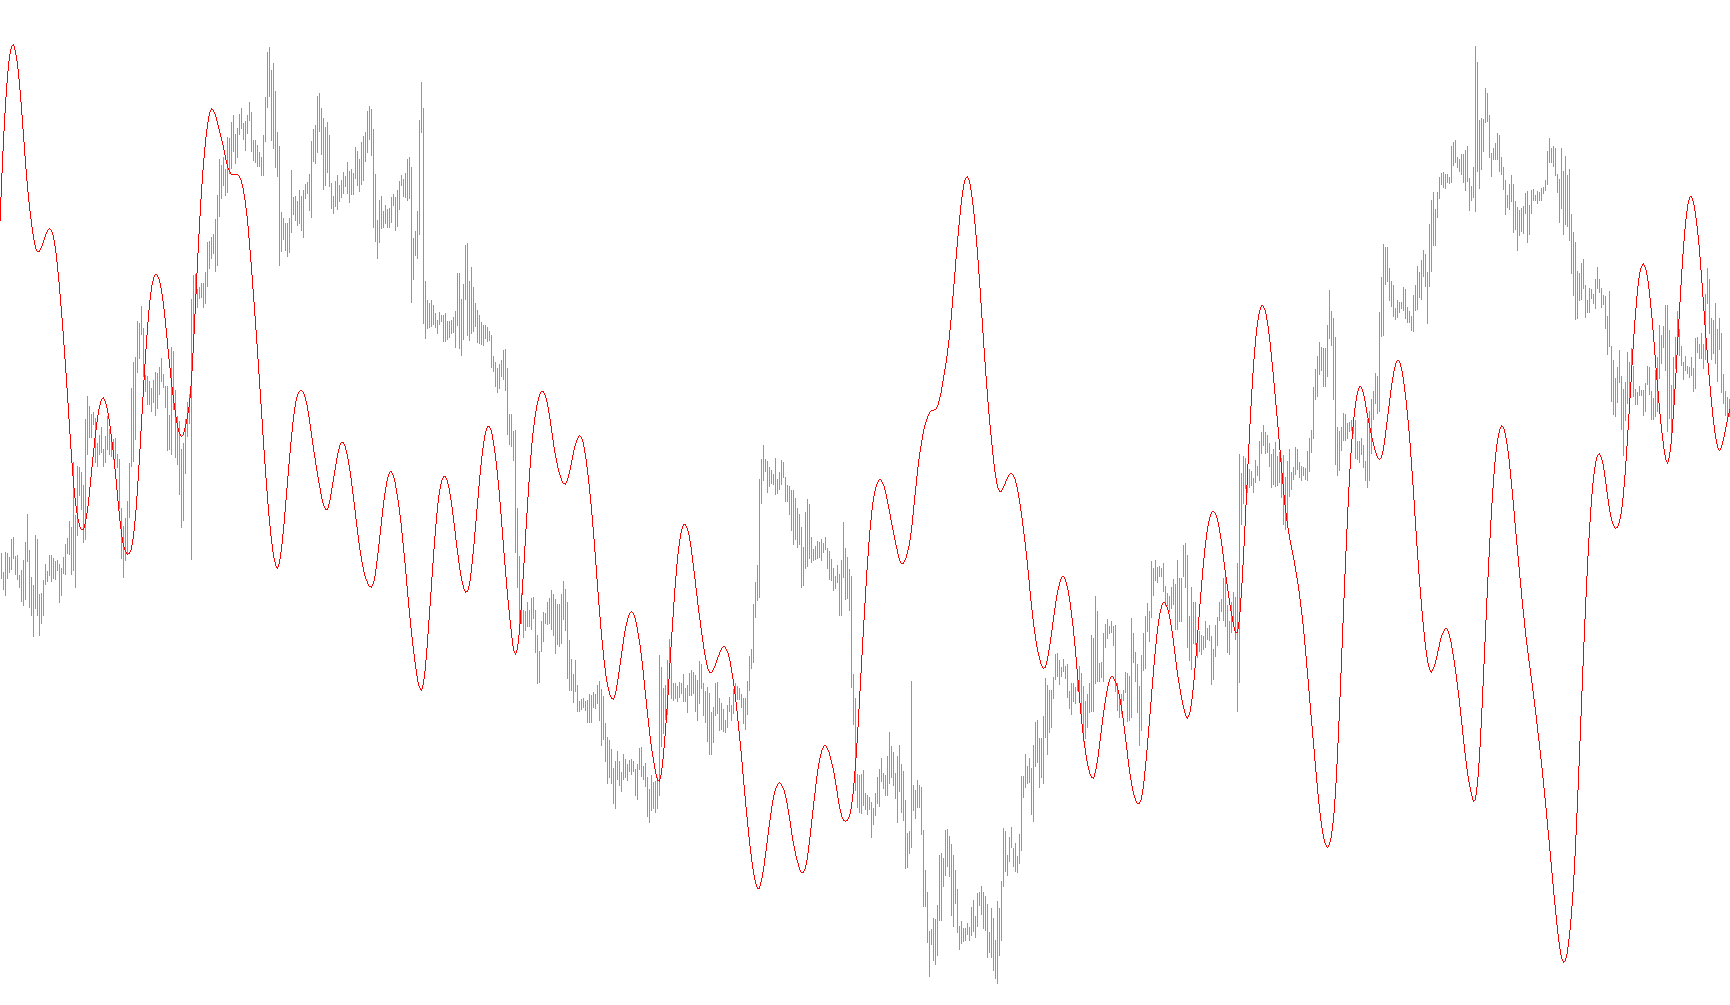
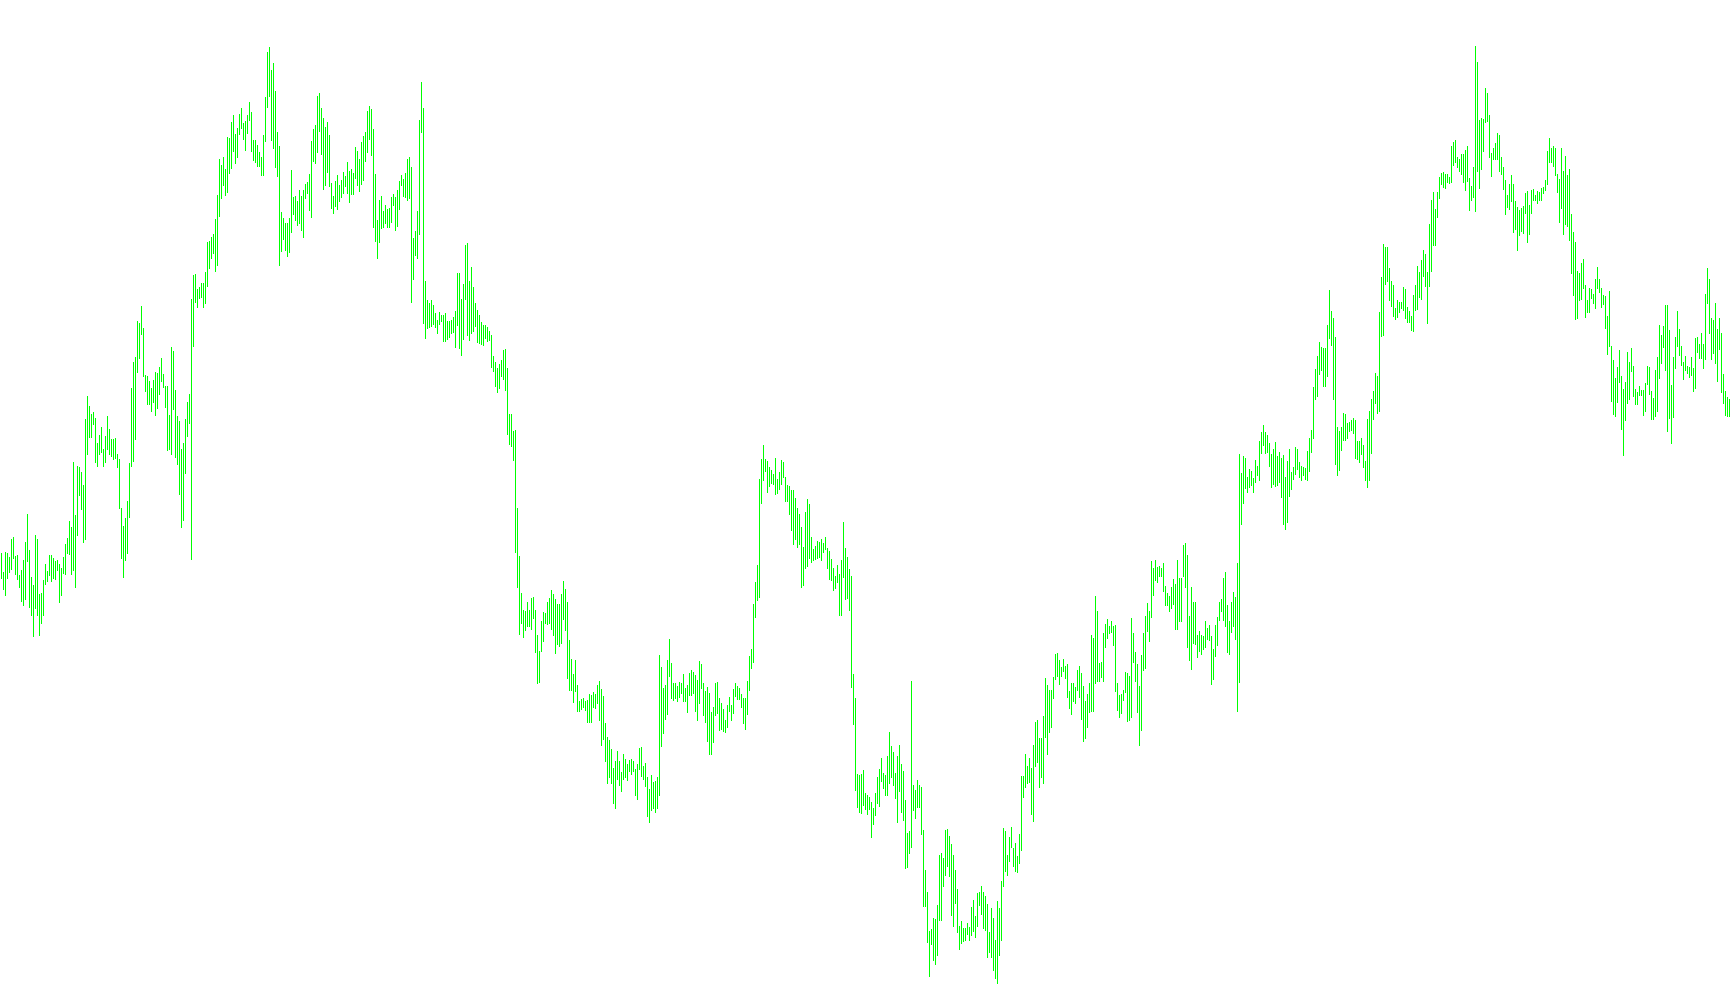
This indicator applies a multi-stage T3 smoothing algorithm to the Aroon Horn signals to reduce noise and identify sustained trend momentum.

T3_CCI
Indicator

T3_CCI

iCCI

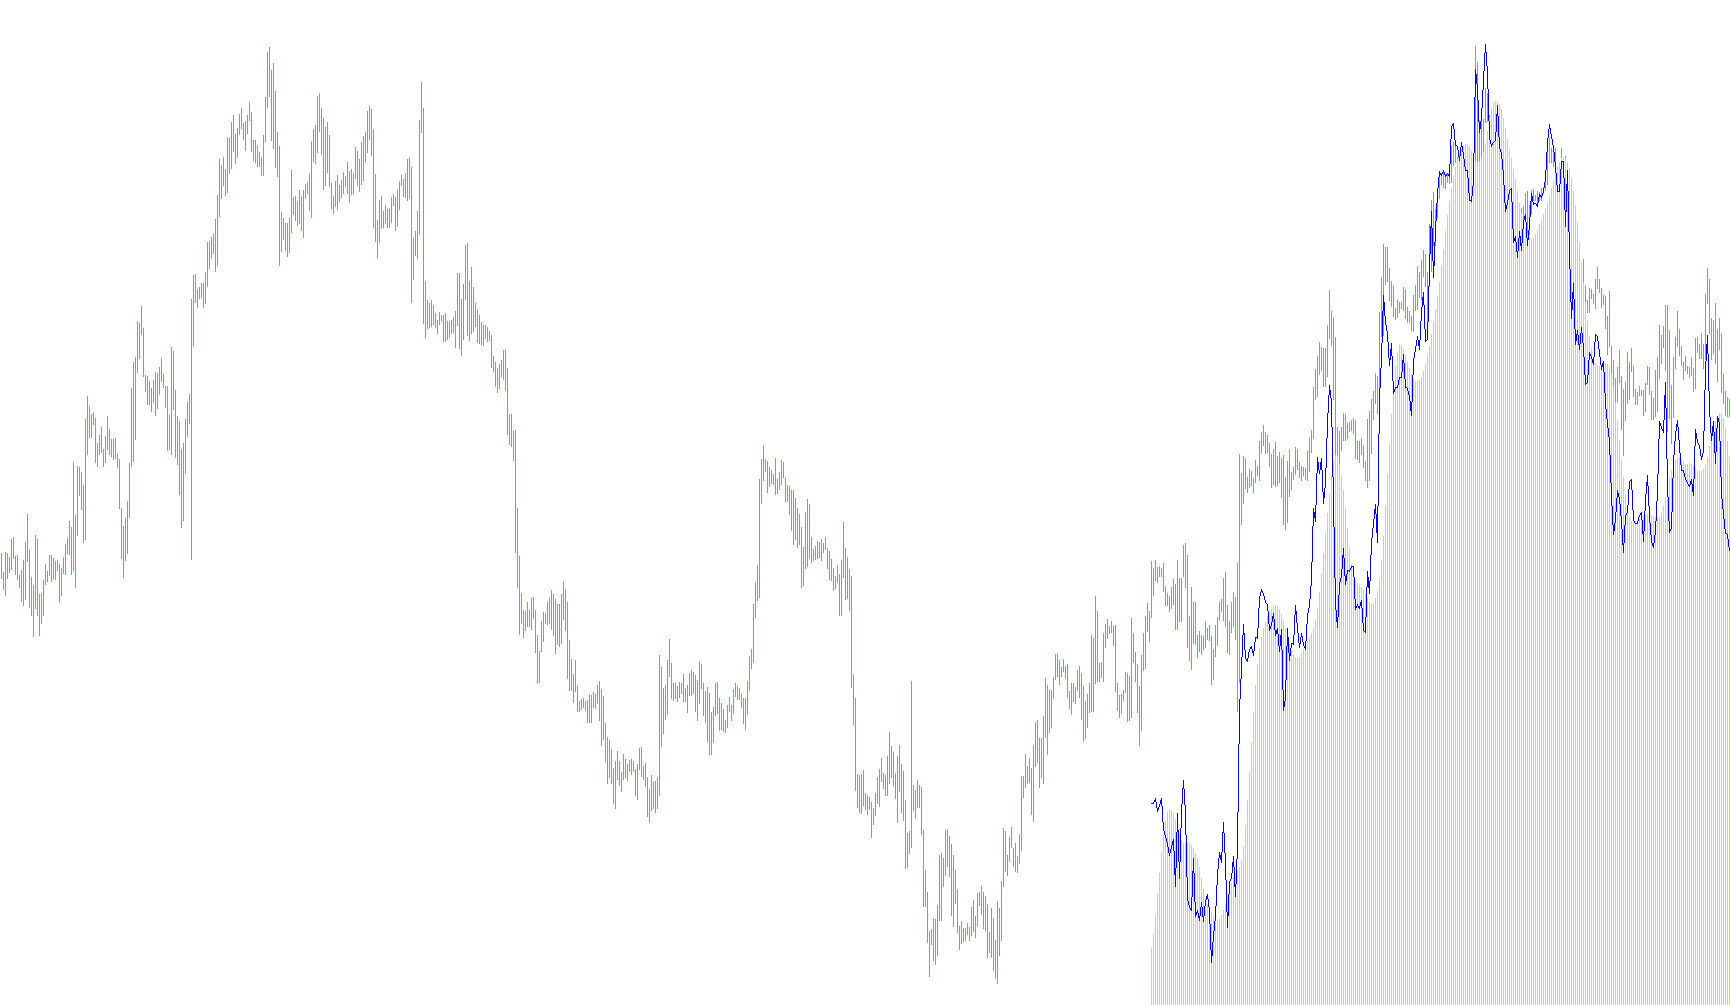
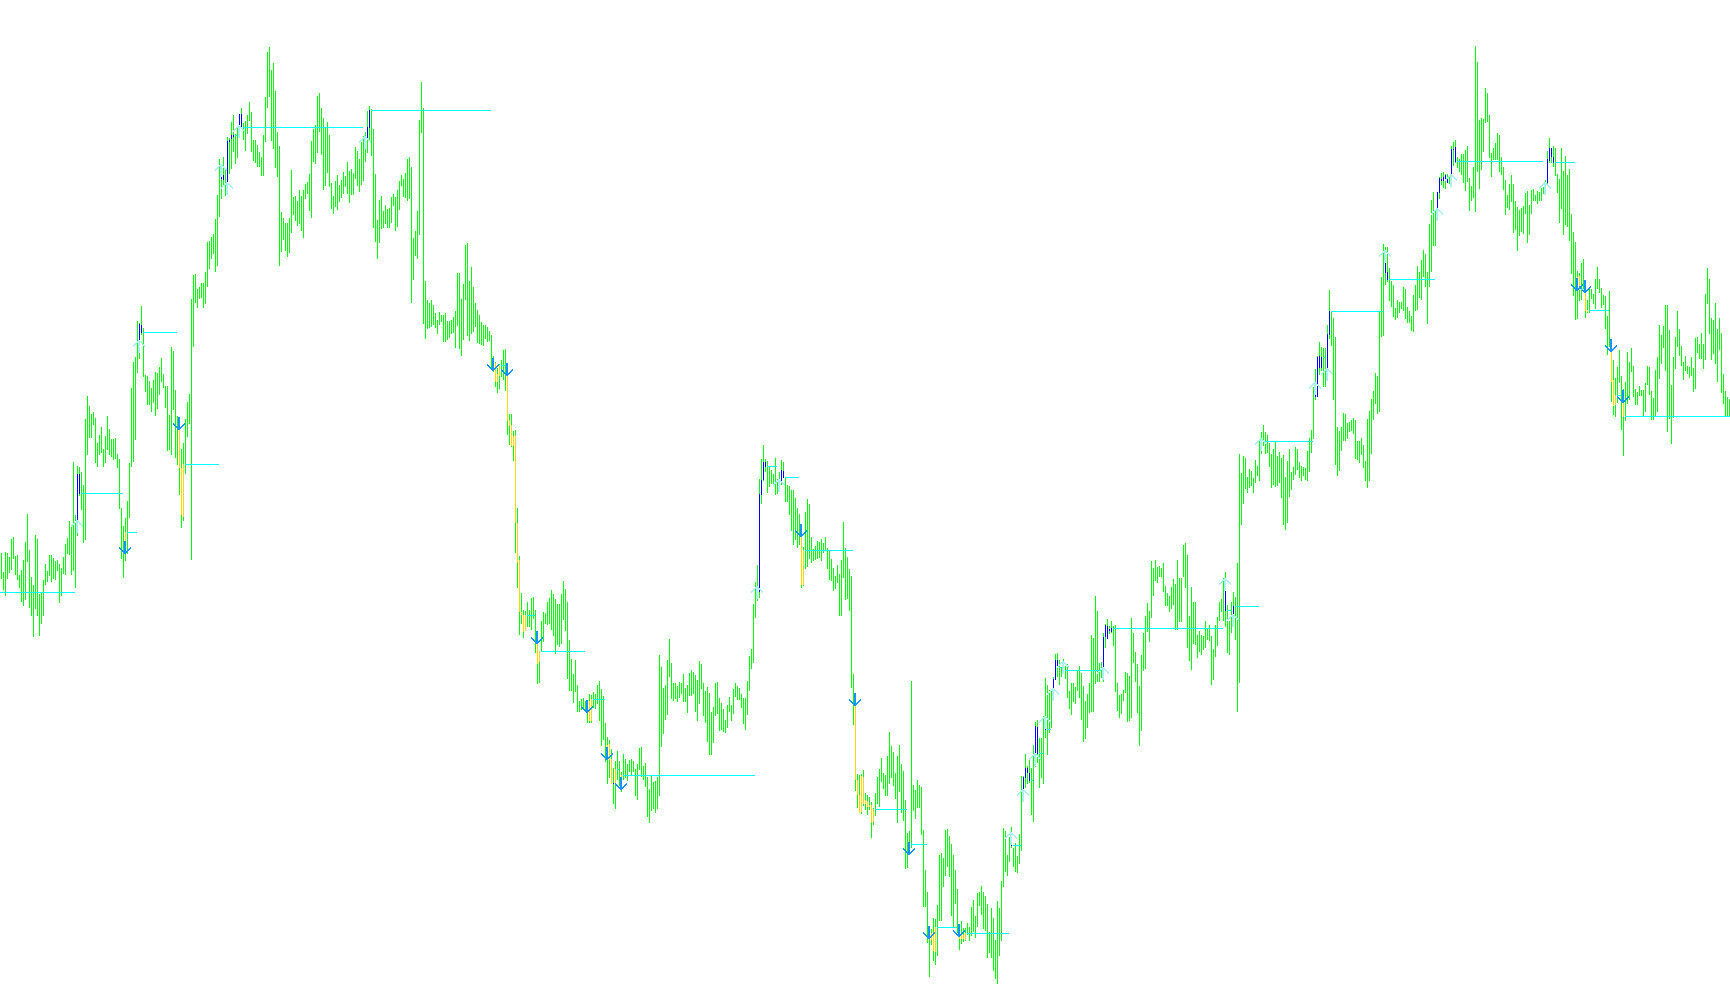
This indicator applies a triple-smoothed moving average filter to the Commodity Channel Index to reduce market noise and identify cleaner price momentum trends.

Indicator

T3_clean

iMA
T3_DPO-v1
Indicator

T3_DPO-v1

iMA

This indicator applies a multi-layered weighted smoothing algorithm to price action to isolate underlying trend momentum while filtering out high-frequency market noise.

T3_DPO-v1_v1
Indicator

T3_DPO-v1_v1

iMA

This indicator calculates a weighted recursive smoothing of the simple moving average to derive high-fidelity momentum signals while filtering out market noise.

T3_DPO-v1_v2
Indicator

T3_DPO-v1_v2

iMA

This indicator utilizes a multi-stage weighted moving average filter combined with polynomial coefficients to smooth price action and identify directional trends.

T3_DPO-v3
Indicator

T3_DPO-v3

iMA

This indicator calculates a high-order smoothing of the simple moving average through recursive weighting to identify trend momentum and price deviations.

T3_HLR
Indicator

T3_HLR

This indicator applies a triple exponential moving average filter to the Highest-Low Range data to eliminate market noise and identify structural momentum.

T3_iAnchMom
Indicator

T3_iAnchMom

This indicator calculates a smoothed momentum percentage by determining the relative difference between two nested T3 weighted moving averages.

T3_iAnchMom2
Indicator

T3_iAnchMom2

Calculates a momentum percentage by determining the relative divergence between two nested T3 moving average smoothing layers applied to price action.

T3_iAnchMom_hist
Indicator

T3_iAnchMom_hist

This indicator calculates a relative momentum value by determining the ratio between two distinct multi-stage Triple Exponential Moving Average (T3) structures.

T3_iAnchMom_hist_v1
Indicator

T3_iAnchMom_hist_v1

This indicator calculates the relative momentum by comparing two distinct T3 moving average signals to determine trend velocity and directional strength.

T3_iAnchMom_v1
Indicator

T3_iAnchMom_v1

This indicator quantifies price velocity by calculating the relative percentage difference between a smoothed T3 triple-exponential moving average and an anchored linear regression component.

T3_iAnchMom_v2
Indicator

T3_iAnchMom_v2

This indicator calculates a relative momentum value by determining the percentage variance between dual-layered T3 moving averages with varying smoothing weights.

T3_MA
Indicator

T3_MA

This algorithm employs a nested recursive filtering technique utilizing the Golden Ratio to calculate a highly smoothed price average through sequential exponential decay layers.

T3_MACO
Indicator

T3_MACO

iMA

This indicator utilizes a recursive triple-smoothing algorithm on the differential between fast and slow exponential moving averages to filter market noise and identify underlying momentum trends.

T3_MACO_v1
Indicator

T3_MACO_v1

iMA

This indicator synthesizes multi-stage recursive smoothing and weighted exponential averages to derive a polynomial momentum signal from price differentials.

T3_MA_Nick
Indicator

T3_MA_Nick

iMAiMAOnArray

A high-order smoothing algorithm that applies recursive exponential moving averages to minimize price noise and reduce lag through a polynomial weighting coefficient.

T3_Momentum_Burst
Indicator

T3_Momentum_Burst

iMomentum

This indicator synthesizes a multi-stage smoothing algorithm by applying iterative T3 weighted averages to momentum deviations, scaled by the golden ratio for refined price velocity detection.

t3_Moving_Volume_Average
Indicator

t3_Moving_Volume_Average

This indicator calculates a weighted moving average of trading volume using a T3 triple-smoothed algorithm adjusted by the golden ratio constant.
t3_Moving_Volume_Average_v1
Indicator

t3_Moving_Volume_Average_v1

This indicator applies a triple-smoothed T3 moving average algorithm to volume data to filter out noise and highlight underlying liquidity trends.
T3_RSI
Indicator

T3_RSI

iRSI

This indicator applies a triple-smoothed T3 moving average filter to the Relative Strength Index to eliminate market noise and identify underlying trend momentum.

T3_RSI_AC2
Indicator

T3_RSI_AC2

iRSI

This indicator identifies trend reversals by calculating the intersection between a standard Relative Strength Index and a smoothed T3 moving average applied to the RSI values.

T3_RSI_v1
Indicator

T3_RSI_v1

iRSI

This indicator applies a triple exponential smoothing filter to the Relative Strength Index to reduce market noise and highlight underlying trend momentum.

t3_RSI_ZigZag
Indicator

t3_RSI_ZigZag

iRSI

This indicator applies a triple smoothed T3 filter to the Relative Strength Index data and identifies structural price pivots through a dynamic ZigZag mapping algorithm.

Indicator

t3_RSI_ZigZag_With_Channel

iRSI
T3_TCF
Indicator

T3_TCF

This indicator calculates a momentum-based oscillator by applying a triple exponential smoothing filter to the Trend Continuation Factor to highlight directional shifts.

T3_TCF_v1
Indicator

T3_TCF_v1

This indicator utilizes a multi-stage smoothing algorithm and Fibonacci-based continuation factors to isolate trend momentum through recursive differential analysis.

T3_TRIX-histo
Indicator

T3_TRIX-histo

This indicator calculates the percentage rate of change between two nested T3 moving average components to identify momentum shifts and price velocity.

T3_TRIX_exit_v1
Indicator

T3_TRIX_exit_v1

This indicator identifies local extrema by detecting structural pivot points where the T3 TRIX momentum shifts direction across three consecutive bars.

t3_TRIX_signals
Indicator

t3_TRIX_signals

Identifies trend reversals by detecting directional crossovers between dual-line T3 Trix oscillators to signal momentum shifts.

t3_TRIX_signals_v1
Indicator

t3_TRIX_signals_v1

This indicator generates buy/sell signals based on the crossover of two T3 Trix lines, plotting arrows on the chart to indicate potential trend reversals.

T3_v1
Indicator

T3_v1

A sophisticated trend-following indicator that applies triple exponential smoothing to reduce noise and lag while preserving price curvature.

T3_v2
Indicator

T3_v2

This indicator calculates a multi-stage smoothed moving average by applying six successive weighted recursive filters to minimize price noise and lag.

T3_v3
Indicator

T3_v3

This indicator employs a nested recursive smoothing algorithm to generate a high-fidelity trend line by filtering price volatility through multiple sequential weight calculations.

T3_v4
Indicator

T3_v4

iMAiMAOnArray

The algorithm synthesizes a high-order smoothed moving average by applying recursive exponential smoothing across six layers and calculating a weighted polynomial sum based on a specific volume factor.

TAACH_Chanels
Indicator

TAACH_Chanels

iFractals

This indicator dynamically generates trend channels and Fibonacci extension levels based on recursive fractal high/low identification and interactive UI controls.

Indicator

Tabelka_kontrolna_PL

iADiACiAlligatoriFractals
Table_v0
Indicator

Table_v0

iCCIiMAiRSI

This indicator generates a visual grid of real-time buy and sell signals across nine concurrent timeframes by synthesizing Moving Average crossovers, RSI momentum, CCI deviations, and price action bar analysis.

Taf
Indicator

Taf

This indicator identifies price extremes by detecting consecutive higher highs or lower lows and filtering them based on a defined qualifying sequence depth.

Taf_v1
Indicator

Taf_v1

This indicator identifies structural pivot points by detecting consecutive price expansions where the previous bar's high and low are superseded in a specific sequential order.

Taf_v2
Indicator

Taf_v2

This indicator identifies structural price extremes by tracking consecutive directional expansion to highlight significant local highs and lows.

Indicator

takbir

TakeProfit EA HiLoTradeAway
Indicator

TakeProfit EA HiLoTradeAway

This algorithm executes tiered profit-taking by closing specific lot volumes at progressively expanding intervals while optionally adjusting stop-loss positions to secure equity.

TakeProfitZero
Indicator

TakeProfitZero

This script calculates a unified breakeven price for all open positions of a specific type based on their aggregate profit and lot sizes, then prompts the user to synchronize either the TakeProfit or StopLoss levels to that price.

Target_Profit
Indicator

Target_Profit

Monitors open positions to execute automated closures based on user-defined point thresholds for both profitable gains and loss limits.

Target_Profit_v1
Indicator

Target_Profit_v1

Automates trade liquidation by monitoring real-time price fluctuations against a user-defined point threshold for both profit seeking and stop-loss mitigation.

TASSKlT
Indicator

TASSKlT

iADX

This indicator identifies high-probability trend entries by detecting concurrent upward growth across three distinct ADX periods while filtering for specific directional bias and momentum thresholds.