test1
Download script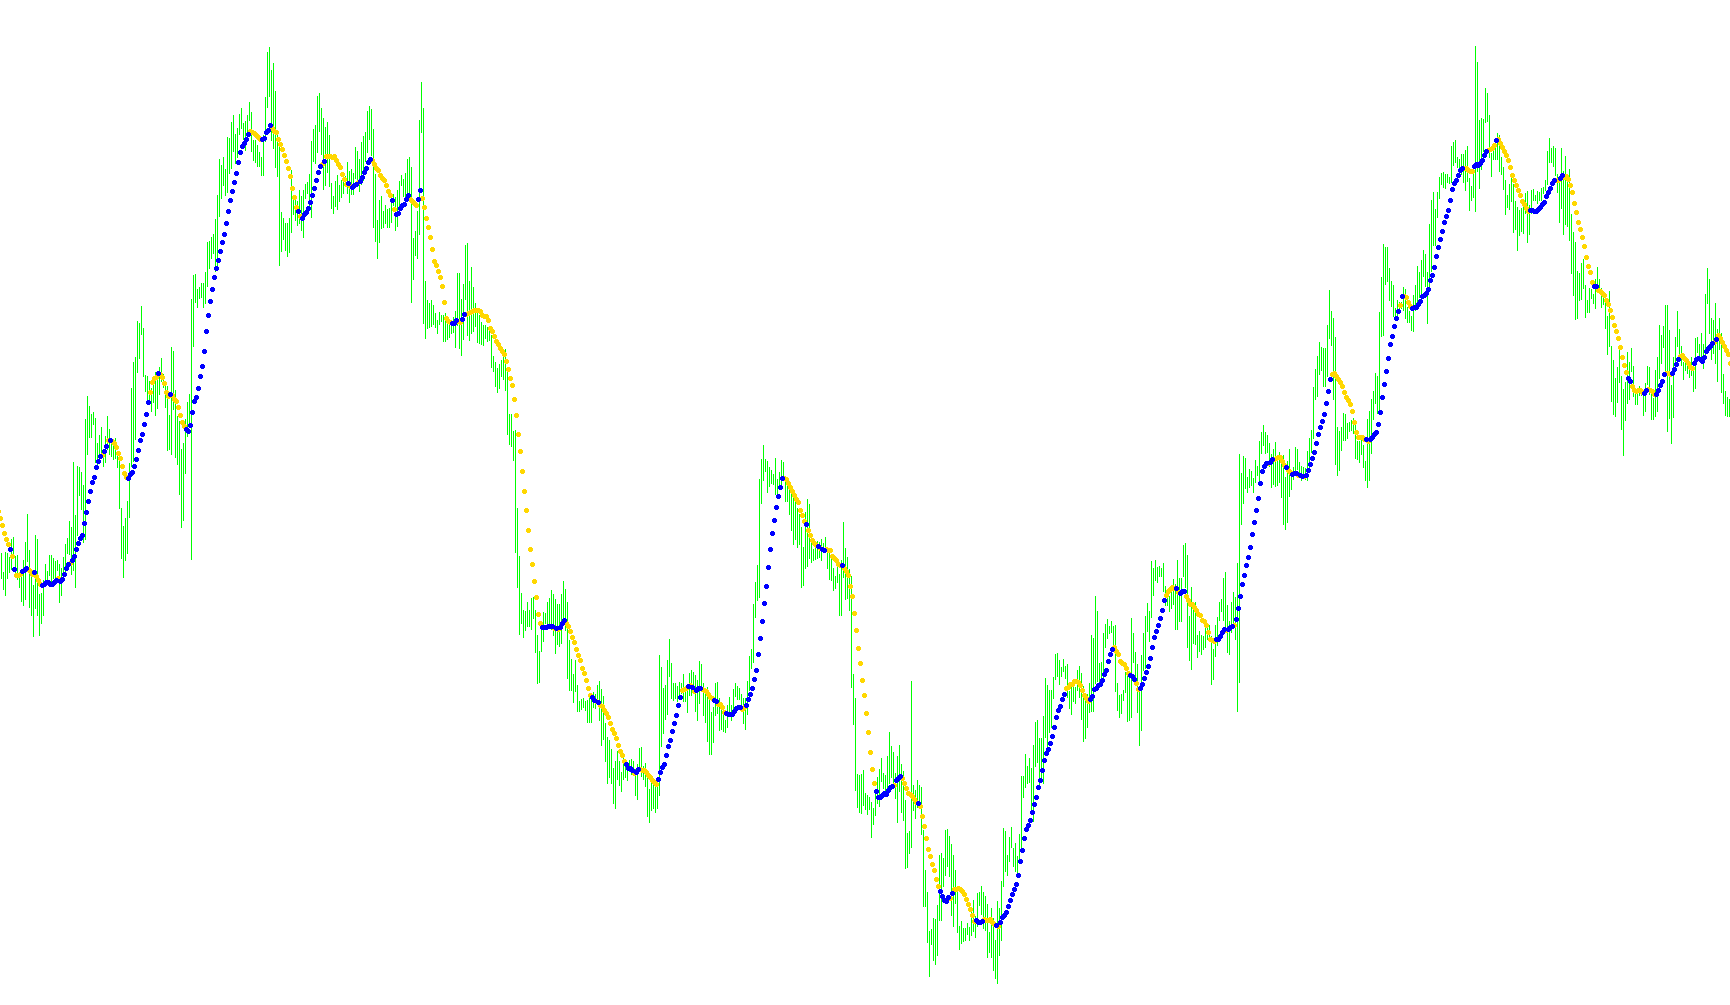
This script is a technical analysis tool designed for the MetaTrader platform to help traders identify specific momentum shifts in price action. Instead of drawing a continuous line, this indicator acts as a visual signaling system that highlights whether the "average" value of a price range is currently increasing or decreasing.
Core Logic Overview
The tool operates by analyzing a specific window of recent price data—defined by a user-selected period (the default being 13 bars). It focuses on the closing prices of these bars to calculate a moving average. However, rather than just showing you the average, it compares the current calculated average against the previous state to determine the direction of the trend.
How It Works Step-by-Step
- Data Collection: The script scans the historical closing prices over the designated period (e.g., the last 13 candles).
- Comparative Analysis: For every new price point that appears on your chart, the tool performs a mathematical comparison:
- It looks at the average value of the preceding bars.
- It compares it to the average value including the most recent price.
- Visual Signaling: Based on this comparison, the script places visual markers (arrows/symbols) on your chart:
- Downward Trend Detection: If the calculation determines that the average value is dropping compared to the previous step, it triggers a signal in one buffer (visualized in Red).
- Upward Trend Detection: If the average value is rising, it triggers a signal in the second buffer (visualized in White).
Key Features for the User
- Dynamic Calculation: The script automatically recalculates with every new price movement, ensuring that the signals on your chart stay updated in real-time.
- Trend Identification: By using two different visual buffers (Red and White), it allows you to see at a glance whether the current price momentum is leaning toward a move higher or lower.
- Customizable Sensitivity: Users can adjust the "Period" setting. A shorter period makes the signals more sensitive to quick price fluctuations, while a longer period smooths out the data to identify larger, more significant trend shifts.
In summary, this tool filters out the "noise" of individual price ticks and provides a simplified visual cue, showing you exactly when the mathematical average of the price is moving up or down.
/*-----------------------------+
|			       |
| Shared by www.Aptrafx.com    |
|			       |
+------------------------------*/

//+------------------------------------------------------------------+
//|                                           MultiMovingAverage.mq4 |
//+------------------------------------------------------------------+
#property copyright "Ron T"
#property link      "http://www.lightpatch.com"

#property indicator_chart_window
#property indicator_buffers 2
#property indicator_color1 Red
#property indicator_color2 White
//---- buffers
double ExtMapBuffer1[];
double ExtMapBuffer2[];
//----
int ExtCountedBars=0;

//---- indicator parameters
extern int MA_Period=13;
extern int Plot_Character=159;


//+------------------------------------------------------------------+
//| Custom indicator initialization function                         |
//|------------------------------------------------------------------|
int init()
  {
//---- indicators
//   SetIndexStyle(0,DRAW_ARROW, 0, 1, Red);
   SetIndexStyle(0,DRAW_ARROW);
   SetIndexBuffer(0, ExtMapBuffer1);
   SetIndexArrow(0,Plot_Character);

//   SetIndexStyle(1,DRAW_ARROW, 0, 1, White);
   SetIndexStyle(1,DRAW_ARROW);
   SetIndexBuffer(1, ExtMapBuffer2);
   SetIndexArrow(1,Plot_Character);


//----
   SetIndexDrawBegin(0,10);
   SetIndexDrawBegin(1,10);
//---- indicator buffers mapping
   SetIndexBuffer(0,ExtMapBuffer1);
   SetIndexBuffer(1,ExtMapBuffer2);

   if(MA_Period<2) MA_Period=13;

//---- initialization done
   return(0);
  }
//+------------------------------------------------------------------+
//| Custor indicator deinitialization function                       |
//+------------------------------------------------------------------+
int deinit()
  {
//---- TODO: add your code here

//----
   return(0);
  }
//+------------------------------------------------------------------+
//| Custom indicator iteration function                              |
//+------------------------------------------------------------------+
int start()
  {
     double sum=0;
     double oldsum=0;

     int    i;
     int pos=Bars-ExtCountedBars-1;

//---- initial accumulation
   if(pos<MA_Period) pos=MA_Period;
   for(i=1;i<MA_Period;i++,pos--)
      sum+=Close[pos];


//=-=-=-=-=-=-=-=-
   if(Bars<=10) return(0);
   ExtCountedBars=IndicatorCounted();

//---- check for possible errors
   if (ExtCountedBars<0) return(-1);

//---- last counted bar will be recounted
   if (ExtCountedBars>0) ExtCountedBars--;


//---- main calculation loop
   while(pos>=0)
     {
      oldsum=sum;

      // add in the leading value to make MA_Period samples
      sum+=Close[pos];

      if(oldsum/(MA_Period-1) > sum/MA_Period)
         {
         ExtMapBuffer1[pos]=sum/MA_Period;
         ExtMapBuffer2[pos]=0;
         }
         else
         {
         ExtMapBuffer1[pos]=0;
         ExtMapBuffer2[pos]=sum/MA_Period;
         }

      // remove the trailing period to make MA_Period-1 samples
      sum-=Close[pos+MA_Period-1];
 	   pos--;
     }

//---- zero initial bars
   if(ExtCountedBars<1)
      for(i=1;i<MA_Period;i++) ExtMapBuffer1[Bars-i]=0;
      for(i=1;i<MA_Period;i++) ExtMapBuffer2[Bars-i]=0;


   return(0);
  }

//+------------------------------------------------------------------+
Comments