test_5close_up
Download script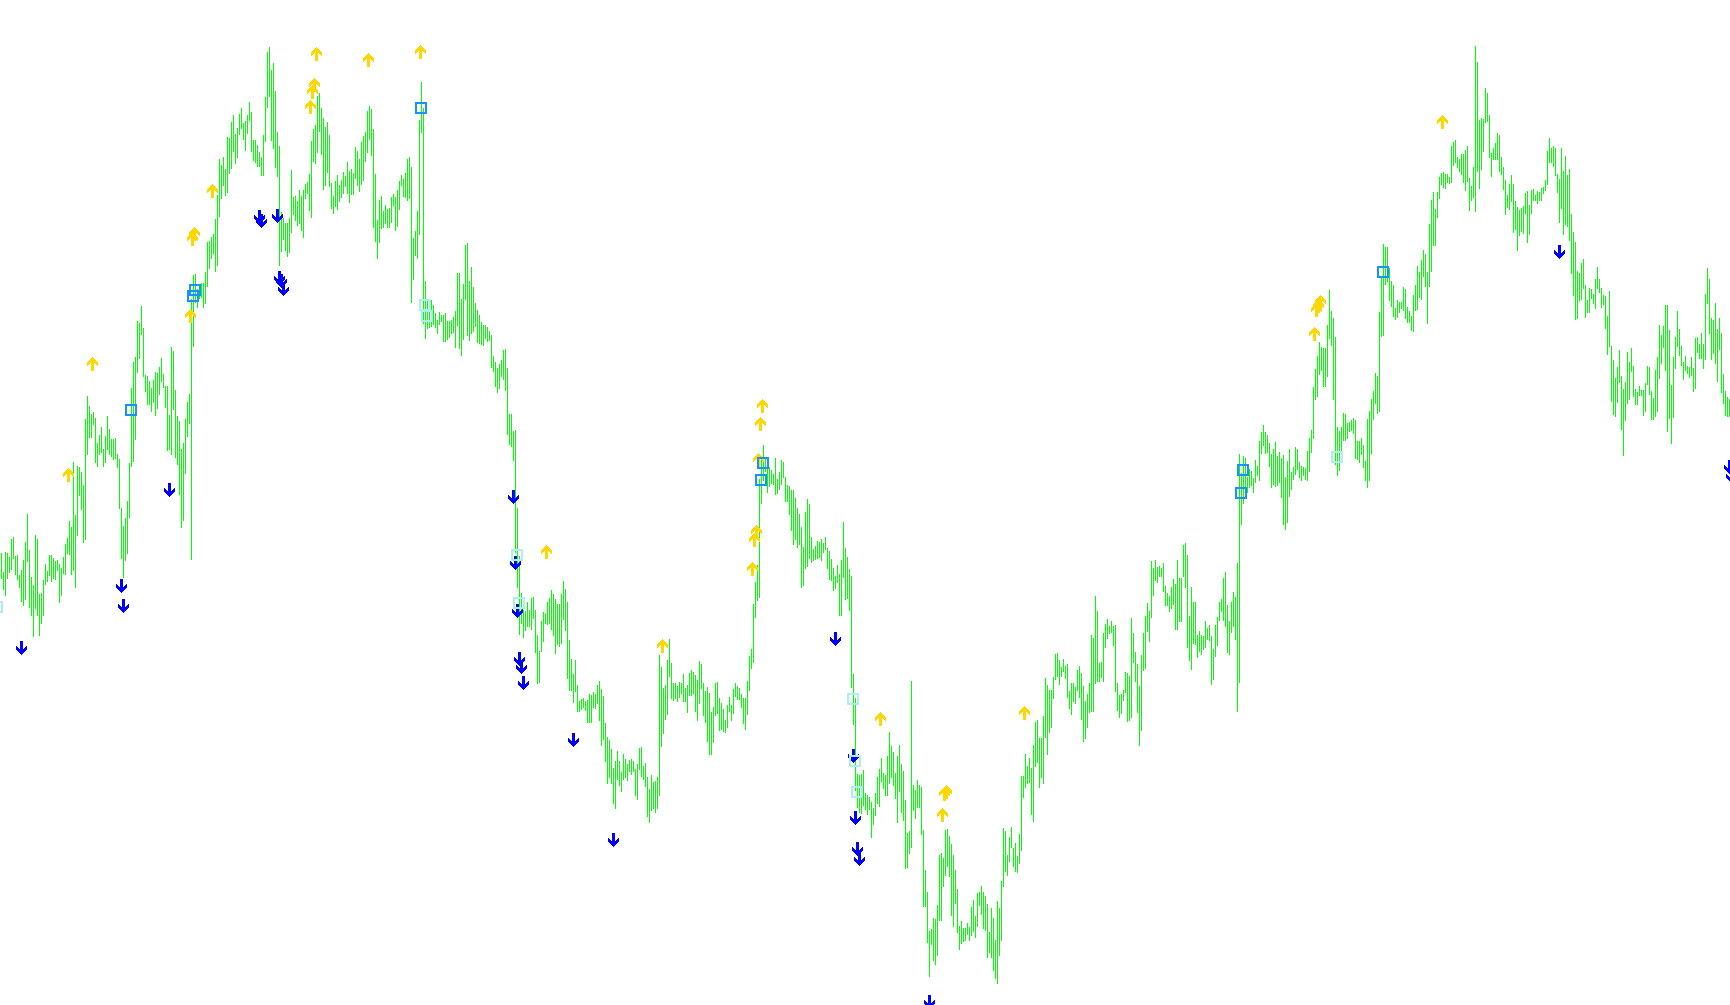
This tool is designed as a visual indicator for the MetaTrader platform, intended to help traders identify specific momentum shifts and price movements on a chart. Rather than using complex standard indicators, it focuses on calculating price trends based on a "Typical Price" model over a rolling six-bar window.
How the Logic Works
The script functions by analyzing the relationship between consecutive price points. It looks at the average of the High, Low, and Close prices (weighted towards the Closing price) for the most recent bars to determine the general direction of the market.
1. Momentum Gap Detection
The tool identifies significant "gaps" or sudden bursts in price movement. By comparing the price differences across three consecutive periods, it calculates whether the total movement exceeds a specific user-defined threshold (the Gap_Size).
- Downward Gaps: If the cumulative drop over these periods is large enough, the script marks the location on the chart with a specific visual signal.
- Upward Gaps: Conversely, if there is a significant cumulative rise within that same timeframe, it triggers a separate visual signal.
2. Sequential Trend Identification
In addition to looking for sudden gaps, the script monitors for consistent, sequential trends. It looks for five consecutive bars where each price point is strictly higher or lower than the one preceding it:
- Descending Trends: If the price consistently moves downward for six consecutive periods, the script identifies a "down" trend and places a red visual marker on the chart.
- Ascending Trends: If the price consistently moves upward for six consecutive periods, it identifies an "up" trend and places a white visual marker.
Summary of Visual Outputs
When you use this tool, you will see different arrows or markers appearing on your chart:
- Trend Markers: These appear during sustained, steady movements (like a long staircase of price action).
- Gap Markers: These appear when the market moves with enough velocity to "break" your pre-defined gap limit.
By combining these two methods, the script aims to provide a clearer picture of both the steady flow of the market and the sudden shifts in volatility.
//+------------------------------------------------------------------+
//| test.mq4                                                         |
//+------------------------------------------------------------------+
#property copyright "Ron T"
#property link      "http://www.lightpatch.com"

#property indicator_chart_window
#property indicator_buffers 4
#property indicator_color1 White
#property indicator_color2 Red
#property indicator_color3 Red
#property indicator_color4 White

//---- buffers
double ExtMapBuffer1[];
double ExtMapBuffer2[];
double ExtMapBuffer3[];
double ExtMapBuffer4[];

// User Input
extern double Gap_Size=0.0030;


//+------------------------------------------------------------------+
//| Custom indicator initialization function                         |
//|------------------------------------------------------------------|

int init()
  {

   SetIndexStyle(0,DRAW_ARROW);
   SetIndexBuffer(0, ExtMapBuffer1);
   SetIndexArrow(0,233); //up red

   SetIndexStyle(1,DRAW_ARROW);
   SetIndexBuffer(1, ExtMapBuffer2);
   SetIndexArrow(1,234); //down white

   SetIndexStyle(2,DRAW_ARROW);
   SetIndexBuffer(2, ExtMapBuffer3);
   SetIndexArrow(2,168);  // Red

   SetIndexStyle(3,DRAW_ARROW);
   SetIndexBuffer(3, ExtMapBuffer4);
   SetIndexArrow(3,168);  // White

   return(0);
  }


//+------------------------------------------------------------------+
//| Custor indicator deinitialization function                       |
//+------------------------------------------------------------------+
int deinit()
  {
   int i;

   for( i=0; i<Bars; i++ ) ExtMapBuffer1[i]=0;
   for( i=0; i<Bars; i++ ) ExtMapBuffer2[i]=0;
   for( i=0; i<Bars; i++ ) ExtMapBuffer3[i]=0;
   for( i=0; i<Bars; i++ ) ExtMapBuffer4[i]=0;

   return(0);
  }


//+------------------------------------------------------------------+
//| Custom indicator iteration function                              |
//+------------------------------------------------------------------+
int start()
  {
   double oTYP0=0, oTYP1=0, oTYP2=0, oTYP3=0, oTYP4=0, oTYP5=0;

   int pos=Bars;

   while(pos>=0)
     {
      // six-period typical
      oTYP0=(High[pos+0]+Low[pos+0]+Close[pos+0]+Close[pos+0])/4;
      oTYP1=(High[pos+1]+Low[pos+1]+Close[pos+1]+Close[pos+1])/4;
      oTYP2=(High[pos+2]+Low[pos+2]+Close[pos+2]+Close[pos+2])/4;
      oTYP3=(High[pos+3]+Low[pos+3]+Close[pos+3]+Close[pos+3])/4;
      oTYP4=(High[pos+4]+Low[pos+4]+Close[pos+4]+Close[pos+4])/4;
      oTYP5=(High[pos+5]+Low[pos+5]+Close[pos+5]+Close[pos+5])/4;

      //three-period ten-pip gap DOWN
      if ( (oTYP3-oTYP2)+(oTYP2-oTYP1)+(oTYP1-oTYP0) >= Gap_Size )
        {
         ExtMapBuffer3[pos]=oTYP0;
         ExtMapBuffer4[pos]=0;
        }

      //three-period ten-pip gap UP
      if ( (oTYP3-oTYP2)+(oTYP2-oTYP1)+(oTYP1-oTYP0) <= Gap_Size*(-1) )
        {
         ExtMapBuffer4[pos]=0;
         ExtMapBuffer4[pos]=oTYP0;
        }


      // six-period down
      if(oTYP5 > oTYP4 && oTYP4 > oTYP3 && oTYP3 > oTYP2 && oTYP2 > oTYP1 && oTYP1 > oTYP0)
        {
         ExtMapBuffer1[pos]=0;
         ExtMapBuffer2[pos]=oTYP0-0.0015;  //down red
        }


      if(oTYP5 < oTYP4 && oTYP4 < oTYP3 && oTYP3 < oTYP2 && oTYP2 < oTYP1 && oTYP1 < oTYP0)
        {
         // six-period up
         ExtMapBuffer1[pos]=oTYP0+0.0015;  //up white
         ExtMapBuffer2[pos]=0;
        }
 	   pos--;
     }

   return(0);
  }
//+------------------------------------------------------------------+
Comments