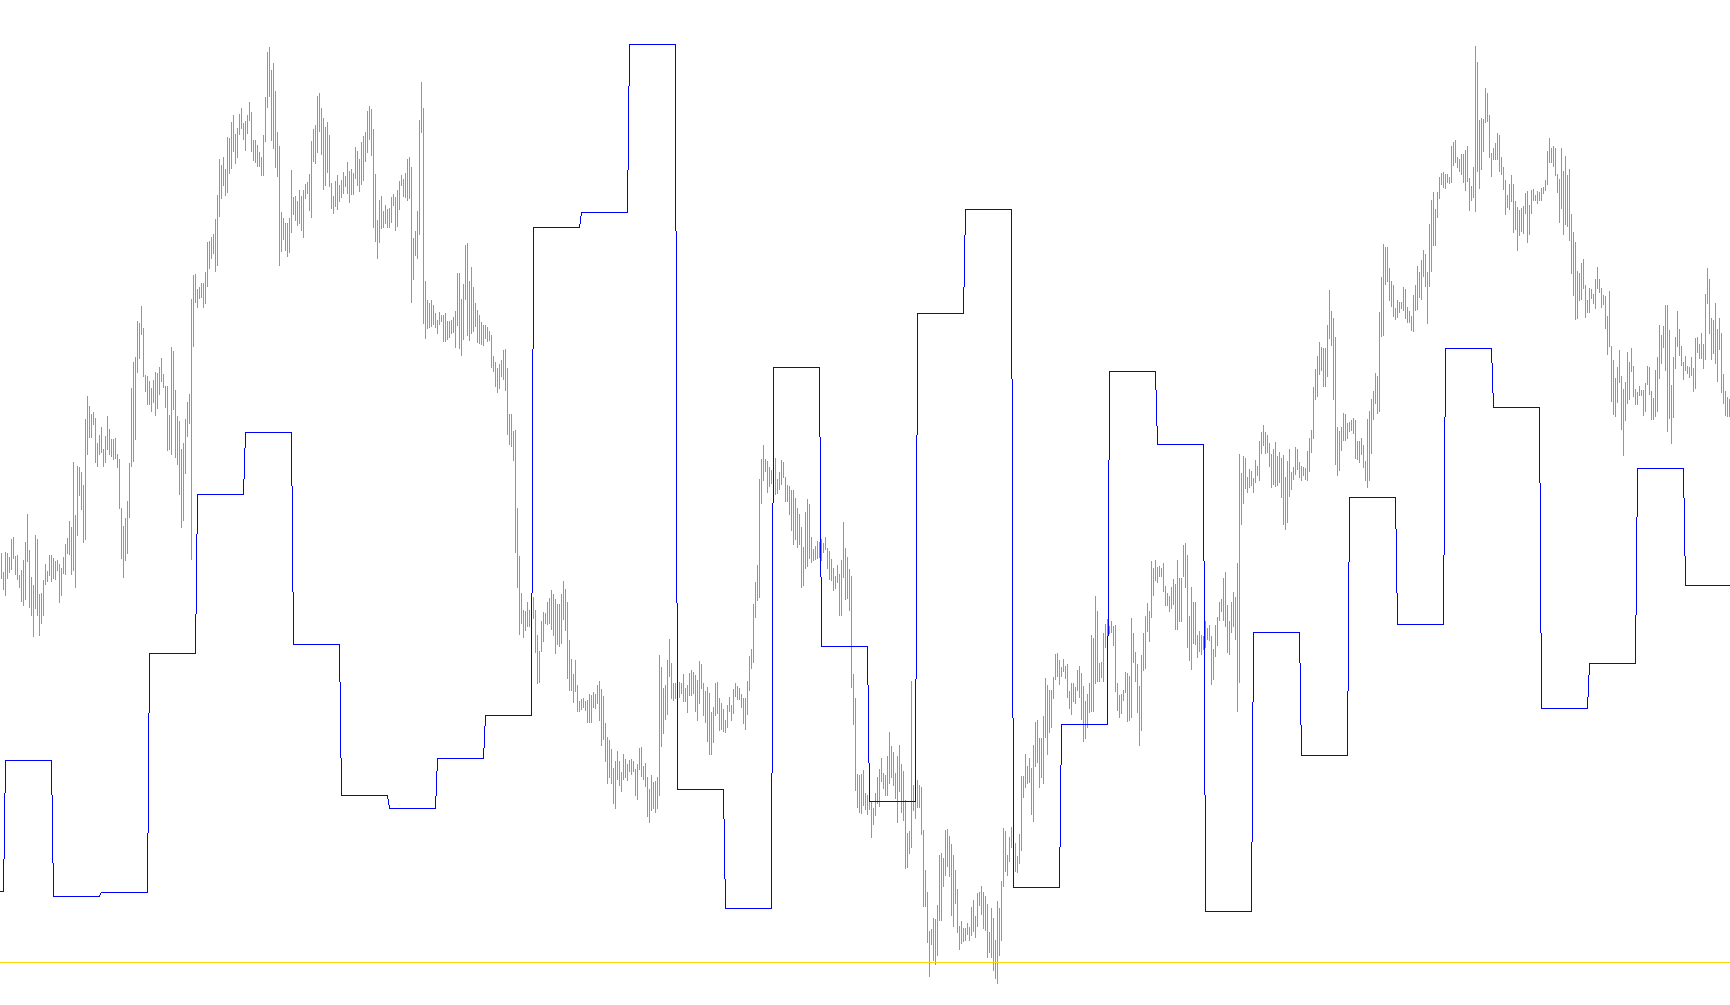
This specialized trading tool is designed to provide visual data analysis by aggregating information from different timeframes into a single, easy-to-read display. Instead of cluttering your main price chart, it operates in a separate window, allowing you to monitor specific trends without losing sight of the current market action.
Core Logic and Functionality
The script functions as a "data bridge." Its primary purpose is to look at historical data from much larger timeframes (specifically daily intervals) and translate that information into the current view. Here is how it processes that information:
- Multi-Timeframe Synchronization: The tool is programmed to look back at a large "Period" of data. It calculates a specific mathematical shift to ensure that the data being pulled from the larger timeframe aligns correctly with the current price movement on your smaller chart.
- Dual Indicator Tracking: The script simultaneously pulls and plots two distinct data streams, identified as "MRO1" and "MRO2." These represent two different technical measurements or signals derived from the "GATO" system.
- Visual Representation:
- The first signal is highlighted in Red.
- The second signal is highlighted in Yellow.
- Continuous Calculation: The logic runs through every bar of history, ensuring that as new price data arrives, the indicator updates dynamically. It continuously recalculates these two lines so that you can see how the historical trends from higher timeframes are evolving in real-time.
Summary for the User
Essentially, this tool acts as a high-level filter. It takes complex information from daily market cycles and condenses it into two clear lines on your screen. By watching the interaction between the Red and Yellow lines, you can better understand broader market trends that might otherwise be hidden when looking at shorter-term price movements.
//+------------------------------------------------------------------+
//|                                                         Test.mq4 |
//|                      Copyright © 2005, MetaQuotes Software Corp. |
//|                                        http://www.metaquotes.net |
//+------------------------------------------------------------------+
#property copyright "Rosh"
#property link      "http://forexsystems.ru/phpBB/"

#property indicator_separate_window
#property indicator_buffers 2
#property indicator_color1 Red
#property indicator_color2 Yellow
//---- input parameters
extern int       PeriodMin=1440;
//---- buffers
double ExtMapBuffer1[];
double ExtMapBuffer2[];
//+------------------------------------------------------------------+
//| Custom indicator initialization function                         |
//+------------------------------------------------------------------+
int init()
  {
//---- indicators
   SetIndexStyle(0,DRAW_LINE);
   SetIndexBuffer(0,ExtMapBuffer1);
   SetIndexStyle(1,DRAW_LINE);
   SetIndexBuffer(1,ExtMapBuffer2);
   SetIndexLabel(0,"MRO1");
   SetIndexLabel(1,"MRO2");
//----
   return(0);
  }
//+------------------------------------------------------------------+
//| Custor indicator deinitialization function                       |
//+------------------------------------------------------------------+
int deinit()
  {
//---- TODO: add your code here

//----
   return(0);
  }
//+------------------------------------------------------------------+
//| Custom indicator iteration function                              |
//+------------------------------------------------------------------+
int start()
  {
   int bigshift;
   int shift;
   int    counted_bars=IndicatorCounted();
//---- TODO: add your code here
   for (shift=Bars;shift>=0;shift--)
      {
      bigshift=MathFloor(shift*Period()/PeriodMin);
//      ExtMapBuffer1[shift]=iCustom(NULL,PeriodMin,"GATO",22,300,120,50,6,0,bigshift);
      ExtMapBuffer1[shift]=iCustom(NULL,PeriodMin,"MRO1",10,0,bigshift);
      ExtMapBuffer2[shift]=iCustom(NULL,PeriodMin,"MRO2",7,0,bigshift);
      }
//----
   return(0);
  }
//+------------------------------------------------------------------+
Comments