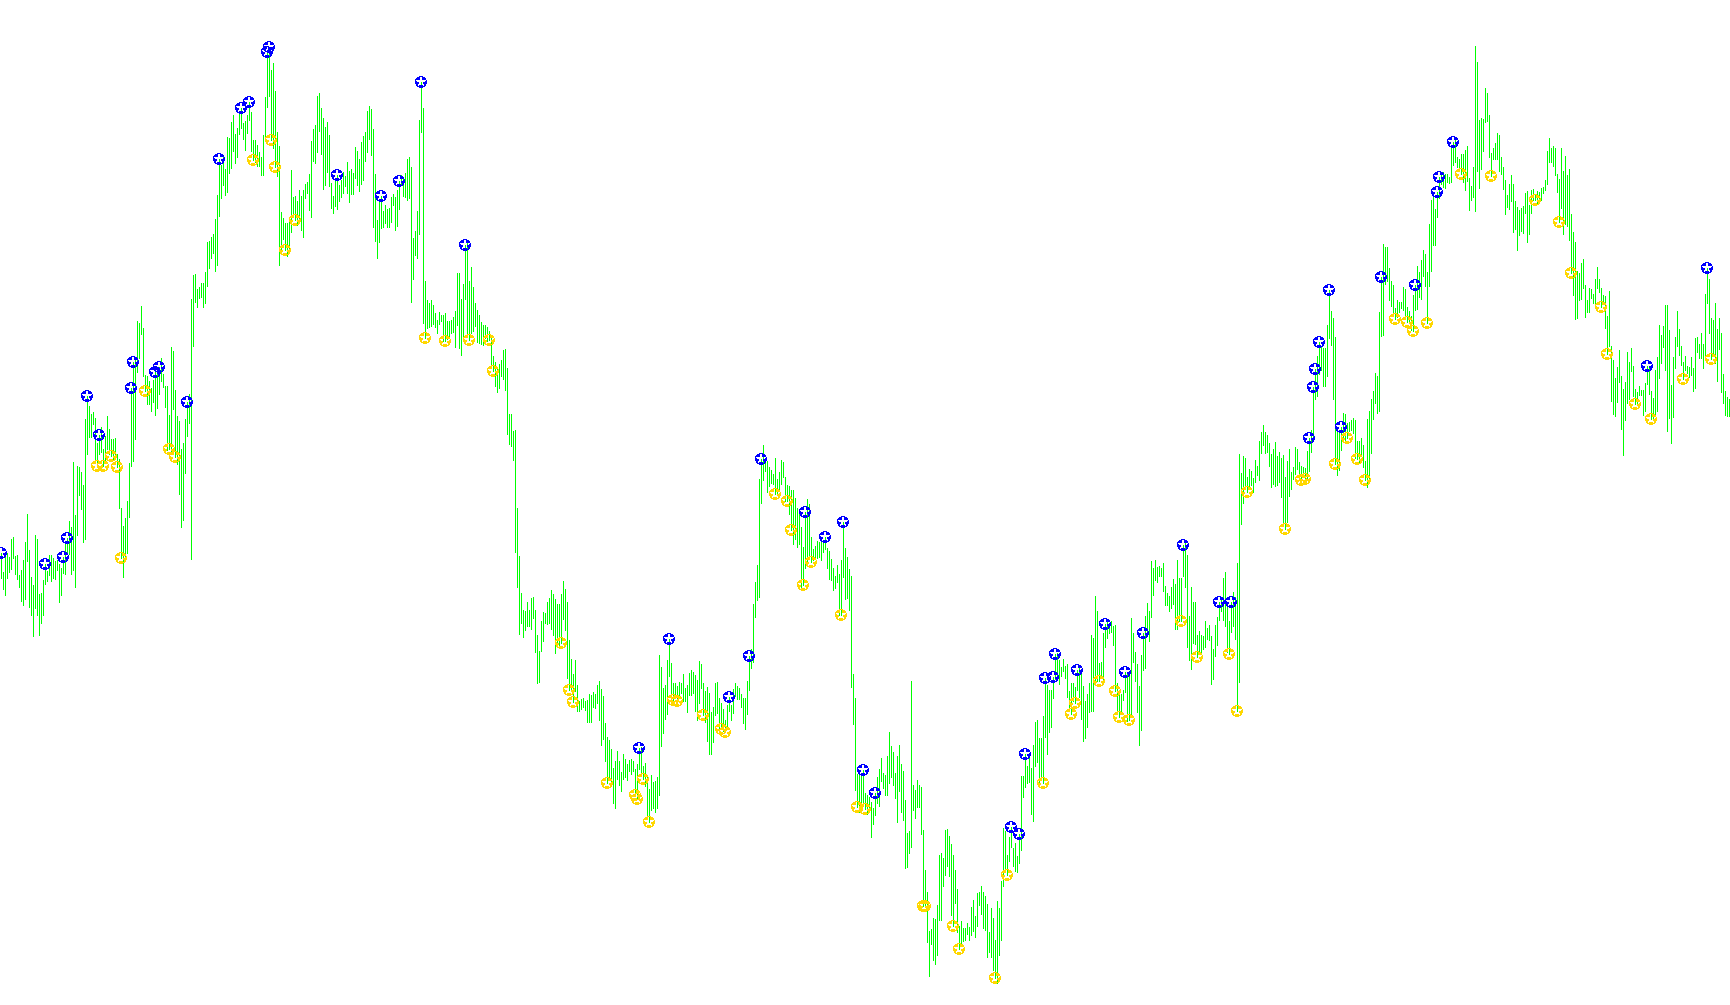
This tool is designed to identify specific price action patterns on a trading chart by analyzing the relationship between previous candle sizes, their opening and closing positions, and current price movement. It offers two distinct logic modes (Variations) to help traders spot potential momentum shifts or reversals.
How it Works
The script constantly monitors the "bars" (candlesticks) on your chart and calculates specific zones within those bars—specifically the top 20% and the bottom 20% of their total price range. Depending on which Variation you select, the tool looks for different triggers:
Variation 0: Price Movement Extremes
This mode focuses on dramatic price movements where the price "travels" across almost the entire length of a single candle.
- Buy Signal Logic: The tool looks for a previous candle that opened in its upper 20% area but finished significantly lower, closing in the bottom 20% area. If the current price then dips slightly below the previous candle's low (by 10 pips), it marks a potential buy point.
- Sell Signal Logic: Conversely, if a previous candle opened in its lower 20% area but finished high in the top 20% area, and the current price pushes slightly above that previous high (by 10 pips), it marks a potential sell point.
Variation 1: The Inside Bar Breakout
This mode focuses on "consolidation" followed by an expansion. It looks for a specific structural setup where the market takes a break from volatility.
- The Setup: First, the tool identifies an "inside bar"—a candle that is smaller than the three candles preceding it.
- The Trigger: Once this small, quiet period of consolidation is identified, the tool looks at the current price's opening position relative to that small candle.
- If the current price opens in the bottom 20% of that small candle's range, it signals a buy opportunity.
- If the current price opens in the top 20% of that small candle's range, it signals a sell opportunity.
Visual Representation
When these specific mathematical conditions are met, the script places visual markers (arrows) directly on your chart. This allows you to see exactly where the historical logic triggered a signal, helping you identify potential entry points based on the prevailing market structure.
/*-----------------------------+
|			       |
| Shared by www.Aptrafx.com    |
|			       |
+------------------------------*/

//+------------------------------------------------------------------+
//|                                                   The 20's v0.20 |
//+------------------------------------------------------------------+
#property copyright "Copyright © 2005, TraderSeven"
#property link      "TraderSeven@gmx.net"

//            \\|//             +-+-+-+-+-+-+-+-+-+-+-+             \\|//
//           ( o o )            |T|r|a|d|e|r|S|e|v|e|n|            ( o o )
//    ~~~~oOOo~(_)~oOOo~~~~     +-+-+-+-+-+-+-+-+-+-+-+     ~~~~oOOo~(_)~oOOo~~~~
// This EA has 2 main parts.
// Variation=0
// If previous bar opens in the lower 20% of its range and closes in the upper 20% of its range then sell on previous high+10pips.
// If previous bar opens in the upper 20% of its range and closes in the lower 20% of its range then buy on previous low-10pips.
//
// Variation=1
// The previous bar is an inside bar that has a smaller range than the 3 bars before it.
// If todays bar opens in the lower 20% of yesterdays range then buy.
// If todays bar opens in the upper 20% of yesterdays range then sell.
//
//01010100 01110010 01100001 01100100 01100101 01110010 01010011 01100101 01110110 01100101 01101110

#property indicator_chart_window
#property indicator_buffers 2
#property indicator_color1 Blue
#property indicator_color2 Red

extern int Variation=0;

double The20sBufferBuy[];
double The20sBufferSell[];

int init()
{
   IndicatorBuffers(2);

   SetIndexStyle(0,DRAW_ARROW);
   SetIndexStyle(1,DRAW_ARROW);
   SetIndexBuffer(0,The20sBufferBuy);
   SetIndexBuffer(1,The20sBufferSell);
   SetIndexArrow(0,181);
   SetIndexArrow(1,181);
   SetIndexEmptyValue(0,0.0);
   SetIndexEmptyValue(1,0.0);
   ArraySetAsSeries(The20sBufferBuy,true);
   ArraySetAsSeries(The20sBufferSell,true);
   IndicatorShortName("The20s("+Variation+")");

   return(0);
}

int deinit()
{
   return(0);
}

int start()
{
   int i,TotalBars, CountedBars;
   double LastBarsRange,Top20,Bottom20;

   CountedBars=IndicatorCounted();     // Find the number of bars on the screen since
                                       //    this indicator/expert was first executed
                                       //    on the current chart
   if(CountedBars < 0)                 // If there are less than 0 bars of data, we
      return (-1);                     //    have a problem

   if(CountedBars > 0)
      CountedBars--;

   TotalBars=Bars-CountedBars;

   for(i=TotalBars-1;i>=0;i--)
   {
      LastBarsRange=(High[i+1]-Low[i+1]);
      Top20=High[i+1]-(LastBarsRange*0.20);
      Bottom20=Low[i+1]+(LastBarsRange*0.20);

      if(Variation==0)
      {
         if(Open[i+1]>=Top20 && Close[i+1]<=Bottom20 && Low[i]<=Low[i+1]+10*Point)
            The20sBufferBuy[i]=Low[i];
         else if(Open[i+1]<=Bottom20 && Close[i+1]>=Top20 && High[i]>=High[i+1]+10*Point)
            The20sBufferSell[i]=High[i];
      }
      else if(Variation==1)
      {
         if((High[i+4]-Low[i+4])>LastBarsRange && (High[i+3]-Low[i+3])>LastBarsRange && (High[i+2]-Low[i+2])>LastBarsRange && High[i+2]>High[i+1] && Low[i+2]<Low[i+1])
         {
            if(Open[i]<=Bottom20)
               The20sBufferBuy[i]=Low[i];
            if(Open[i]>=Top20)
               The20sBufferSell[i]=High[i];
         }
      }
   }
}
Comments