Tick_on_Chart_v1
Indicator

Tick_on_Chart_v1

This indicator visualizes real-time price flow by plotting historical tick data points and identifying immediate volatility thresholds based on local extrema.

Tick_Power
Indicator

Tick_Power

This indicator calculates cumulative price displacement and real-time tick interval frequency to monitor instantaneous market velocity.

Tick_VWAP
Indicator

Tick_VWAP

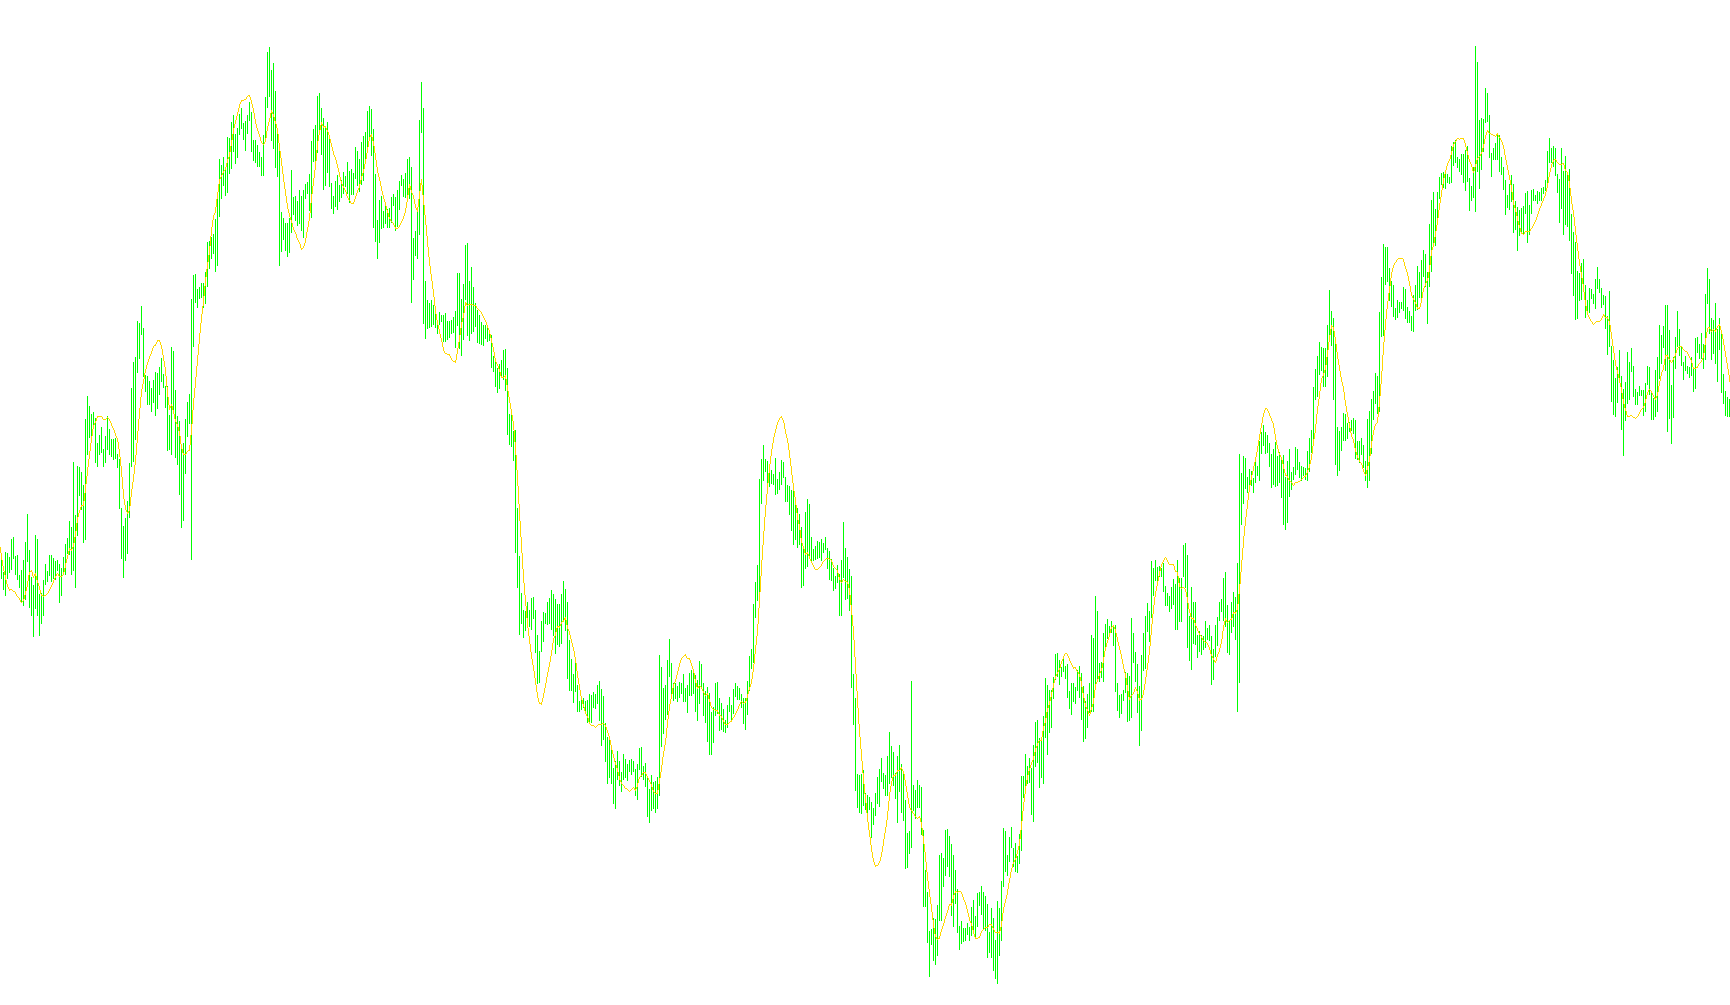
This indicator calculates a moving average based on the cumulative sum of price midpoint values weighted by their respective tick volume over a fixed threshold.

TII_RLH
Indicator

TII_RLH

iMA

This indicator quantifies market momentum by calculating the percentage of positive versus negative price deviations relative to a long-term moving average.

TII_RLH1
Indicator

TII_RLH1

iMA

This indicator quantifies market momentum by calculating the ratio of positive to negative price deviations from a long-term moving average over a specified short-term window.

TII_RLH2
Indicator

TII_RLH2

iMA

This indicator measures market momentum by calculating the ratio of positive to negative price deviations from a long-term moving average over a secondary timeframe.

Indicator

TII_RLH_MTF

TII_RLH_v1
Indicator

TII_RLH_v1

iMA

This indicator quantifies market momentum by calculating the ratio of positive to negative price deviations relative to a long-term simple moving average.

TII_RLH_v2
Indicator

TII_RLH_v2

iMA

This indicator quantifies market momentum by calculating the ratio of positive to negative price deviations from a primary moving average over a secondary rolling window.

Tiki
Indicator

Tiki

This indicator captures and shifts the historical Bid price into a rolling linear buffer to visualize sequential price movement transitions.

TikTak
Indicator

TikTak

This indicator monitors instantaneous price fluctuations and triggers immediate alerts when the discrete point movement exceeds a predefined pip threshold.

TikTakWav
Indicator

TikTakWav

This indicator monitors discrete price fluctuations and triggers specific auditory cues and visual labels based on the magnitude of change between consecutive ticks.

Time Maker
Indicator

Time Maker

An optimized indicator that aggregates source timeframe data into custom offline charts using low-latency file writing and Win32 API signaling for real-time updates.

Time Series Forecast
Indicator

Time Series Forecast

This indicator calculates the future price trajectory by determining the best-fit linear regression line based on historical closing prices over a user-defined period.

time to next bar
Indicator

time to next bar

iMACDiMA

This indicator identifies potential trend reversals by detecting MACD zero-line crossovers synchronized with Exponential Moving Average (EMA) distance thresholds.

Time Zones
Indicator

Time Zones

This indicator visually delineates specific time-based trading windows on the chart by projecting rectangular zones based on historical price extremes or fixed volatility levels.

Time Zones_v1
Indicator

Time Zones_v1

This indicator dynamically renders visual price boundaries across historical trading sessions based on user-defined time windows and high/low volatility ranges.

Time
Indicator

Time

This indicator calculates real-time account balance, potential profit/loss from open orders, and current spread while displaying a dual countdown timer for bar expiration.

time1
Indicator

time1

This indicator automatically renders color-coded vertical lines on the chart to highlight specific fixed hourly timestamps for structural market analysis.

TIME1_GMTplus2
Indicator

TIME1_GMTplus2

This indicator visually demarcates distinct global trading sessions by drawing historical price boundary rectangles over specific time intervals.

TIME1_modified
Indicator

TIME1_modified

Dynamically renders semi-transparent rectangular zones on the chart to delineate high-activity trading periods across Asian, European, and American market sessions.

time1_v1
Indicator

time1_v1

This indicator automatically plots vertical visual markers at specific predefined hourly timestamps to delineate significant trading sessions and volatility shifts.

time1_v2
Indicator

time1_v2

Automatically renders distinct color-coded vertical lines on the chart to highlight specific recurring hourly milestones and transition points.

time2
Indicator

time2

This indicator automatically plots vertical lines on the chart to highlight specific daily time milestones for session tracking and visual navigation.

TimeCurrentXR
Indicator

TimeCurrentXR

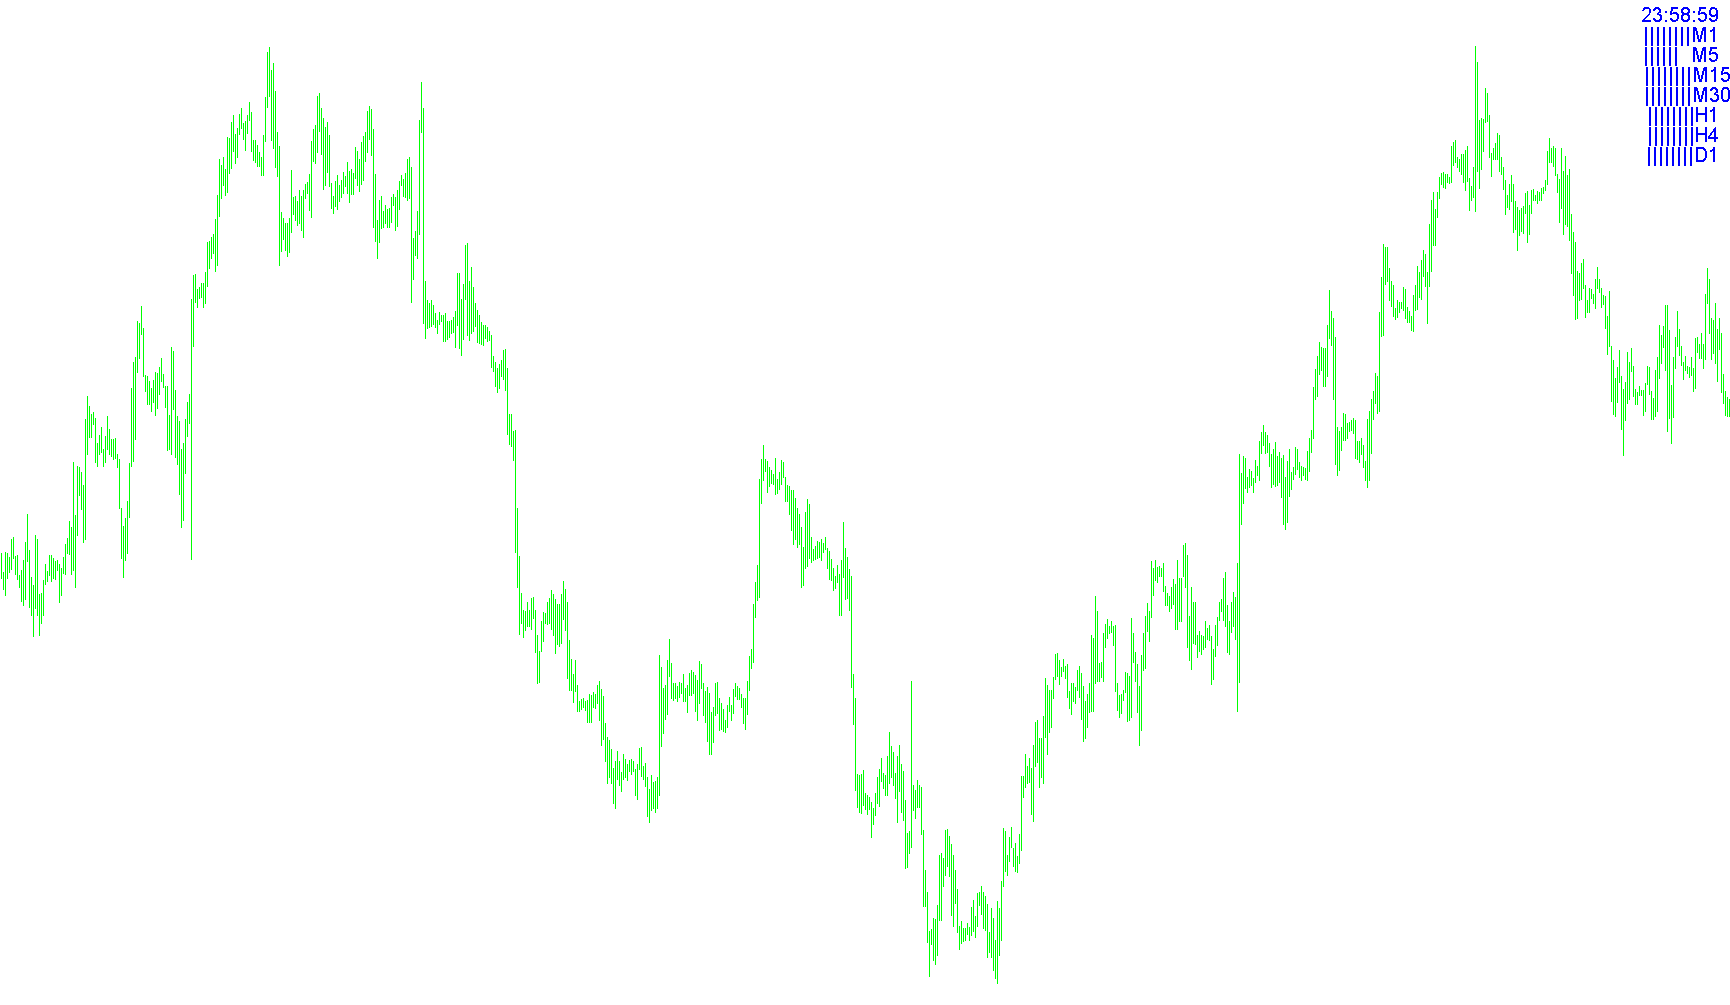
This indicator visually represents the elapsed progress of current candles across various timeframes (M1 through D1) using dynamic bar charts on the main window.

Indicator

TimeGMTdemo

TimeOut
Indicator

TimeOut

This indicator calculates and visualizes real-time execution delays by comparing local server time against incoming tick timestamps to identify network lag.

Indicator

TimeToEndBar

TimeZone
Indicator

TimeZone

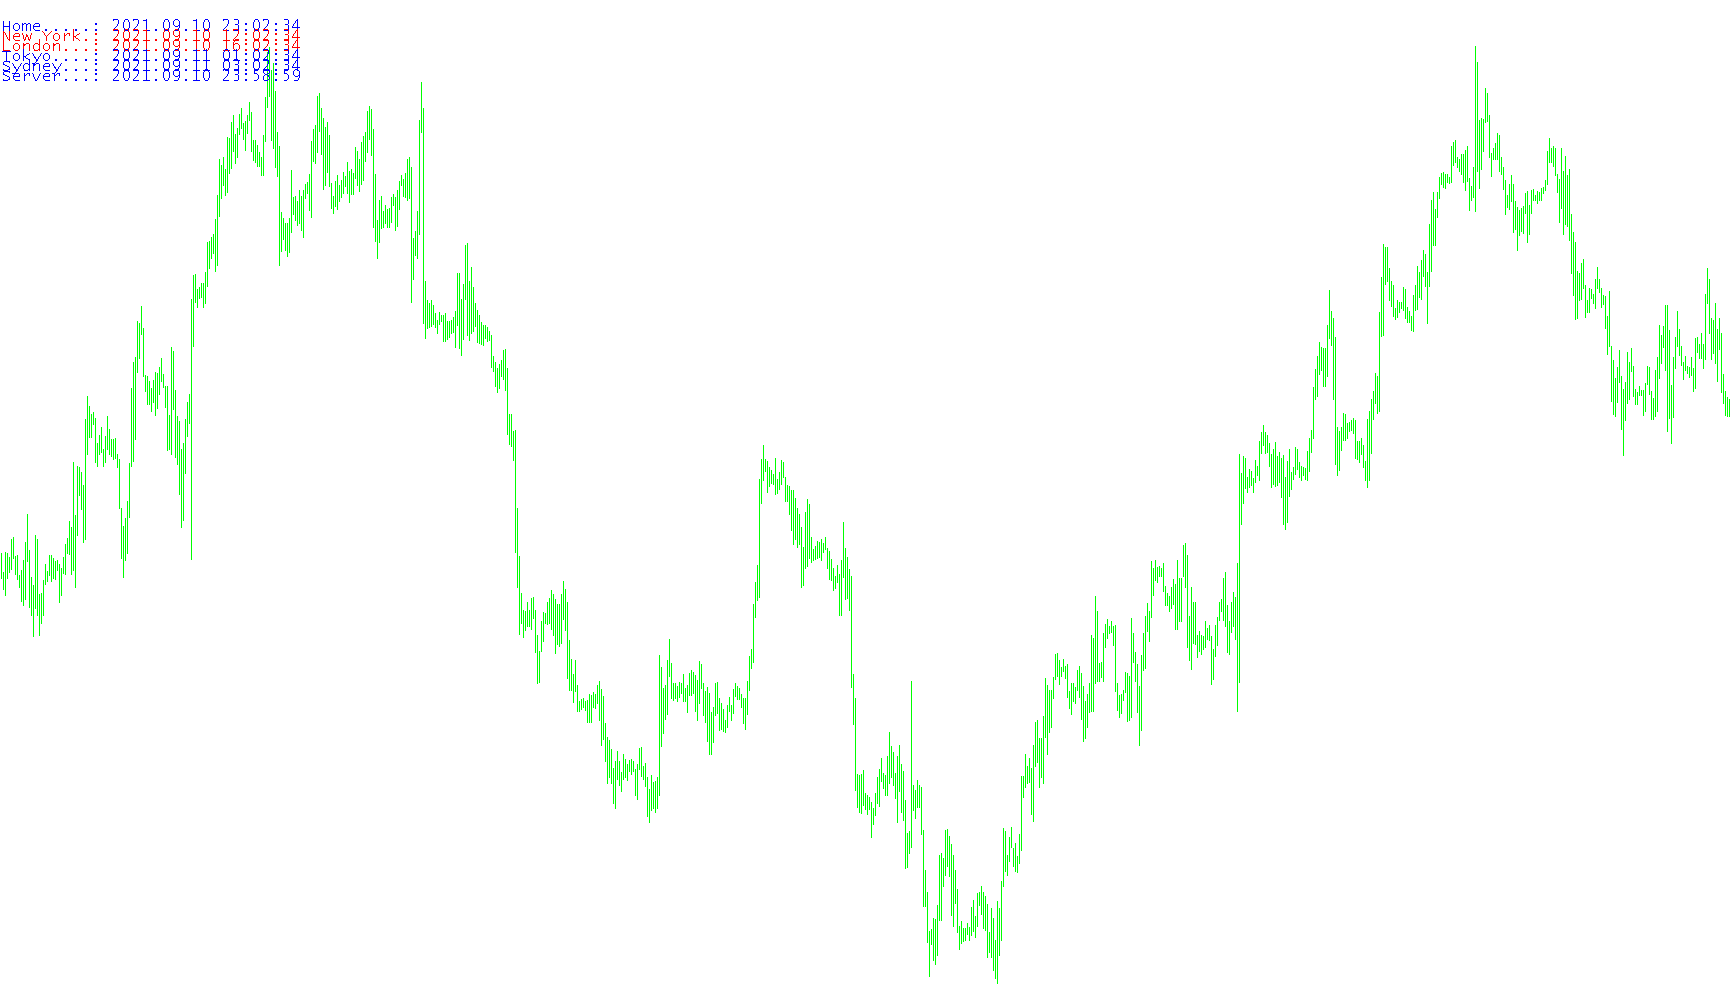
This indicator visualizes the current local times and active trading sessions for major global financial hubs, highlighting open markets in dynamic colors.

TIME_FRAME
Indicator

TIME_FRAME

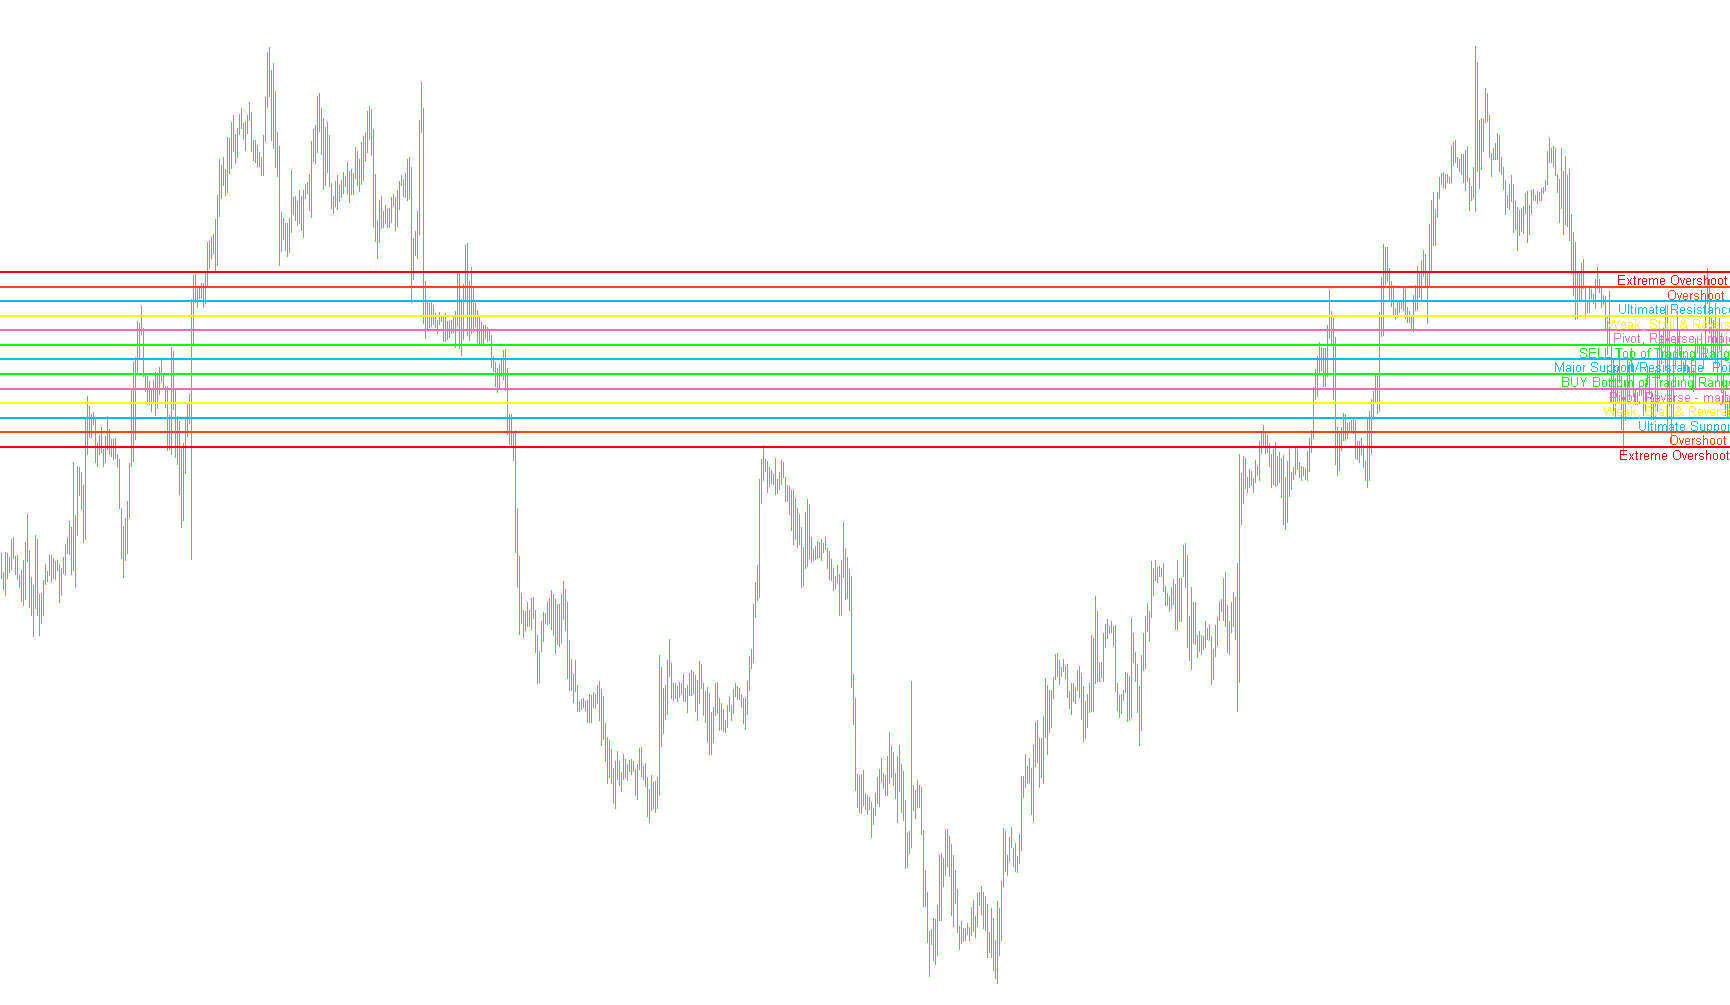
This indicator dynamically segments the trading range into an 8-part fractal octave system to identify precise structural equilibrium points, extreme overshoot zones, and potential pivot reversals.

Time_H1onM1
Indicator

Time_H1onM1

This indicator dynamically projects dashed vertical demarcations onto the chart to isolate hourly time transitions across a user-defined historical window.

Time_periodseparator_Satop
Indicator

Time_periodseparator_Satop

This indicator projects vertical demarcations on the chart to identify hourly transition points and structural temporal boundaries across specified higher timeframes.

Time_Zones-black screen
Indicator

Time_Zones-black screen

This indicator visualizes high-impact trading windows by overlaying distinct color-coded zones across the chart to identify key global opening hours and liquidity shifts.

Time_Zones-black screen_v1
Indicator

Time_Zones-black screen_v1

Visualizes predefined global market liquidity windows and news sessions as distinct price zones across a historical timeframe.

Time_Zones-white screen
Indicator

Time_Zones-white screen

This indicator visually overlays historical and current trading sessions onto the chart by rendering colored rectangular zones based on specific global market opening and closing times.

Time_Zones-white screen_v1
Indicator

Time_Zones-white screen_v1

This indicator visually demarcates specific global financial trading windows and key news release intervals on the chart using distinct colored rectangular zones.

Time_Zones
Indicator

Time_Zones

This indicator maps specific global trading windows onto the chart using color-coded rectangular zones to highlight key market sessions and news events.

Time_Zones1
Indicator

Time_Zones1

This indicator visually demarcates specific high-impact global trading windows and news release periods on the chart using customizable color-coded rectangular zones.

Time_Zones1_v1
Indicator

Time_Zones1_v1

This indicator highlights specific global market liquidity windows and high-impact news periods by overlaying color-coded geometric regions on the historical price chart.

Time_Zones_v1
Indicator

Time_Zones_v1

This indicator visualizes major financial market opening and closing windows by overlaying distinct color-coded chronological zones on the chart.

Time_Zone_Pivots_midpoints
Indicator

Time_Zone_Pivots_midpoints

This indicator calculates and plots six distinct pivot price levels (M0-M5) based on previous session high, low, and close values, adjusted for specific time zone offsets.

Time_Zone_Pivots_with_R3_and_S3
Indicator

Time_Zone_Pivots_with_R3_and_S3

This indicator calculates daily floor and ceiling equilibrium levels by synchronizing historical price extremes with specific geographic GMT offsets.

Tipama
Indicator

Tipama

iMAiMAOnArray

This indicator calculates the variance between twin exponential moving averages to derive a primary momentum oscillator, subsequently smoothed by a simple moving average to generate a reactive histogram of trend velocity.

TLB
Indicator

TLB

This indicator identifies significant price structural shifts by tracking multi-step price extremes and plotting hierarchical breakout zones based on sequential local high and low transitions.

TM2
Indicator

TM2

This indicator visualizes the price midpoint of a rolling lookback window compared against a lagged version to identify structural momentum shifts.

TMA
Indicator

TMA

This indicator calculates a weighted moving average by assigning progressively higher importance to recent price data, creating a balanced trend line that minimizes lagging while smoothing volatility.

TMAcentered
Indicator

TMAcentered

iMA

This indicator calculates a centered moving average by applying a triangular distribution of weights to price data, creating a balanced equilibrium curve.

tmagiq
Indicator

tmagiq

iADXiMAiMAOnArray

This indicator quantifies price volatility by calculating the absolute variance between three moving averages and scaling the resulting magnitude by the ADX directional difference.

TMA_v1
Indicator

TMA_v1

The algorithm calculates a trend line by applying a triangular weighting system where central price points carry higher influence than peripheral values in the lookback period.

TMA_v2
Indicator

TMA_v2

This indicator computes a smoothed price trend by applying a triangular weighting distribution across a specified lookback period to emphasize central data points.