test_5close_up_v31
Download script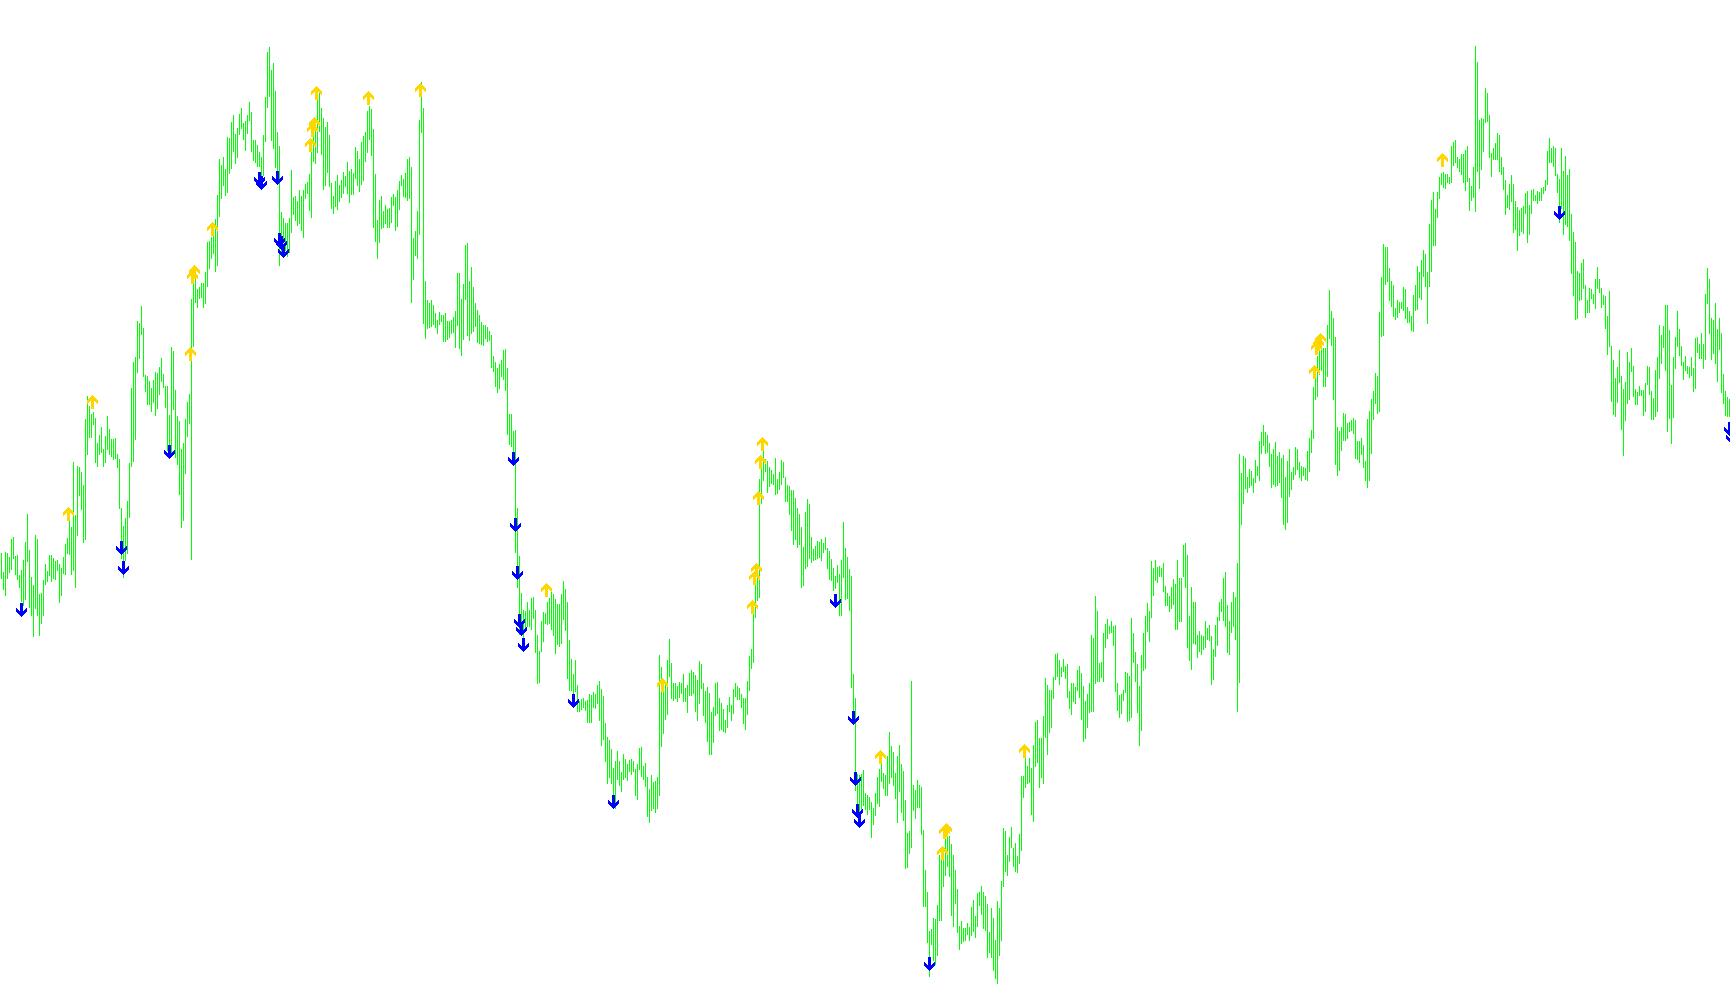
This custom indicator for MetaTrader is designed to identify specific price momentum trends by analyzing the relationship between consecutive price points on a chart. Instead of looking at standard closing prices alone, it uses a "Typical" value calculation—a method that combines the high, low, and closing prices of a candle to create a more balanced representation of the market's movement during that period.
How the Logic Works
The script scans the historical data on your chart to look for continuous, sequential movements in these typical price values over a six-period window. It essentially checks if the price is moving in a consistent "staircase" pattern:
1. Identifying Downward Momentum The tool looks for instances where the typical price has been steadily decreasing for five consecutive periods. Specifically, it verifies that each new period's price point is lower than the one before it, creating a clear descending trend. When this specific pattern of continuous decline is detected, the script places a visual marker (a red arrow) on the chart to signal this downward movement.
2. Identifying Upward Momentum Conversely, the tool looks for a perfectly consistent upward "staircase." It checks if each price point over a six-period sequence is higher than the previous one. If the price has been consistently climbing without any dips in these typical values, the script places a visual marker (a white arrow) to highlight the sustained upward momentum.
Key Features
- Balanced Analysis: By using a combination of High, Low, and Close prices rather than just the closing price, the indicator attempts to capture a more complete picture of market volatility within each candle.
- Visual Signaling: The script translates complex mathematical sequences into simple visual cues, allowing traders to quickly see where consistent trends have been established.
- Automated Historical Scanning: The logic automatically moves backward through your chart history to identify every instance where these specific momentum patterns occurred, providing a historical view of trend consistency.
//+------------------------------------------------------------------+
//| test.mq4                                                         |
//+------------------------------------------------------------------+
#property copyright "Ron T"
#property link      "http://www.lightpatch.com"

#property indicator_chart_window
#property indicator_buffers 4
#property indicator_color1 White
#property indicator_color2 Red
#property indicator_color3 Red
#property indicator_color4 White

//---- buffers
double ExtMapBuffer1[];
double ExtMapBuffer2[];
double ExtMapBuffer3[];
double ExtMapBuffer4[];

// User Input
extern double Gap_Size=0.0030;


//+------------------------------------------------------------------+
//| Custom indicator initialization function                         |
//|------------------------------------------------------------------|

int init()
  {

   SetIndexStyle(0,DRAW_ARROW);
   SetIndexBuffer(0, ExtMapBuffer1);
   SetIndexArrow(0,233); //up red

   SetIndexStyle(1,DRAW_ARROW);
   SetIndexBuffer(1, ExtMapBuffer2);
   SetIndexArrow(1,234); //down white

   SetIndexStyle(2,DRAW_ARROW);
   SetIndexBuffer(2, ExtMapBuffer3);
   SetIndexArrow(2,168);  // Red

   SetIndexStyle(3,DRAW_ARROW);
   SetIndexBuffer(3, ExtMapBuffer4);
   SetIndexArrow(3,168);  // White

   return(0);
  }


//+------------------------------------------------------------------+
//| Custor indicator deinitialization function                       |
//+------------------------------------------------------------------+
int deinit()
  {
   int i;

   for( i=0; i<Bars; i++ ) ExtMapBuffer1[i]=0;
   for( i=0; i<Bars; i++ ) ExtMapBuffer2[i]=0;
   for( i=0; i<Bars; i++ ) ExtMapBuffer3[i]=0;
   for( i=0; i<Bars; i++ ) ExtMapBuffer4[i]=0;

   return(0);
  }


//+------------------------------------------------------------------+
//| Custom indicator iteration function                              |
//+------------------------------------------------------------------+
int start()
  {
   double oTYP0=0, oTYP1=0, oTYP2=0, oTYP3=0, oTYP4=0, oTYP5=0;

   int pos=Bars;

   while(pos>=0)
     {
      // six-period typical
      oTYP0=(High[pos+0]+Low[pos+0]+Close[pos+0]+Close[pos+0])/4;
      oTYP1=(High[pos+1]+Low[pos+1]+Close[pos+1]+Close[pos+1])/4;
      oTYP2=(High[pos+2]+Low[pos+2]+Close[pos+2]+Close[pos+2])/4;
      oTYP3=(High[pos+3]+Low[pos+3]+Close[pos+3]+Close[pos+3])/4;
      oTYP4=(High[pos+4]+Low[pos+4]+Close[pos+4]+Close[pos+4])/4;
      oTYP5=(High[pos+5]+Low[pos+5]+Close[pos+5]+Close[pos+5])/4;

      // six-period down
      if(oTYP5>oTYP4 && oTYP4>oTYP3 && oTYP3>oTYP2 && oTYP2>oTYP1 && oTYP1>oTYP0)
        {
         ExtMapBuffer1[pos]=0;
         ExtMapBuffer2[pos]=oTYP0-0.0005;  //down red
        }


      if(oTYP5<oTYP4 && oTYP4<oTYP3 && oTYP3<oTYP2 && oTYP2<oTYP1 && oTYP1<oTYP0)
        {
         // six-period up
         ExtMapBuffer1[pos]=oTYP0+0.0005;  //up white
         ExtMapBuffer2[pos]=0;
        }
 	   pos--;
     }

   return(0);
  }
//+------------------------------------------------------------------+
Comments