test_5F5close_up_v31
Download script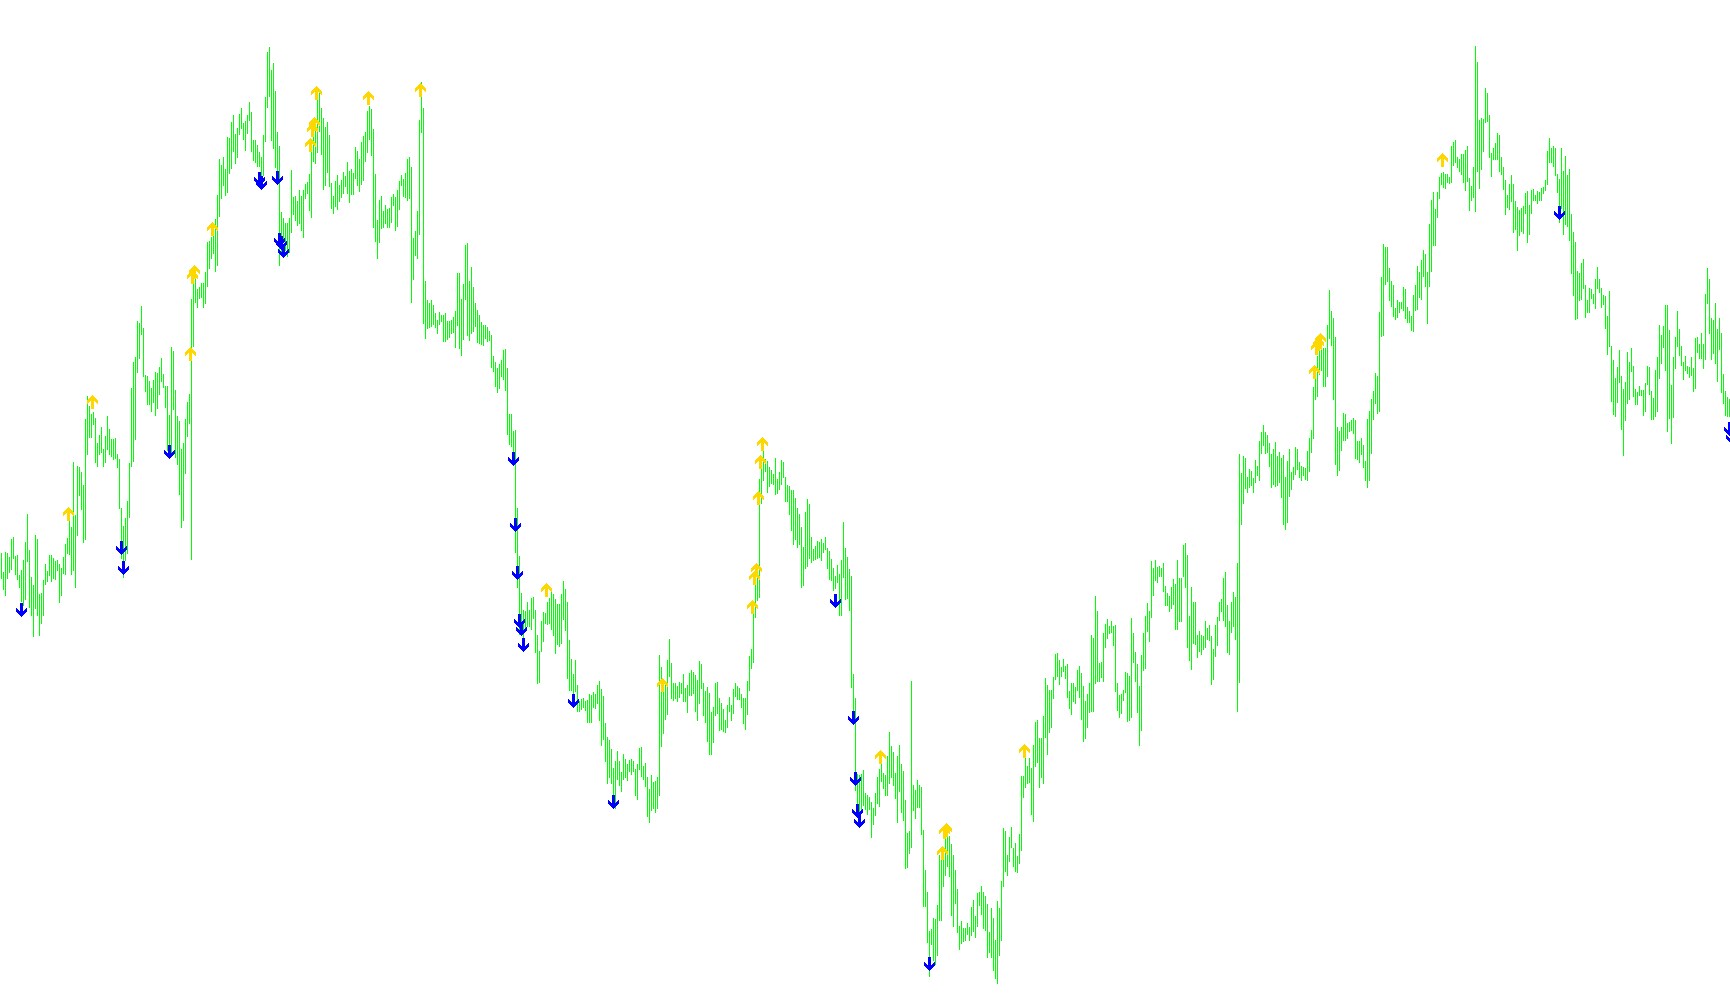
This script is a specialized technical analysis tool designed to identify specific momentum trends on a trading chart. It functions by analyzing the relationship between consecutive price movements over a short, rolling window of time to signal potential trend exhaustion or reversals.
Core Logic and Methodology
The tool operates by calculating a specific type of price average—the "Typical Price"—for each candle. Unlike a simple closing price, this calculation takes into account the highest point (High), the lowest point (Low), and the closing price of the candle to provide a more balanced view of market activity.
The script specifically looks at a sequence of the six most recent price points. It evaluates these points sequentially to determine if the market is moving in a consistent, unbroken direction.
Signal Generation
The logic identifies two distinct market behaviors:
- Descending Momentum: The tool scans for a continuous "staircase" decline. If the price averages are strictly decreasing over six consecutive periods (where each point is lower than the one before it), the script triggers a visual signal. This suggests that the downward momentum has reached a state of consistent progression.
- Ascending Momentum: Conversely, the tool looks for a continuous "staircase" climb. If the price averages are strictly increasing over six consecutive periods (where each point is higher than the one before it), the script triggers an opposing visual signal. This indicates a sustained period of upward movement.
Visual Representation
To make these insights actionable for a trader, the script translates these mathematical findings into clear visual markers on the chart:
- Trend Markers: When the conditions for consistent downward movement are met, a specific arrow or marker appears to notify the user.
- Trend Markers: When the conditions for consistent upward movement are met, a different colored marker appears to highlight the shift in momentum.
By filtering out minor price fluctuations and focusing only on these sustained six-period sequences, the tool aims to provide users with a clear visual guide to identify established trends at a glance.
/*-----------------------------+
|			       |
| Shared by www.Aptrafx.com    |
|			       |
+------------------------------*/

//+------------------------------------------------------------------+
//| test.mq4                                                         |
//+------------------------------------------------------------------+
#property copyright "Ron T"
#property link      "http://www.lightpatch.com"

#property indicator_chart_window
#property indicator_buffers 4
#property indicator_color1 White
#property indicator_color2 Red
#property indicator_color3 Red
#property indicator_color4 White

//---- buffers
double ExtMapBuffer1[];
double ExtMapBuffer2[];
double ExtMapBuffer3[];
double ExtMapBuffer4[];

// User Input
extern double Gap_Size=0.0030;


//+------------------------------------------------------------------+
//| Custom indicator initialization function                         |
//|------------------------------------------------------------------|

int init()
  {

   SetIndexStyle(0,DRAW_ARROW);
   SetIndexBuffer(0, ExtMapBuffer1);
   SetIndexArrow(0,233); //up red

   SetIndexStyle(1,DRAW_ARROW);
   SetIndexBuffer(1, ExtMapBuffer2);
   SetIndexArrow(1,234); //down white

   SetIndexStyle(2,DRAW_ARROW);
   SetIndexBuffer(2, ExtMapBuffer3);
   SetIndexArrow(2,168);  // Red

   SetIndexStyle(3,DRAW_ARROW);
   SetIndexBuffer(3, ExtMapBuffer4);
   SetIndexArrow(3,168);  // White

   return(0);
  }


//+------------------------------------------------------------------+
//| Custor indicator deinitialization function                       |
//+------------------------------------------------------------------+
int deinit()
  {
   int i;

   for( i=0; i<Bars; i++ ) ExtMapBuffer1[i]=0;
   for( i=0; i<Bars; i++ ) ExtMapBuffer2[i]=0;
   for( i=0; i<Bars; i++ ) ExtMapBuffer3[i]=0;
   for( i=0; i<Bars; i++ ) ExtMapBuffer4[i]=0;

   return(0);
  }


//+------------------------------------------------------------------+
//| Custom indicator iteration function                              |
//+------------------------------------------------------------------+
int start()
  {
   double oTYP0=0, oTYP1=0, oTYP2=0, oTYP3=0, oTYP4=0, oTYP5=0;

   int pos=Bars;

   while(pos>=0)
     {
      // six-period typical
      oTYP0=(High[pos+0]+Low[pos+0]+Close[pos+0]+Close[pos+0])/4;
      oTYP1=(High[pos+1]+Low[pos+1]+Close[pos+1]+Close[pos+1])/4;
      oTYP2=(High[pos+2]+Low[pos+2]+Close[pos+2]+Close[pos+2])/4;
      oTYP3=(High[pos+3]+Low[pos+3]+Close[pos+3]+Close[pos+3])/4;
      oTYP4=(High[pos+4]+Low[pos+4]+Close[pos+4]+Close[pos+4])/4;
      oTYP5=(High[pos+5]+Low[pos+5]+Close[pos+5]+Close[pos+5])/4;

      // six-period down
      if(oTYP5>oTYP4 && oTYP4>oTYP3 && oTYP3>oTYP2 && oTYP2>oTYP1 && oTYP1>oTYP0)
        {
         ExtMapBuffer1[pos]=0;
         ExtMapBuffer2[pos]=oTYP0-0.0005;  //down red
        }


      if(oTYP5<oTYP4 && oTYP4<oTYP3 && oTYP3<oTYP2 && oTYP2<oTYP1 && oTYP1<oTYP0)
        {
         // six-period up
         ExtMapBuffer1[pos]=oTYP0+0.0005;  //up white
         ExtMapBuffer2[pos]=0;
        }
 	   pos--;
     }

   return(0);
  }
//+------------------------------------------------------------------+
Comments