test5_show5ticks_v1
Download script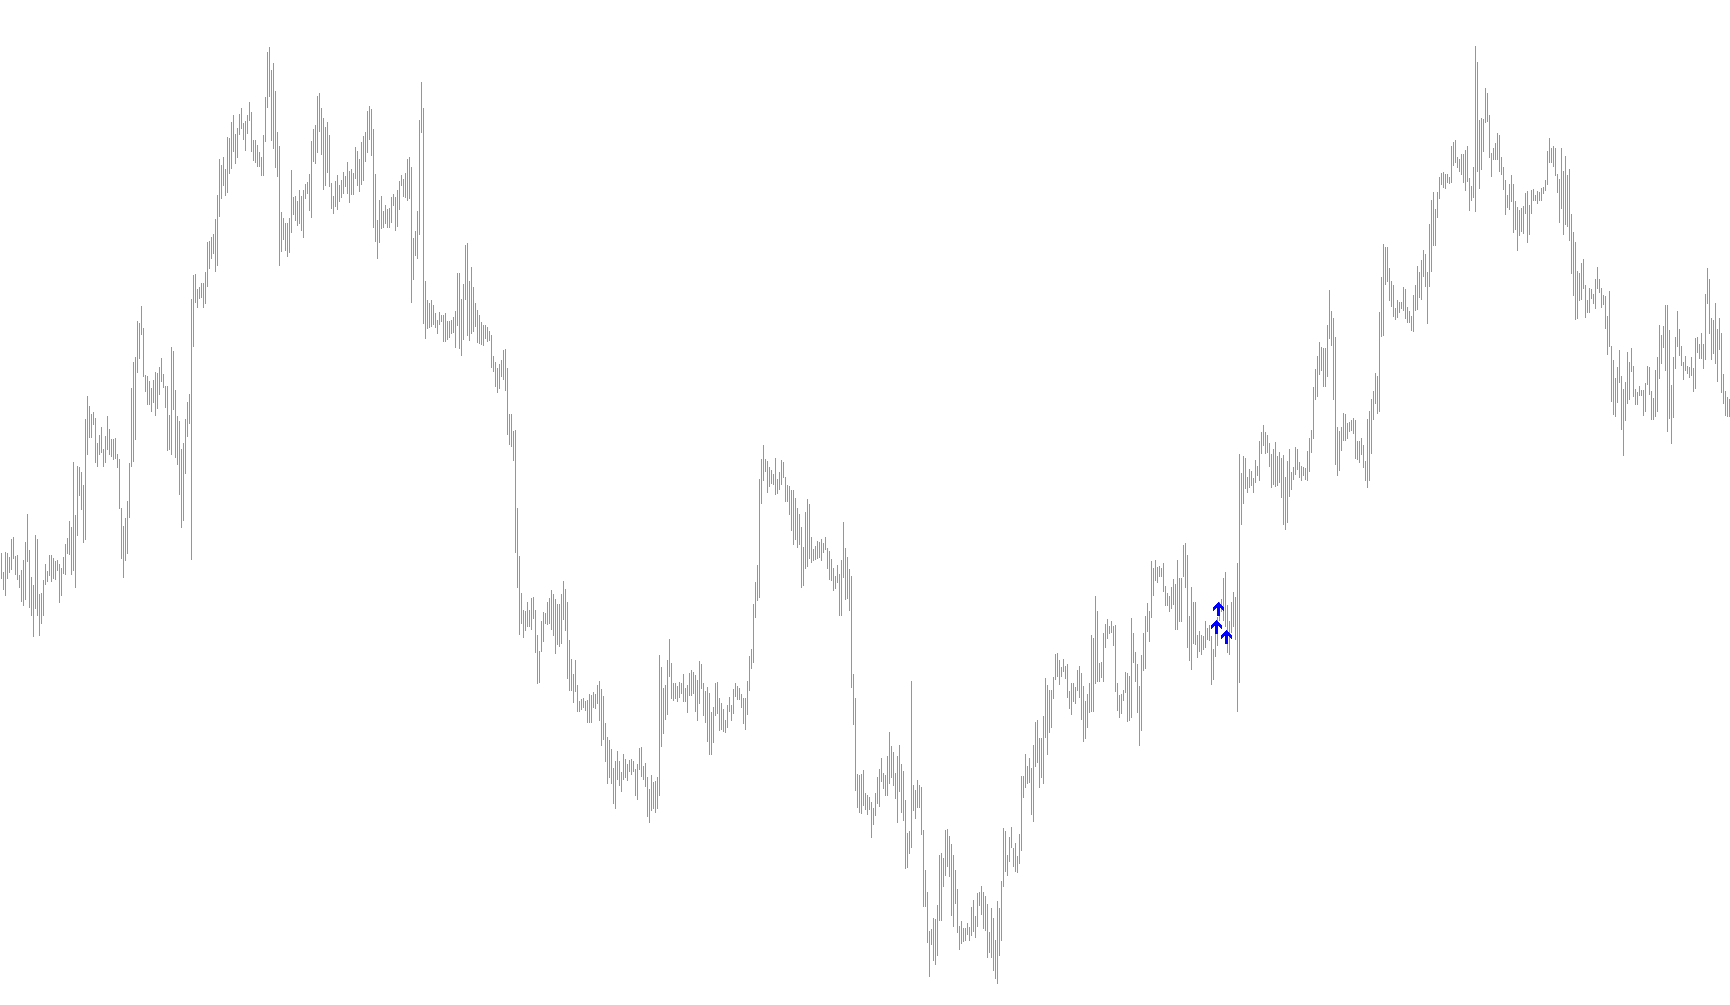
This tool is designed to help traders identify potential momentum shifts in the market by analyzing price action through a specialized moving average calculation. Instead of simply looking at the closing price, it evaluates the relationship between the high, low, and closing prices of each candle to determine the "typical" price level.
How the Logic Works
1. The Core Calculation The script calculates a specific value for every candle on your chart. It takes the highest point reached (High), the lowest point reached (Low), and the final closing price (Close) of a bar, then averages them together. This provides a more balanced view of the price action than looking at the close alone.
2. Tracking Momentum Changes The tool focuses on how this "typical" price changes from one candle to the next. It compares the current value against the previous value to measure the speed and direction of the price movement.
3. Identification of Signals The script looks for specific "breakout" thresholds to trigger visual alerts on your chart:
- Downside Movement: If the typical price drops by more than a predefined amount (0.04 units), the script identifies a downward shift and marks it with a red arrow pointing down. This suggests that selling pressure is increasing.
- Upside Movement: If the typical price rises by more than the same amount (0.04 units), the script identifies an upward shift and marks it with a white arrow pointing up. This suggests that buying momentum is taking over.
Summary for Traders
Essentially, this indicator filters out minor market noise to highlight significant price swings. It acts as a visual cue: when you see the arrows appearing, it indicates that the price has moved enough in a specific direction to potentially signal a trend change or a strong move in the market, helping you decide whether to look for buying or selling opportunities.
//+------------------------------------------------------------------+
//|                                           MultiMovingAverage.mq4 |
//+------------------------------------------------------------------+
#property copyright "Ron T"
#property link      "http://www.lightpatch.com"

#property indicator_chart_window
#property indicator_buffers 3
#property indicator_color1 Red
#property indicator_color2 White
#property indicator_color3 DeepSkyBlue

//---- buffers
double ExtMapBuffer1[];
double ExtMapBuffer2[];
double ExtMapBuffer3[];


//+------------------------------------------------------------------+
//| Custom indicator initialization function                         |
//|------------------------------------------------------------------|

int init()
  {

   SetIndexStyle(0,DRAW_ARROW);
   SetIndexBuffer(0, ExtMapBuffer1);
   SetIndexArrow(0,234); //down red

   SetIndexStyle(1,DRAW_ARROW);
   SetIndexBuffer(1, ExtMapBuffer2);
   SetIndexArrow(1,233); //up white

   SetIndexStyle(2,DRAW_ARROW);
   SetIndexBuffer(2, ExtMapBuffer3);
   SetIndexArrow(2,224);

   return(0);
  }


//+------------------------------------------------------------------+
//| Custor indicator deinitialization function                       |
//+------------------------------------------------------------------+
int deinit()
  {
   int i;

   for( i=0; i<Bars; i++ ) ExtMapBuffer1[i]=0;
   for( i=0; i<Bars; i++ ) ExtMapBuffer2[i]=0;
   for( i=0; i<Bars; i++ ) ExtMapBuffer3[i]=0;

   return(0);
  }


//+------------------------------------------------------------------+
//| Custom indicator iteration function                              |
//+------------------------------------------------------------------+
int start()
  {
   double curTYP=0;
   double oldTYP=0;
   double change=0;

   int pos=Bars/5;

   Print ("Start SHOW5TICKS with bars=",pos);

   while(pos>=0)
     {
      oldTYP=curTYP;
      curTYP=(High[pos]+Low[pos]+Close[pos])/3;
      change=curTYP-oldTYP;

      if ( change < -0.04 )
        {
         ExtMapBuffer1[pos]=curTYP;  //up white
         ExtMapBuffer2[pos]=0;
         //Print ("would SELL here ",CurTime());
        }

      if ( change > 0.04 )
        {
         ExtMapBuffer1[pos]=0;
         ExtMapBuffer2[pos]=curTYP;  //down red
         //Print ("would BUY  here ",CurTime());
        }

 	   pos--;
     }

   return(0);
  }
//+------------------------------------------------------------------+
Comments