TA_1.14
Indicator

TA_1.14

iCCIiRSIiStochastic

This indicator synchronizes Stochastic, RSI, and CCI oscillators across six distinct timeframes to identify synchronized momentum shifts and trend reversals.
tcf smoothed - T3
Indicator

tcf smoothed - T3

iMA

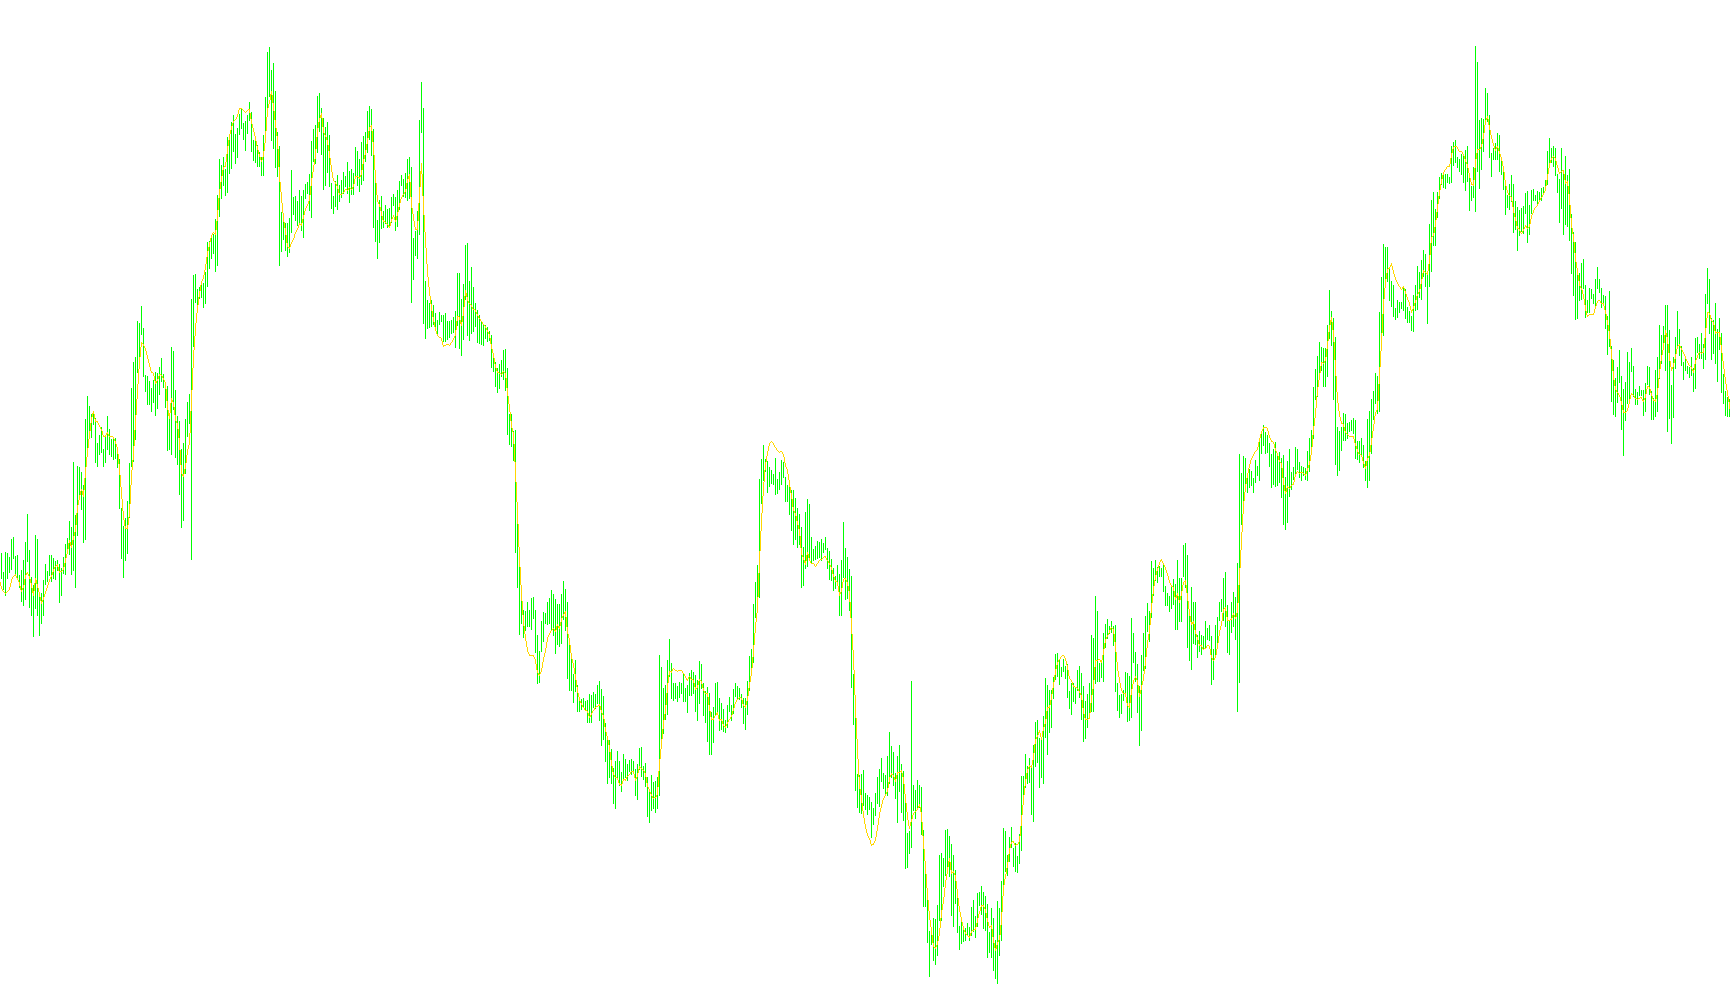
This indicator quantifies momentum by segregating directional rate of change into cumulative additive components, then applying a triple exponential smoothing algorithm to identify persistent trend strength.

tcf
Indicator

tcf

iMA

The indicator quantifies momentum sustainability by aggregating the net difference between cumulative positive and negative Rate of Change components over a specific lookback period.

TD Pivot
Indicator

TD Pivot

This indicator calculates dynamic price levels by deriving a weighted pivot point based on daily candle structure—specifically adjusting the weighting of high, low, and close prices relative to the opening price.

TD Sequential
Indicator

TD Sequential

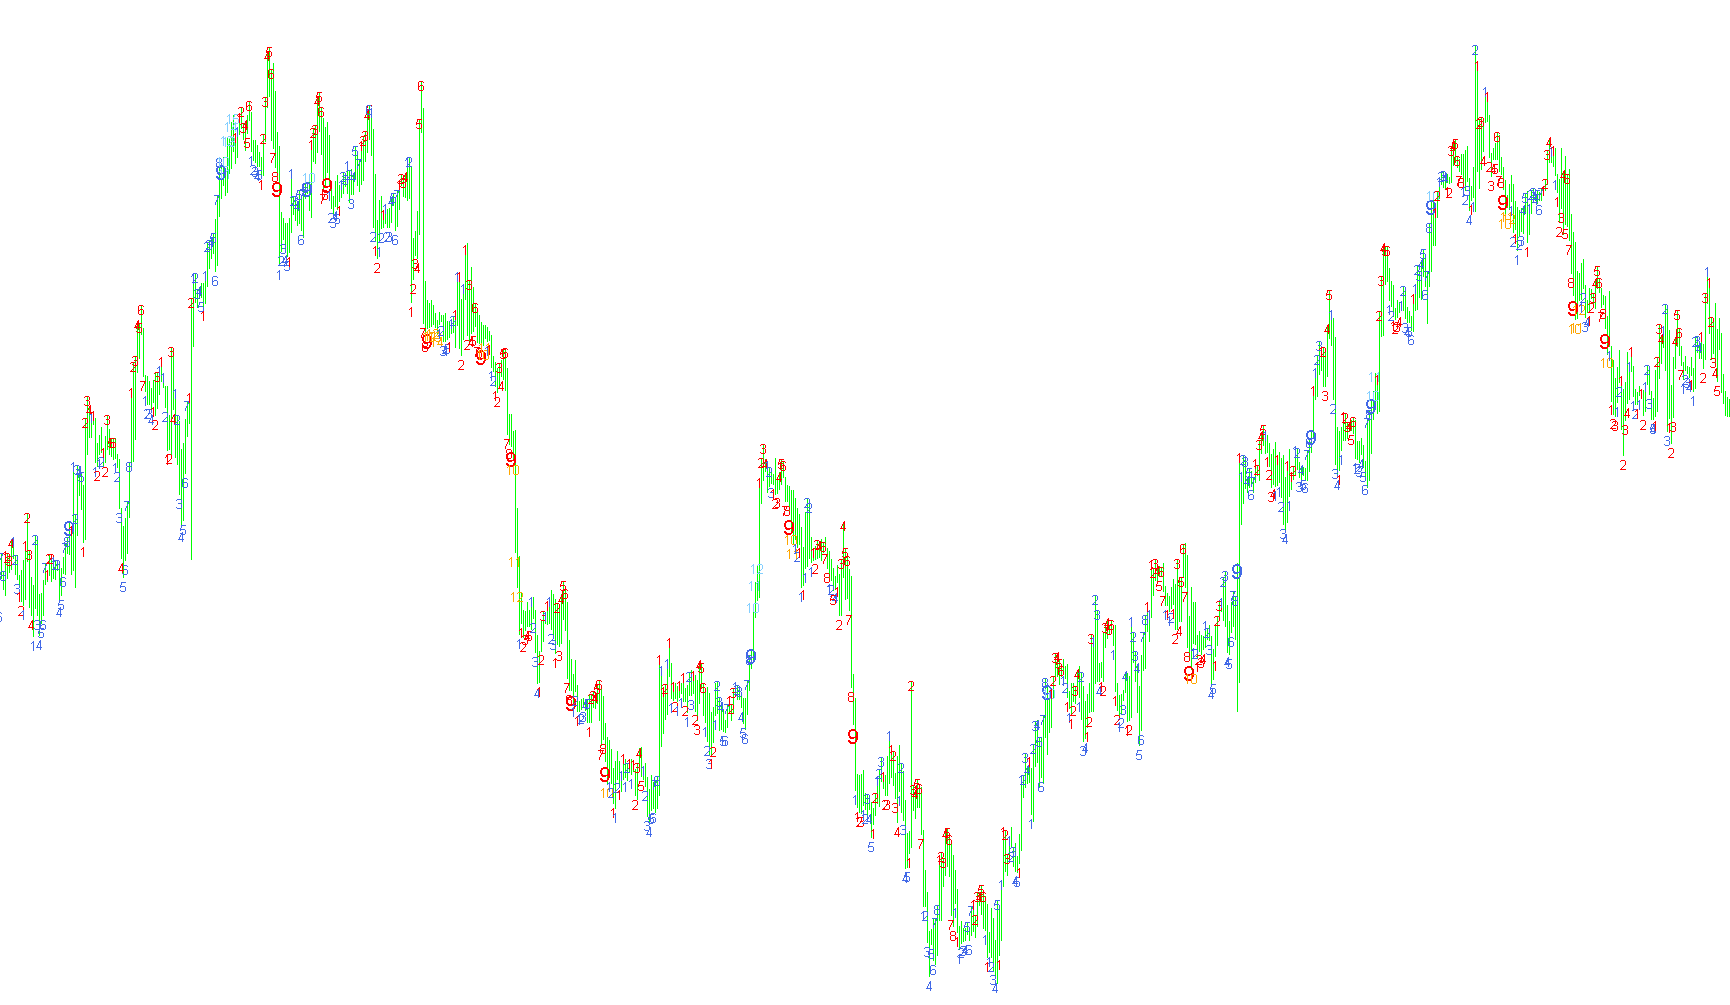
This indicator tracks consecutive price movements by comparing current closing prices against five-bar offsets to visually count momentum cycles with dynamic color coding.

TD Sequential_v1
Indicator

TD Sequential_v1

This indicator identifies price momentum by incrementing numerical values based on consecutive price shifts relative to a five-period historical window.

TD Sequential_v2
Indicator

TD Sequential_v2

This indicator identifies potential trend exhaustion and reversals by quantifying consecutive price movements relative to a five-period lag.

TD Sequential_v3
Indicator

TD Sequential_v3

Identifies persistent trend progression by counting consecutive price movements relative to a five-bar lookback period to highlight potential exhaustion points.

TDCD_TemaDema_rlh
Indicator

TDCD_TemaDema_rlh

iMAiMAOnArray

This indicator quantifies the momentum variance between Triple Exponential Moving Averages (TEMA) and Double Exponential Moving Averages (DEMA) to identify trend acceleration.

TDI-2
Indicator

TDI-2

iMAOnArray

This indicator calculates the difference between smoothed absolute momentum sums and multi-period moving averages to isolate directional price velocity.

TDI-2_001
Indicator

TDI-2_001

iMAOnArray

This indicator calculates a smoothed directional trend by measuring the delta between absolute momentum sums and their multi-period averages to identify price velocity shifts.

TDI-2_v1
Indicator

TDI-2_v1

iMAOnArray

This indicator calculates a trend direction index by analyzing the variance between smoothed momentum values and their absolute averages over a specified lookback period.

TDI-2_v2
Indicator

TDI-2_v2

iMAOnArray

This indicator calculates a directional trend index by contrasting the smoothed absolute sum of price momentum against its weighted cumulative variance.

Indicator

TDI-With Alerts

iMAOnArrayiRSI
TDI
Indicator

TDI

iMAOnArray

Calculates a smoothed directional trend by isolating and subtracting the accelerated component of price momentum fluctuations.

TDIVA cja
Indicator

TDIVA cja

iMAOnArrayiRSI

A hybrid technical indicator that synthesizes RSI price action, moving average signal crossovers, and standard deviation bands to identify trend strength, market consolidation, and multi-tiered entry points.

TDI_v1
Indicator

TDI_v1

iMAOnArray

This indicator identifies market trend strength by calculating the difference between weighted momentum sums and their absolute magnitude variations.

TDI_v2
Indicator

TDI_v2

iMAOnArray

Calculates the trend direction by analyzing the variance between smoothed absolute momentum values and their weighted averages to identify price velocity shifts.

TDM
Indicator

TDM

This script performs a longitudinal historical backtest to aggregate and export statistical metrics based on the chronological order of trading days within each month.

TDpoints&lines
Indicator

TDpoints&lines

This indicator identifies structural pivot highs and lows to project dynamic trend targets based on momentum velocity and historical price extremes.

TDpoints&lines_v1
Indicator

TDpoints&lines_v1

This indicator identifies structural swing points to calculate and project multi-tier linear regression targets based on velocity and historical price extremes.

TDTLModifiedBR
Indicator

TDTLModifiedBR

This indicator identifies Todd Woodbridge (TD) reversal points and constructs dynamic trendlines to project potential price targets based on geometric expansion.

TDTLModifiedBR1
Indicator

TDTLModifiedBR1

This indicator identifies multi-peak and multi-bottom structural points to generate trendline breakouts, horizontal equilibrium zones, and price projection targets based on DeMark methodology.

TDTLModifiedBR_v1
Indicator

TDTLModifiedBR_v1

This indicator identifies trend reversals by detecting DeMark Trading Points and plotting structural trendlines with automated price projection targets.

TDWv3
Indicator

TDWv3

This script quantifies historical market behavior by aggregating price volatility, daily range magnitude, and directional bias across specific weekdays over a multi-year timeframe.

TD_Carrie
Indicator

TD_Carrie

This indicator identifies significant price pivot points by detecting local high and low extremes relative to surrounding candle geometry and directional momentum.

TD_DRP
Indicator

TD_DRP

This indicator calculates and visualizes real-time price volatility boundaries by deriving maximum, median, and minimum deviation levels based on previous candle price action dynamics.

TD_moving_average_I
Indicator

TD_moving_average_I

iMA

This indicator identifies significant price structural pivots by tracking consecutive high and low occurrences within a specific threshold to plot smoothed trend reversals.

TD_Points&Line_Auto
Indicator

TD_Points&Line_Auto

This indicator identifies structural supply and demand zones by calculating linear regression trajectories between pivot highs and lows to project potential reversal targets.

TD_Points&Line_mgtd1.1
Indicator

TD_Points&Line_mgtd1.1

This indicator identifies structural supply and demand zones by projecting linear regression trendlines between significant price pivots to calculate dynamic equilibrium targets.

TD_Points&Line_mgtd1
Indicator

TD_Points&Line_mgtd1

This indicator identifies structural supply and demand zones by calculating linear price gradients between historical extrema to project dynamic break-out targets.

TD_Points_Line_mgtd1.1
Indicator

TD_Points_Line_mgtd1.1

This indicator identifies significant structural supply and demand zones by calculating price velocity and projecting potential reversal targets based on historical pivot extremes.

TD_Points_Line_mgtd1
Indicator

TD_Points_Line_mgtd1

This indicator identifies significant price supply and demand zones based on historical extremes and calculates linear trajectory slopes to project breakout targets and signal entry points.

TD_REI
Indicator

TD_REI

The indicator quantifies price momentum by calculating the ratio of net price displacement to total absolute volatility over a rolling window.

TD_REI_v2
Indicator

TD_REI_v2

This indicator quantifies market momentum by calculating the ratio of cumulative price fluctuations against total absolute volatility over a rolling window.

TD_Sequential
Indicator

TD_Sequential

This indicator identifies potential market exhaustion and trend reversals by counting consecutive price movements relative to a five-bar lookback period.

TD_Sequential_v1
Indicator

TD_Sequential_v1

This indicator identifies consecutive price movements by comparing the immediate closing price against a five-period lag to visually count persistent trends and potential exhaustion points.

TEMa-RV
Indicator

TEMa-RV

iMAiMAOnArray

This indicator utilizes a nested three-stage moving average calculation combined with a smoothing coefficient to filter market noise and identify high-probability trend direction.

TEMa-RV_v1
Indicator

TEMa-RV_v1

iMAiMAOnArray

This indicator executes a multi-stage recursive smoothing process on nested moving averages to filter market noise and identify trend momentum shifts.

TEMA
Indicator

TEMA

iMAiMAOnArray

This indicator calculates a Triple Exponential Moving Average by applying a weighted linear combination of nested EMA layers to reduce lag while maintaining high sensitivity to price fluctuations.

TEMA_RLH
Indicator

TEMA_RLH

iMAiMAOnArray

This indicator calculates the Triple Exponential Moving Average (TEMA) by mathematically compounding nested EMA layers to reduce lag while maintaining high sensitivity to price fluctuations.

TEMA_RLH_v1
Indicator

TEMA_RLH_v1

iMAiMAOnArray

This indicator calculates a high-responsiveness moving average by applying a triple nested exponential smoothing calculation to reduce lag while maintaining trend fidelity.

Tema_rlh_v2
Indicator

Tema_rlh_v2

iMAiMAOnArray

This indicator calculates a high-responsiveness trend line by applying a weighted recursive formula of three nested exponential moving averages to minimize lag while maintaining signal smoothness.

Indicator

temprature

Terminator_MQ4
Indicator

Terminator_MQ4

An automated risk management tool that enforces mandatory position closure and pending order purging based on predefined floating profit thresholds, specific hourly triggers, or manual override signals.

test 5minRSI
Indicator

test 5minRSI

iRSI

The logic identifies sustained price momentum by evaluating if historical RSI values consistently maintain a position above 55 or below 45 to filter out insignificant volatility.

test bars 5
Indicator

test bars 5

This indicator maps historical closing prices onto a visual buffer to identify structural price levels and local fluctuations.

test bars 5_v1
Indicator

test bars 5_v1

Identifies specific price action levels by mapping historical closing data into a dual-buffer coordinate system for visual analysis.

test last 100
Indicator

test last 100

This indicator identifies and plots the absolute historical peak and trough values over a rolling lookback window to visualize extreme price volatility.

test last 100_v1
Indicator

test last 100_v1

The logic identifies and plots the historical extrema by iteratively tracking the highest peak and lowest trough within a rolling lookback period.