test_volume
Download script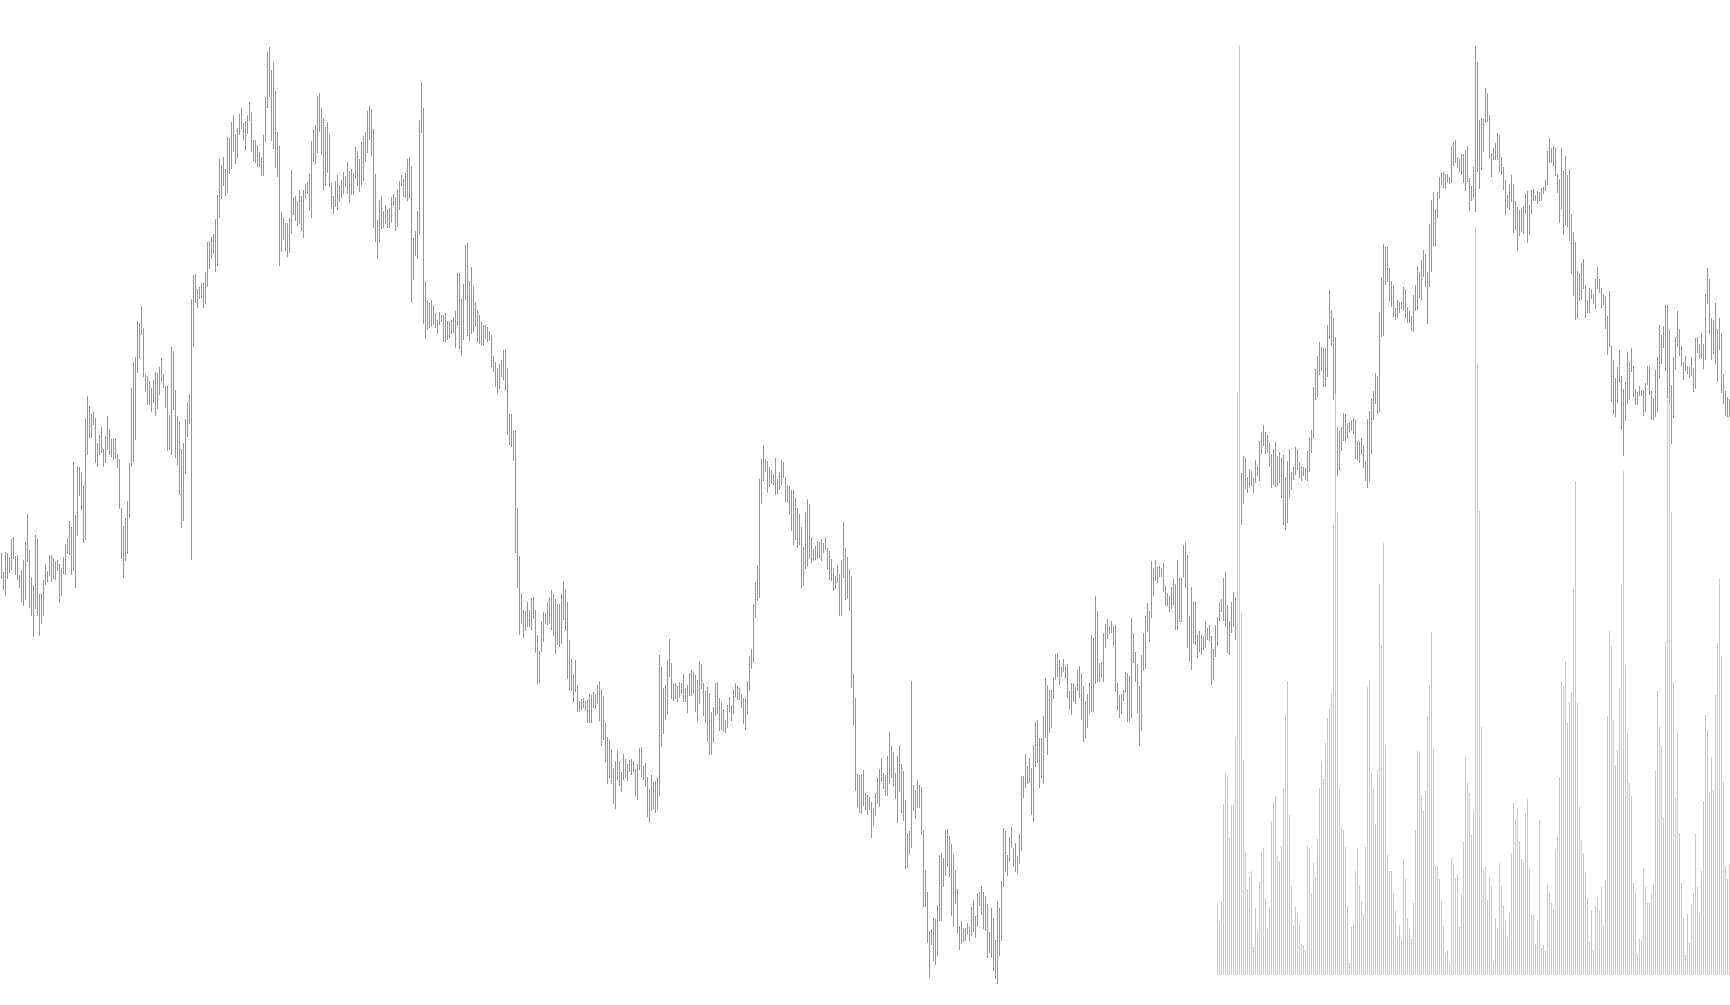
This tool is designed as a visual data overlay for the MetaTrader platform, specifically intended to help traders monitor market activity more clearly. Rather than cluttering the main price chart with complex lines, this script operates in a separate window below your primary trading screen.
Core Functionality
The primary logic of the script centers on Volume Analysis. It captures the historical trading volume for each period and displays it as a histogram (a series of vertical bars). This allows you to see exactly how much activity occurred during specific timeframes at a single glance.
How the Logic Works:
- Data Tracking: The script scans through the available market history to retrieve the "Volume" data—which represents the total amount of trading activity for each bar.
- Visual Representation: Instead of showing raw numbers, it converts this data into a visual histogram. The height of each bar corresponds directly to the volume traded; taller bars indicate periods of high market intensity, while shorter bars represent quieter periods.
- Data Processing: The script processes the historical records starting from a specific point in your chart's history (roughly one-fifth of the total available bars), ensuring that the visual data is presented in an organized and readable sequence.
- Workspace Management: When you activate the indicator, it populates the designated window with these volume metrics. If you remove or disable the indicator, the script includes a cleanup routine to clear those values from the screen, keeping your workspace clean and efficient.
Practical Use for Traders
By isolating volume into its own dedicated section of the screen, this tool allows you to identify trends and "exhaustion" points without the distraction of price fluctuations. It provides a clear visual cue to help you distinguish between high- conviction moves (supported by high volume) and low-interest price movements.
//+------------------------------------------------------------------+
//|                                           MultiMovingAverage.mq4 |
//+------------------------------------------------------------------+
#property copyright "Ron T"
#property link      "http://www.lightpatch.com"

#property indicator_separate_window
#property indicator_buffers 1
#property indicator_color1 White

//---- buffers
double VolBuffer1[];

//+------------------------------------------------------------------+
//| Custom indicator initialization function                         |
//|------------------------------------------------------------------|

int init()
  {

   SetIndexStyle(0,DRAW_HISTOGRAM);
   SetIndexBuffer(0, VolBuffer1);

   return(0);
  }


//+------------------------------------------------------------------+
//| Custor indicator deinitialization function                       |
//+------------------------------------------------------------------+
int deinit()
  {
   int i;

   for( i=0; i<Bars; i++ ) VolBuffer1[i]=0;

   return(0);
  }


//+------------------------------------------------------------------+
//| Custom indicator iteration function                              |
//+------------------------------------------------------------------+
int start()
  {
   double curTYP=0;
   double oldTYP=0;
   double change=0;

   int pos=Bars/5;

   // Print ("Start SHOW5TICKS with bars=",pos);

   while(pos>=0)
     {
      VolBuffer1[pos]=Volume[pos];
 	   pos--;
     }

   return(0);
  }
//+------------------------------------------------------------------+
Comments