test_volumeMA
Download script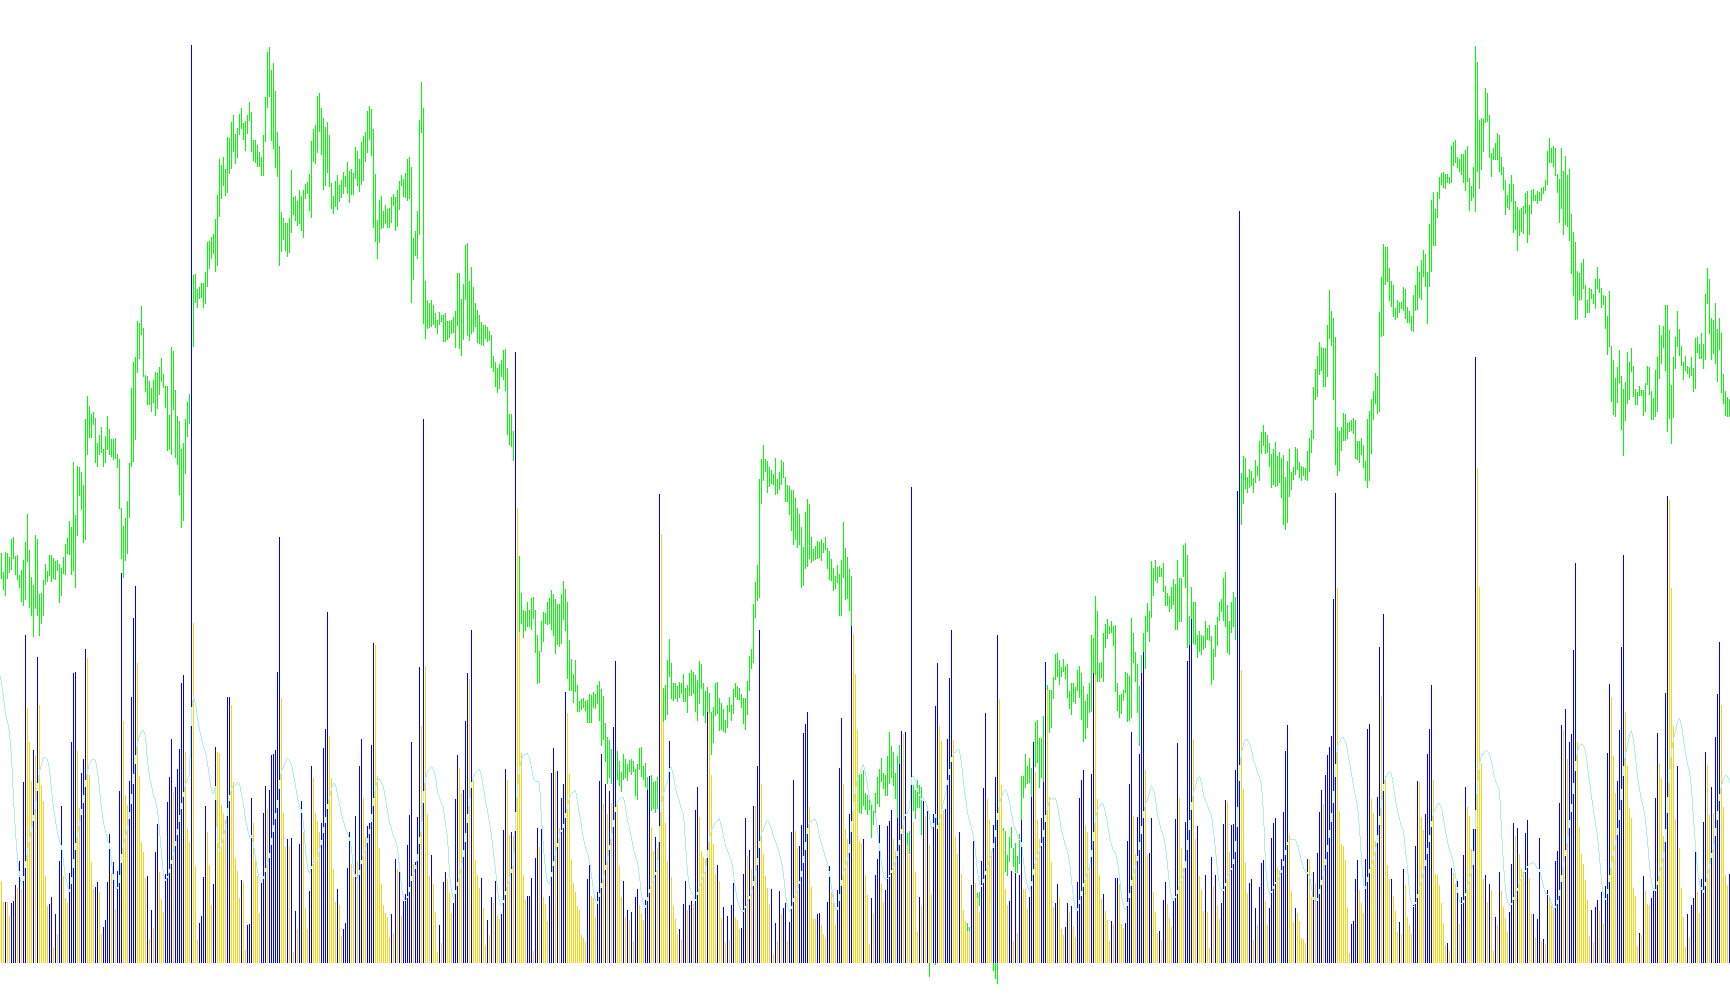
This tool is designed to provide traders with a visual representation of market volume dynamics by combining historical trading activity with a smoothing average. Instead of just showing raw data, it interprets the flow of volume to help identify trends and momentum shifts at a glance.
Core Functionality
The script operates by analyzing the "Volume" (the total amount of assets traded) over specific periods and categorizing that data into three distinct visual components:
1. Dynamic Volume Histograms The tool splits trading volume into two separate visual categories, distinguished by color:
- Red Highlights: These appear when the current volume is lower than the previous period's volume, potentially signaling a decrease in momentum or a cooling-off phase in trading activity.
- Green Highlights: These appear when the current volume is higher than the previous period's volume, highlighting periods of increased market participation and stronger movement.
- Consistency Logic: If the volume remains unchanged between two periods, the tool remembers the previous color to ensure a seamless visual flow on your chart.
2. The Moving Average Line Overlaid on these histograms is a white line representing a Simple Moving Average (SMA). This line calculates the average volume over a user-defined timeframe (the default is set to 13 periods). By smoothing out the "noise" of individual price fluctuations, this line allows you to see the broader trend of trading intensity.
How to Interpret the Data
By viewing these elements together, you can gain a clearer picture of market health:
- Trend Recognition: When the green histograms are consistently tall and the white moving average line is sloping upward, it suggests a period of aggressive buying or selling activity.
- Momentum Shifts: A sudden switch from green to red histograms can alert you to a drop in trading interest, even if the price remains at a similar level.
- Contextual Analysis: The moving average serves as a baseline. When the volume histograms significantly exceed the white line, it indicates "abnormal" activity compared to the recent average, which often precedes major price movements.
Key Settings
The logic includes a customizable period setting that determines how many previous bars are used to calculate the average. This allows you to adjust the sensitivity of the tool—shorter periods react quickly to sudden changes, while longer periods provide a steadier view of long-term volume trends.
/*-----------------------------+
|			       |
| Shared by www.Aptrafx.com    |
|			       |
+------------------------------*/

//+------------------------------------------------------------------+
//| Volume with moving average                                       |
//+------------------------------------------------------------------+
#property copyright "RonT"
#property link      "http://www.lightpatch.com/"

#property indicator_separate_window
#property indicator_buffers 3
#property indicator_color1 Red
#property indicator_color2 Green
#property indicator_color3 White

//---- indicator parameters
extern int MA_Period=13;

//---- indicator buffers
double VolBuffer1[];  // value down
double VolBuffer2[];  // value up
double VolBuffer3[];  // moving average

//----
int ExtCountedBars=0;


//+------------------------------------------------------------------+
//| Custom indicator initialization function                         |
//+------------------------------------------------------------------+
int init()
  {
   int    draw_begin;
   string short_name;

//---- indicator buffers mapping
   SetIndexBuffer(0,VolBuffer1); // histo down red
   SetIndexBuffer(1,VolBuffer2); // histo up green
   SetIndexBuffer(2,VolBuffer3); // line white


//---- drawing settings
   SetIndexStyle(0,DRAW_HISTOGRAM);
   SetIndexStyle(1,DRAW_HISTOGRAM);
   SetIndexStyle(2,DRAW_LINE);

   IndicatorDigits(MarketInfo(Symbol(),MODE_DIGITS));

   if(MA_Period<2) MA_Period=13;
   draw_begin=MA_Period-1;

//---- indicator short name
   short_name="SMA(";
   IndicatorShortName(short_name+MA_Period+")");
   SetIndexDrawBegin(0,draw_begin);

   return(0);
  }


//+------------------------------------------------------------------+
//|                                                                  |
//+------------------------------------------------------------------+
int start()
  {
   if(Bars<=MA_Period) return(0);
   ExtCountedBars=IndicatorCounted();

//---- check for possible errors
   if (ExtCountedBars<0) return(-1);

//---- last counted bar will be recounted
   if (ExtCountedBars>0) ExtCountedBars--;

//+------------------------------------------------------------------+
//| Simple Moving Average                                            |
//+------------------------------------------------------------------+

   double sum=0;
   int    i,pos=Bars-ExtCountedBars-1;
   int    lastcolor=0;

//---- initial accumulation
   if(pos<MA_Period) pos=MA_Period;
   for(i=1;i<MA_Period;i++,pos--)
      sum+=Volume[pos];

//---- main calculation loop

   // 1 - histo down red
   // 2 - histo up green
   // 3 - line white

   while(pos>=0)
     {
      if (Volume[pos+1]>Volume[pos])
        {
         VolBuffer1[pos]=Volume[pos];
         VolBuffer2[pos]=0;
         lastcolor=Red;
        }

      if (Volume[pos+1]<Volume[pos])
        {
         VolBuffer1[pos]=0;
         VolBuffer2[pos]=Volume[pos];
         lastcolor=Green;
        }

      if (Volume[pos+1]==Volume[pos])
        {
         if ( lastcolor==Red )
           {
            VolBuffer1[pos]=Volume[pos];
            VolBuffer2[pos]=0;
           }
         if ( lastcolor==Green )
           {
            VolBuffer1[pos]=0;
            VolBuffer2[pos]=Volume[pos];
           }
        }

      sum+=Volume[pos];
      VolBuffer3[pos]=sum/MA_Period;
	   sum-=Volume[pos+MA_Period-1];

 	   pos--;
     }

//---- zero initial bars
   if(ExtCountedBars<1)
      for(i=1;i<MA_Period;i++) VolBuffer1[Bars-i]=0;
  }

//+------------------------------------------------------------------+
Comments