Ind-NRTR-1
Download script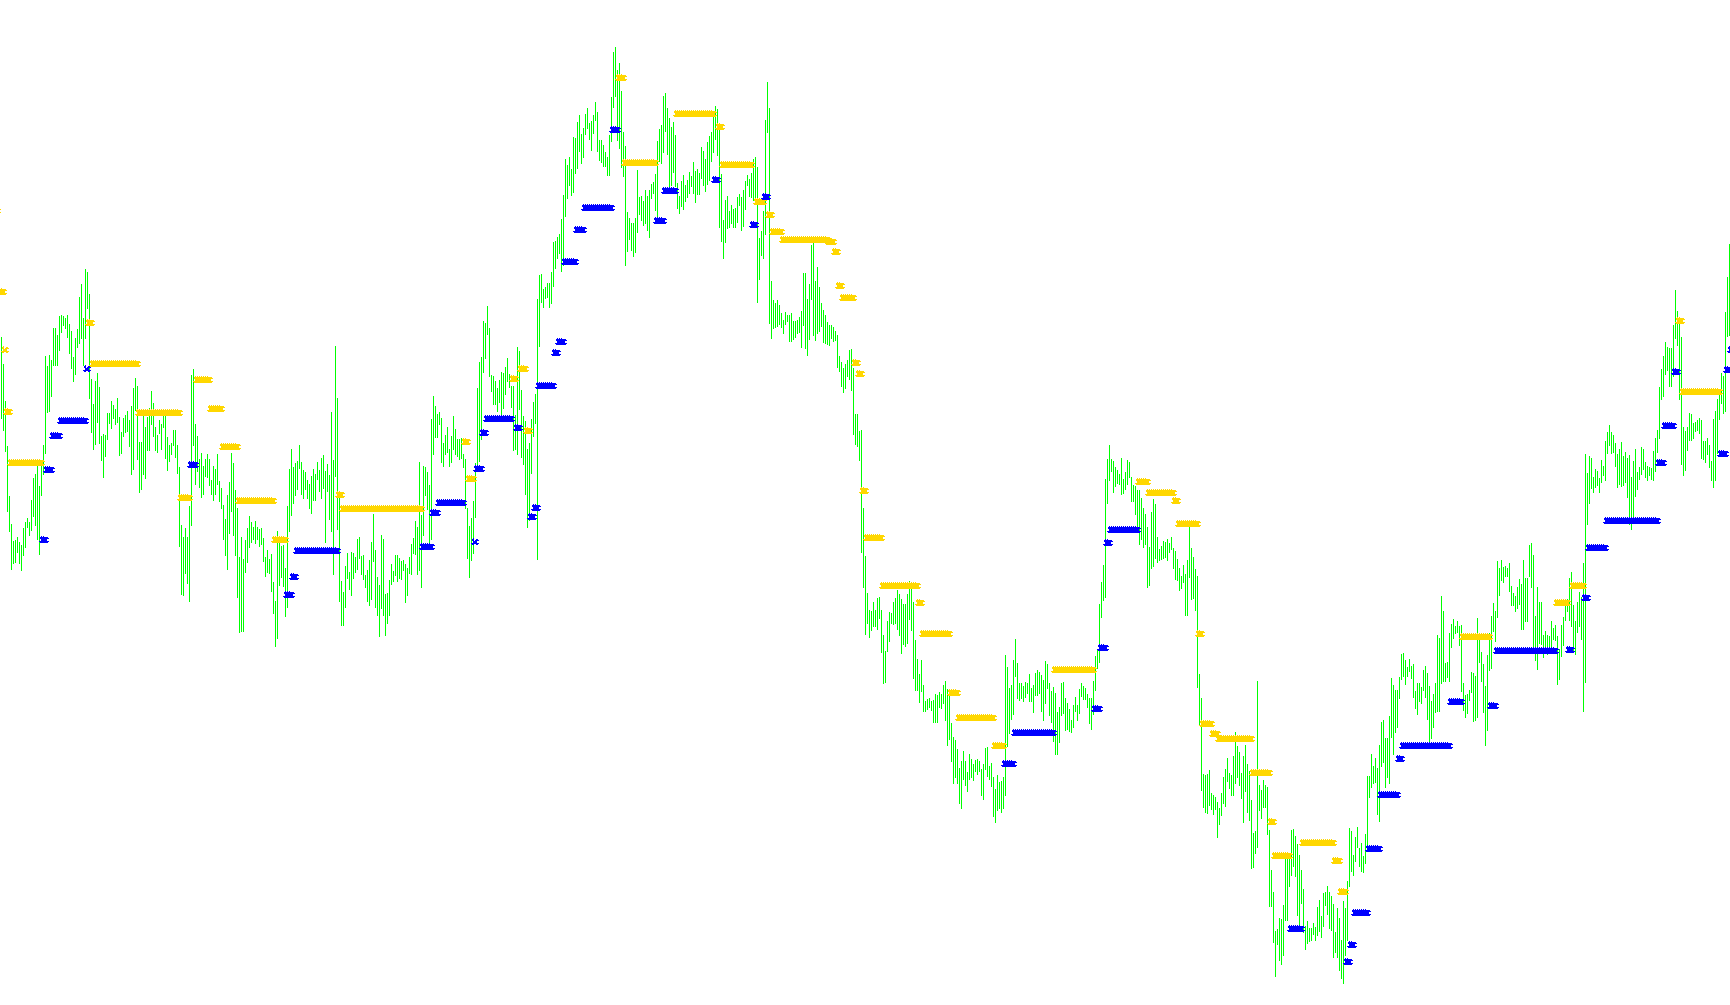
This technical indicator is designed to help traders visualize market trends and identify potential entry or exit points by monitoring price volatility and structural "breakouts." Instead of just looking at raw price movement, it uses a mathematical approach to establish boundaries based on how much the market typically swings.
How the Logic Works
1. Volatility-Based Boundaries The core of this script relies on an Average True Range (ATR) calculation. The ATR measures how much an asset typically moves over a specific period. The indicator takes this volatility measurement and projects it above and below the current price to create dynamic "buffers." Think of these as invisible safety zones that expand or contract based on how "choppy" or "smooth" the market is currently behaving.
2. Trend Identification The script identifies whether the market is in an upward or downward trend by comparing the closing prices of candles. It establishes a "Trend State" which dictates how the indicator behaves:
- In an Uptrend, the logic focuses on finding new highs and maintaining bullish momentum.
- In a Downtrend, the logic focuses on identifying new lows and tracking bearish movement.
3. Dynamic Breakout Detection The script continuously monitors the price to see if it "breaks" through these volatility boundaries or structural levels:
- Ceiling & Floor Updates: When the price moves significantly enough to break a previous high (in an uptrend) or a previous low (in a downtrend), the indicator resets these benchmarks. It essentially "re-anchors" the trend to the new price level.
- Trend Reversals: The script looks for specific instances where the price penetrates deep into the opposite territory. If the price breaks down significantly below a support level or climbs above a resistance level, the script recognizes this as a potential change in market sentiment and flips the trend direction accordingly.
4. Visual Feedback For the user, these complex calculations are simplified into visual markers on the chart:
- It places specific symbols (arrows) to indicate where significant breakthroughs have occurred.
- By distinguishing between "Buy" and "Sell" buffers, it provides a clear visual distinction between areas of bullish support and bearish resistance.
Summary for the Trader
Essentially, this script filters out minor market noise by using volatility as a benchmark. It only reacts when price action is strong enough to break through these calculated zones. When you see a signal, it represents the moment the market has moved with enough force to potentially establish a new trend or confirm a continuation of the existing one.
//+------------------------------------------------------------------+
//|                                                     Ind-NRTR.mq4 |
//|                                         Copyright © 2006, LeonSi |
//|                                      http://www.expert-mt4.nm.ru |
//+------------------------------------------------------------------+
#property copyright "Copyright © 2006, LeonSi"
#property link      "http://www.expert-mt4.nm.ru"

#property indicator_chart_window
#property indicator_buffers 2
#property indicator_color1 Tomato
#property indicator_color2 DeepSkyBlue
//---- input parameters
extern int       PerATR=40;
extern double    kATR=2.0;
//---- buffers
double SellBuffer[];
double BuyBuffer[];
double Ceil[];
double Floor[];
double Trend[];
int sm_Bars;
//+------------------------------------------------------------------+
//| Custom indicator initialization function                         |
//+------------------------------------------------------------------+
int init()
  {
//---- indicators
   IndicatorBuffers(5);

   SetIndexStyle(0,DRAW_ARROW);
   SetIndexArrow(0,251);
   SetIndexBuffer(0,SellBuffer);
   SetIndexEmptyValue(0,0.0);

   SetIndexStyle(1,DRAW_ARROW);
   SetIndexArrow(1,251);
   SetIndexBuffer(1,BuyBuffer);
   SetIndexEmptyValue(1,0.0);

   SetIndexStyle(2,DRAW_ARROW);
   SetIndexArrow(2,159);
   SetIndexBuffer(2,Ceil);
   SetIndexEmptyValue(2,0.0);

   SetIndexStyle(3,DRAW_ARROW);
   SetIndexArrow(3,159);
   SetIndexBuffer(3,Floor);
   SetIndexEmptyValue(3,0.0);

   SetIndexBuffer(4,Trend);
   SetIndexEmptyValue(4,0);
   //----
   return(0);
  }
//+------------------------------------------------------------------+
//| Custor indicator deinitialization function                       |
//+------------------------------------------------------------------+
int deinit()
  {
//----
//----
   return(0);
  }
//+------------------------------------------------------------------+
bool BreakDown(int shift)
  {
   bool result=false;
   if (Close[shift]>SellBuffer[shift+1]) result=true;
   return(result);
  }
//+------------------------------------------------------------------+
bool BreakUp(int shift)
  {
   bool result=false;
   if (Close[shift]<BuyBuffer[shift+1]) result=true;
   return(result);
  }
//+------------------------------------------------------------------+
bool BreakFloor(int shift)
  {
   bool result=false;
   if (High[shift]<Floor[shift+1]) result=true;
   return(result);
  }
//+------------------------------------------------------------------+
bool BreakCeil(int shift)
  {
   bool result=false;
   if (Low[shift]>Ceil[shift+1]) result=true;
   return(result);
  }
//+------------------------------------------------------------------+
bool Uptrend(int shift)
  {
   bool result=false;
   if (Trend[shift+1]==1) result=true;
   if (Trend[shift+1]==-1) result=false;
   if ((Trend[shift+1]!=1)&&(Trend[shift+1]!=-1)) Print("Warning=",(Bars-shift));
   return(result);
  }
//+------------------------------------------------------------------+
double ATR(int iPer,int shift)
  {
   double result;
   result=iATR(NULL,0,iPer,shift);
   return(result);
  }
//+------------------------------------------------------------------+
void NewCeil(int shift)
  {
   Ceil[shift]=Close[shift];
   Floor[shift]=0.0;
  }
//+------------------------------------------------------------------+
void NewFloor(int shift)
  {
   Floor[shift]=Close[shift];
   Ceil[shift]=0.0;
  }
//+------------------------------------------------------------------+
void SetBuyBuffer(int shift)
  {
   BuyBuffer[shift]=Close[shift]-kATR*ATR(PerATR,shift);
   SellBuffer[shift]=0.0;
  }
//+------------------------------------------------------------------+
void SetSellBuffer(int shift)
  {
   SellBuffer[shift]=Close[shift]+kATR*ATR(PerATR,shift);
   BuyBuffer[shift]=0.0;
  }
//+------------------------------------------------------------------+
void NewTrend(int shift)
  {
   if (Trend[shift+1]==1)
      {
      Trend[shift]=-1;
      NewFloor(shift);
      SetSellBuffer(shift);
      }
   else
      {
      Trend[shift]=1;
      NewCeil(shift);
      SetBuyBuffer(shift);
      }
   if ((Trend[shift+1]!=1)&&(Trend[shift+1]!=-1)) Print("Warning",(Bars-shift));
  }
//+------------------------------------------------------------------+
void CopyLastValues(int shift)
  {
   SellBuffer[shift]=SellBuffer[shift+1];
   BuyBuffer[shift]=BuyBuffer[shift+1];
   Ceil[shift]=Ceil[shift+1];
   Floor[shift]=Floor[shift+1];
   Trend[shift]=Trend[shift+1];
  }
//+------------------------------------------------------------------+
//| Custom indicator iteration function                              |
//+------------------------------------------------------------------+
int start()
  {
   int    counted_bars=IndicatorCounted();
   int limit;
   if (counted_bars>0) limit=Bars-counted_bars;
   if (counted_bars<0) return(0);
   if (counted_bars==0)
      {
      limit=Bars-PerATR-1;
      if (Close[limit+1]>Open[limit+1]) {Trend[limit+1]=1;Ceil[limit+1]=Close[limit+1];BuyBuffer[limit+1]=Close[limit+1]-kATR*ATR(PerATR,limit+1);}
      if (Close[limit+1]<Open[limit+1]) {Trend[limit+1]=-1;Floor[limit+1]=Close[limit+1];SellBuffer[limit+1]=Close[limit+1]+kATR*ATR(PerATR,limit+1);}
      if (Close[limit+1]==Open[limit+1]) {Trend[limit+1]=1;Ceil[limit+1]=Close[limit+1];BuyBuffer[limit+1]=Close[limit+1]-kATR*ATR(PerATR,limit+1);}
      }
//----
   for (int cnt=limit;cnt>=0;cnt--)
      {
      if (Uptrend(cnt))
         {
         if (BreakCeil(cnt))
            {
            NewCeil(cnt);
            SetBuyBuffer(cnt);
            Trend[cnt]=1;
            continue;
            }
         if (BreakUp(cnt))
            {
            NewTrend(cnt);
            continue;
            }
         CopyLastValues(cnt);
         }
      else
         {
         if (BreakFloor(cnt))
            {
            NewFloor(cnt);
            SetSellBuffer(cnt);
            Trend[cnt]=-1;
            continue;
            }
         if (BreakDown(cnt))
            {
            NewTrend(cnt);
            continue;
            }
         CopyLastValues(cnt);
         }
      }

//----
   return(0);
  }
Comments