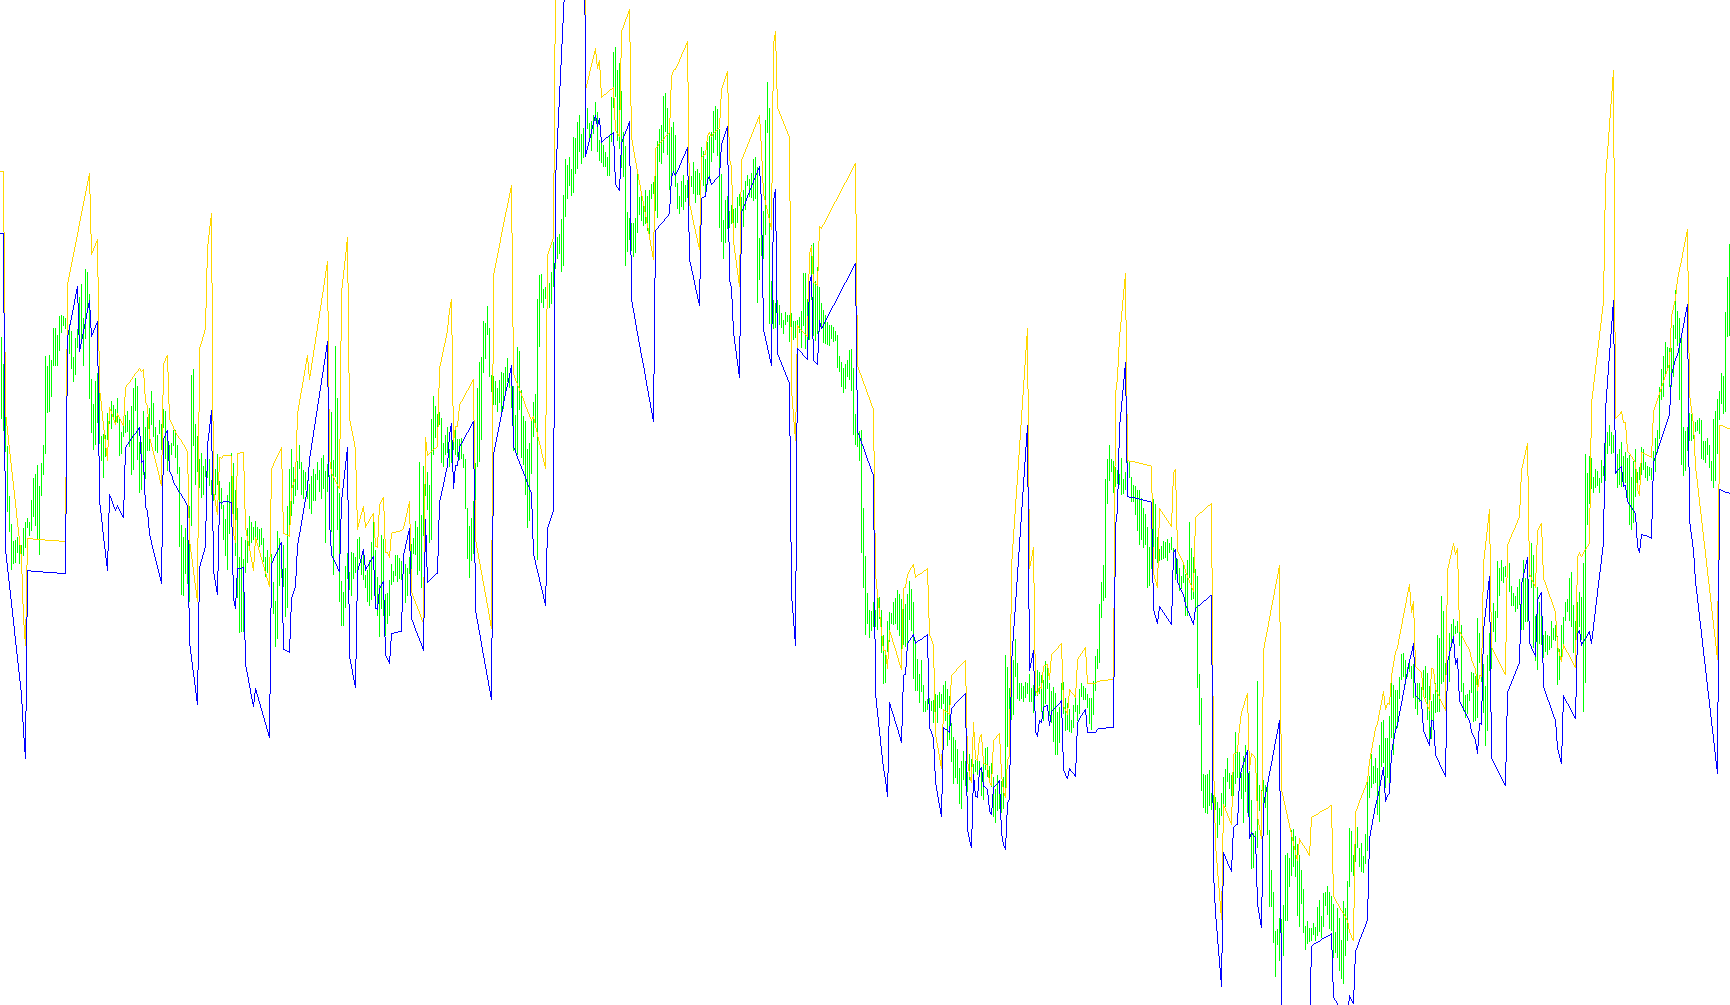
This indicator is designed to provide visual analysis of market structure by identifying and projecting specific price trends based on historical "fractals"—which are essentially the local peaks and valleys in a price chart.
Core Logic and Behavior
The script operates by scanning the recent history of the market to identify significant turning points. It specifically looks for high and low points that stand out against their immediate neighbors. Once it identifies these key structural points, it performs the following operations:
1. Structural Identification The tool scans the price data to find "Upper Fractals" (local ceilings) and "Lower Fractals" (local floors). Instead of looking at just one point, it evaluates a sequence of these peaks and valleys to understand the prevailing shape of the price movement.
2. Trend Projection When the script identifies two significant structural points (for example, two consecutive highs or two consecutive lows), it calculates the trajectory between them. It then uses this data to project "trend lines" onto the current chart.
- If the market is forming a descending pattern of highs, it maps out that downward slope.
- If the market is forming an ascending pattern of lows, it maps out that upward slope.
3. Dynamic Calculation The logic does not just draw static lines; it calculates the expected price levels dynamically. By determining the mathematical rate of change between two historical structural points, the indicator estimates where those levels would sit relative to the current moment in time.
4. Visual Output The results are presented on your chart in two primary ways:
- Trend Lines: The script draws lines that represent the projected paths of the market's highs and lows, helping you visualize potential support and resistance zones.
- Signal Arrows: The indicator utilizes specific symbols (arrows) to highlight key structural points where the logic has confirmed a significant reversal or continuation point.
Summary for Traders
Essentially, this script automates the process of "connecting the dots." It identifies the most important historical peaks and valleys, determines the slope of the trend between them, and draws those lines forward on your chart. This allows you to see the underlying market structure more clearly, helping to identify where price might face resistance or find support based on previous structural behavior.
//+------------------------------------------------------------------+
//|                                                    Ind-SKB-1.mq4 |
//|                            Copyright © 2005, Kara Software Corp. |
//|                                                                  |
//+------------------------------------------------------------------+
#property copyright "Copyright © 2005, Kara Software Corp."
#property link      ""

#property indicator_chart_window
#property indicator_buffers 6
#property indicator_color1 Red
#property indicator_color2 Green
#property indicator_color3 Blue
#property indicator_color4 Blue
#property indicator_color5 FireBrick
#property indicator_color6 FireBrick
//---- buffers
double ExtMapBuffer1[];
double ExtMapBuffer2[];
double ExtMapBuffer3[];
double ExtMapBuffer4[];
double ExtMapBuffer5[];
double ExtMapBuffer6[];
//+------------------------------------------------------------------+
//| Custom indicator initialization function                         |
//+------------------------------------------------------------------+
int init()
  {
//---- indicators
   SetIndexStyle(0,DRAW_LINE);
   SetIndexBuffer(0,ExtMapBuffer1);
   SetIndexStyle(1,DRAW_LINE);
   SetIndexBuffer(1,ExtMapBuffer2);
   SetIndexStyle(2,DRAW_LINE);
   SetIndexBuffer(2,ExtMapBuffer3);
   SetIndexStyle(3,DRAW_LINE);
   SetIndexBuffer(3,ExtMapBuffer4);
   SetIndexStyle(4,DRAW_ARROW);
   SetIndexArrow(4,217);
   SetIndexBuffer(4,ExtMapBuffer5);
   SetIndexEmptyValue(4,0.0);
   SetIndexStyle(5,DRAW_ARROW);
   SetIndexArrow(5,218);
   SetIndexBuffer(5,ExtMapBuffer6);
   SetIndexEmptyValue(5,0.0);
//----
   return(0);
  }
//+------------------------------------------------------------------+
//| Custor indicator deinitialization function                       |
//+------------------------------------------------------------------+
int deinit()
  {
//----

//----
   return(0);
  }
//+------------------------------------------------------------------+
//| Custom indicator iteration function                              |
//+------------------------------------------------------------------+
int start()
  {
   double FU,FL;
   int CCU1,CCU2,CCL1,CCL2,shift,i,j;

   CCU1=0;CCU2=0;CCL1=0;CCL2=0;
   for(shift=Bars-100;shift>=0;shift--)
     {
      FU=0;FL=0;
      FU=iFractals(NULL,0,MODE_UPPER,shift+3);
      FL=iFractals(NULL,0,MODE_LOWER,shift+3);
      if(FU>0)
        {
         i=shift+3+1;
         while(iFractals(NULL,0,MODE_UPPER,i)==0)i++;
         for(j=shift+3;j<=i;j++)
           {
            if(iFractals(NULL,0,MODE_LOWER,j)>0)
              {
               CCU1=shift+3;
               CCU2=i;
               if(CCL1==0)CCL1=j;
               else
                 if(Low[j]<Low[CCL1])CCL1=j;
               CCL2=0;
              }
           }
         if(j==i && High[i]>High[shift+3])FU=0;
        }
      if(FL>0)
        {
         i=shift+3+1;
         while(iFractals(NULL,0,MODE_LOWER,i)==0)i++;
         for(j=shift+3;j<=i;j++)
           {
            if(iFractals(NULL,0,MODE_UPPER,j)>0)
              {
               if(CCU1==0)CCU1=j;
               else
                 if(High[j]>High[CCU1])CCU1=j;
               CCU2=0;
               CCL1=shift+3;
               CCL2=i;
              }
           }
        }


      if(CCU1>0 && CCU2>0)
        {
         if(High[CCU1]>High[CCU2])
           {
            ExtMapBuffer1[shift]=High[CCU1]+(High[CCU1]-High[CCU2])/(CCU2-CCU1)*(CCU1-shift);
            ExtMapBuffer2[shift]=Low[CCL1]+(High[CCU1]-High[CCU2])/(CCU2-CCU1)*(CCL1-shift);
           }
         if(High[CCU1]<High[CCU2])
           {
            ExtMapBuffer1[shift]=High[CCU1]-(High[CCU2]-High[CCU1])/(CCU2-CCU1)*(CCU1-shift);
            ExtMapBuffer2[shift]=Low[CCL1]-(High[CCU2]-High[CCU1])/(CCU2-CCU1)*(CCL1-shift);
           }
        }
      if(CCL1>0 && CCL2>0)
        {
         if(Low[CCL1]<Low[CCL2])
           {
            ExtMapBuffer1[shift]=High[CCU1]-(Low[CCL2]-Low[CCL1])/(CCL2-CCL1)*(CCU1-shift);
            ExtMapBuffer2[shift]=Low[CCL1]-(Low[CCL2]-Low[CCL1])/(CCL2-CCL1)*(CCL1-shift);
           }
         if(Low[CCL1]>Low[CCL2])
           {
            ExtMapBuffer1[shift]=High[CCU1]+(Low[CCL1]-Low[CCL2])/(CCL2-CCL1)*(CCU1-shift);
            ExtMapBuffer2[shift]=Low[CCL1]+(Low[CCL1]-Low[CCL2])/(CCL2-CCL1)*(CCL1-shift);
           }
        }
     }
   return(0);
  }
//+------------------------------------------------------------------+
Comments