i-Regr_tail_trail
Indicator

i-Regr_tail_trail

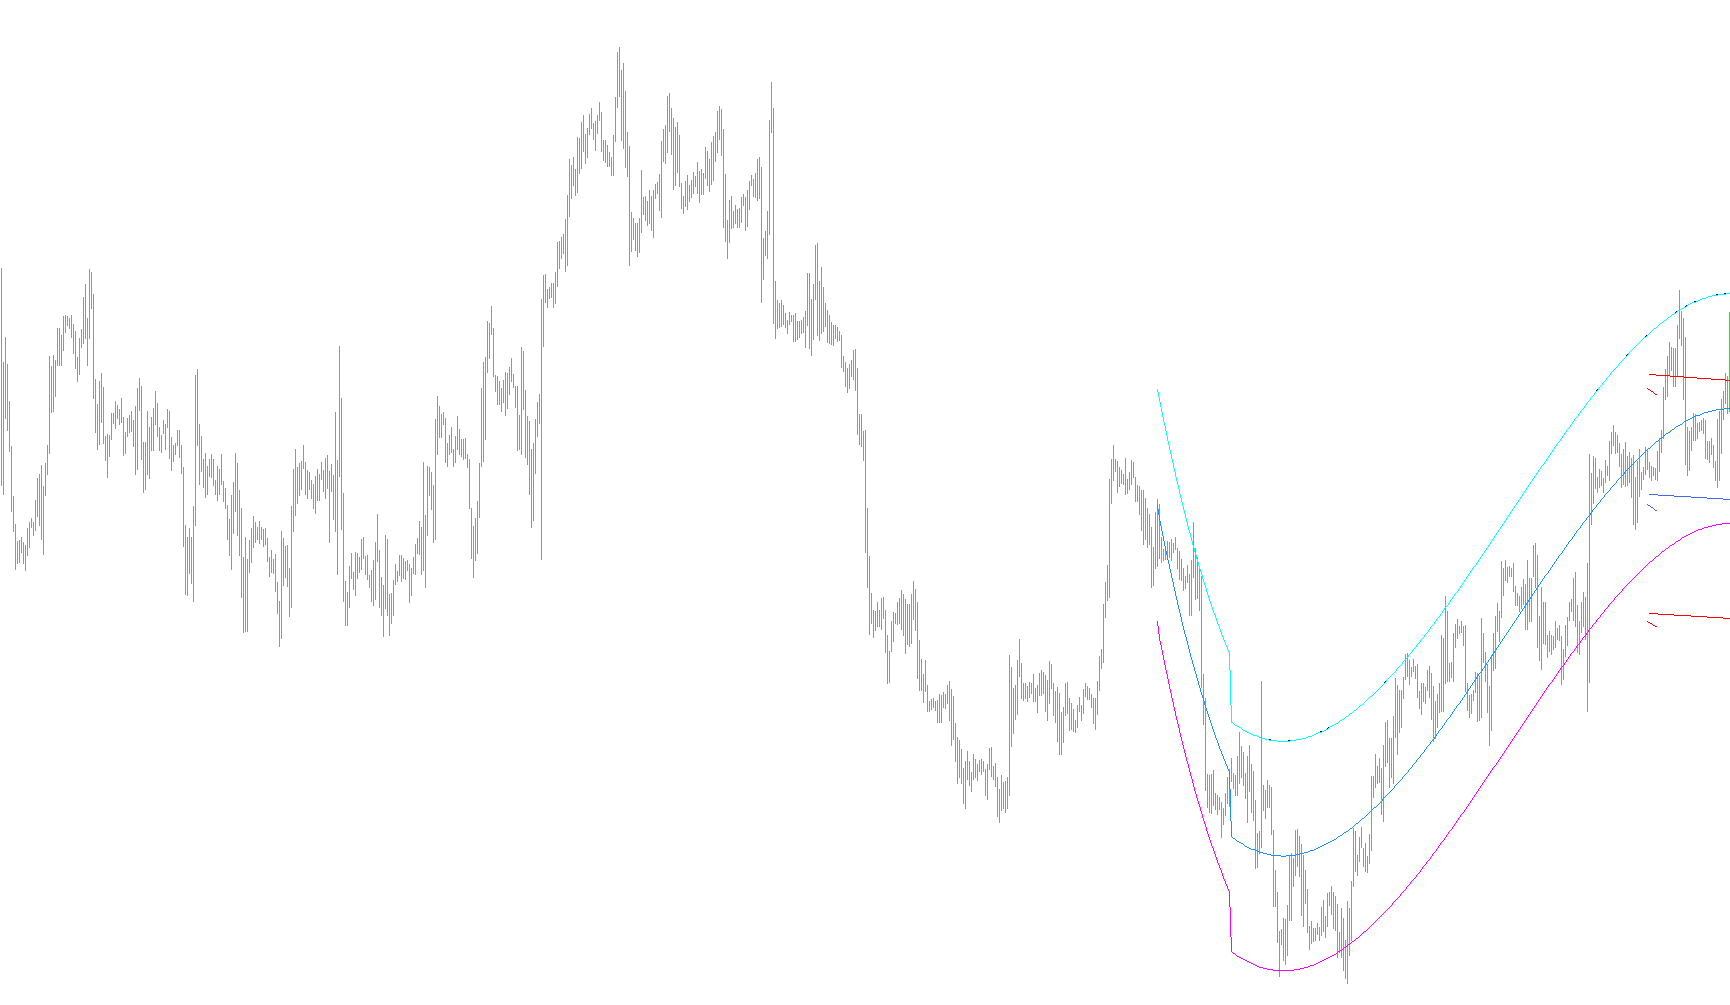
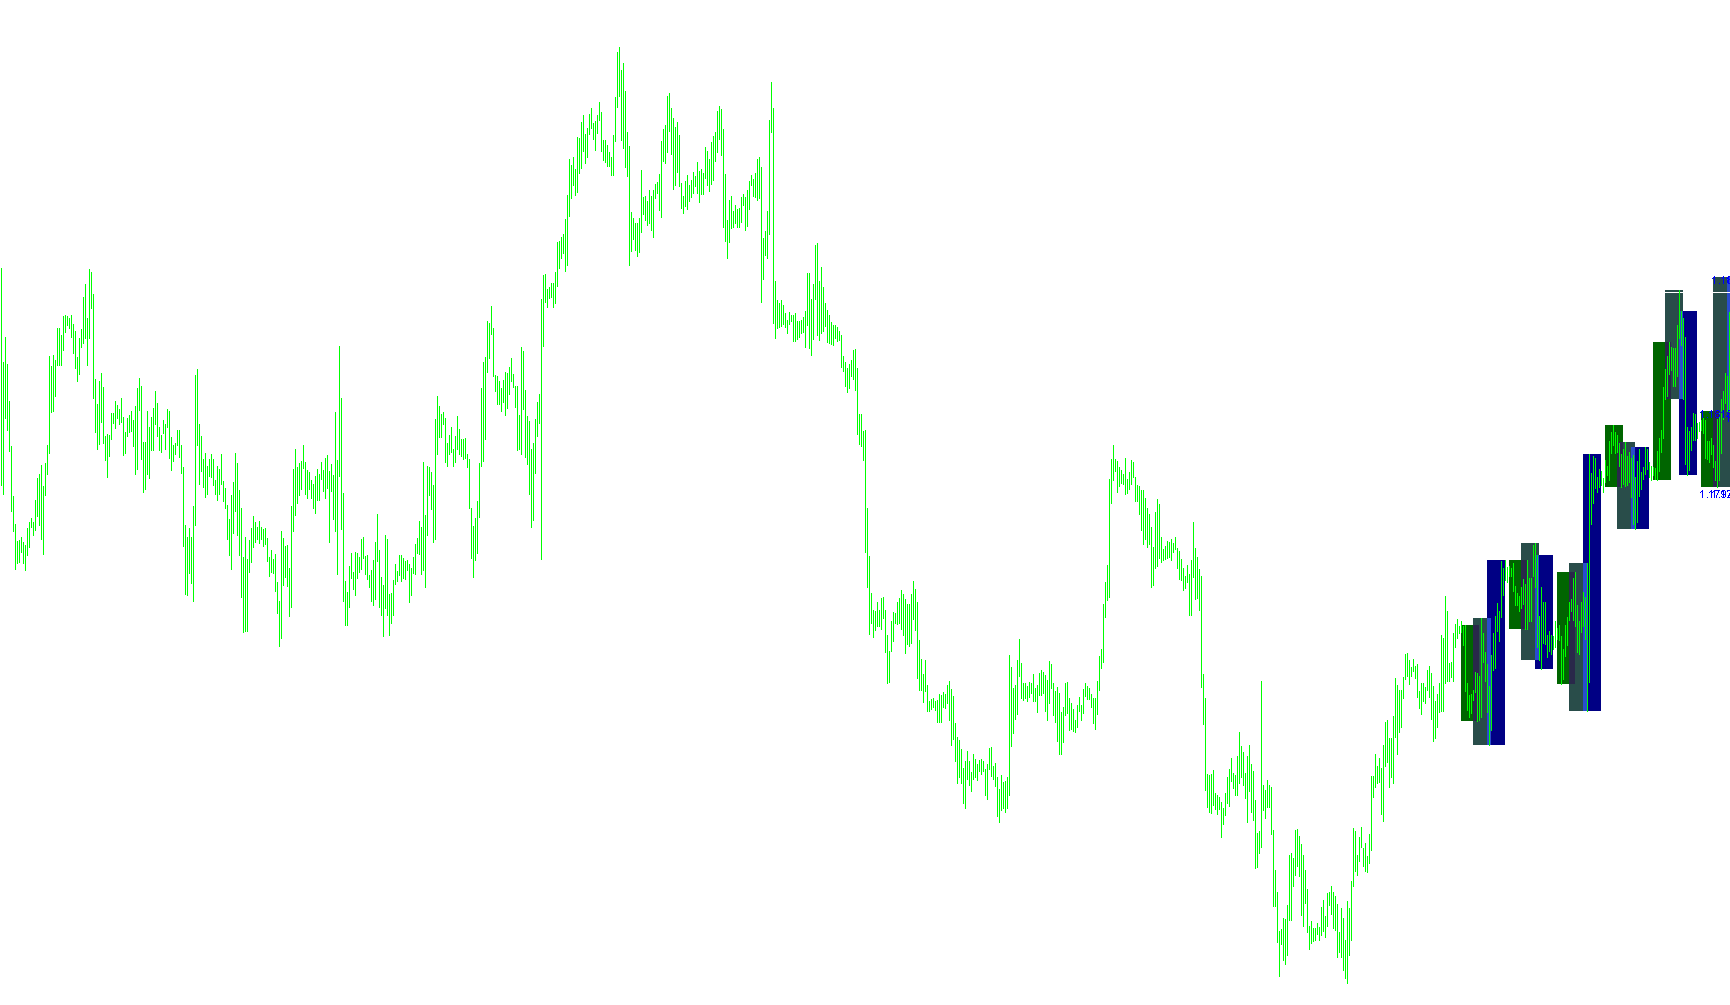
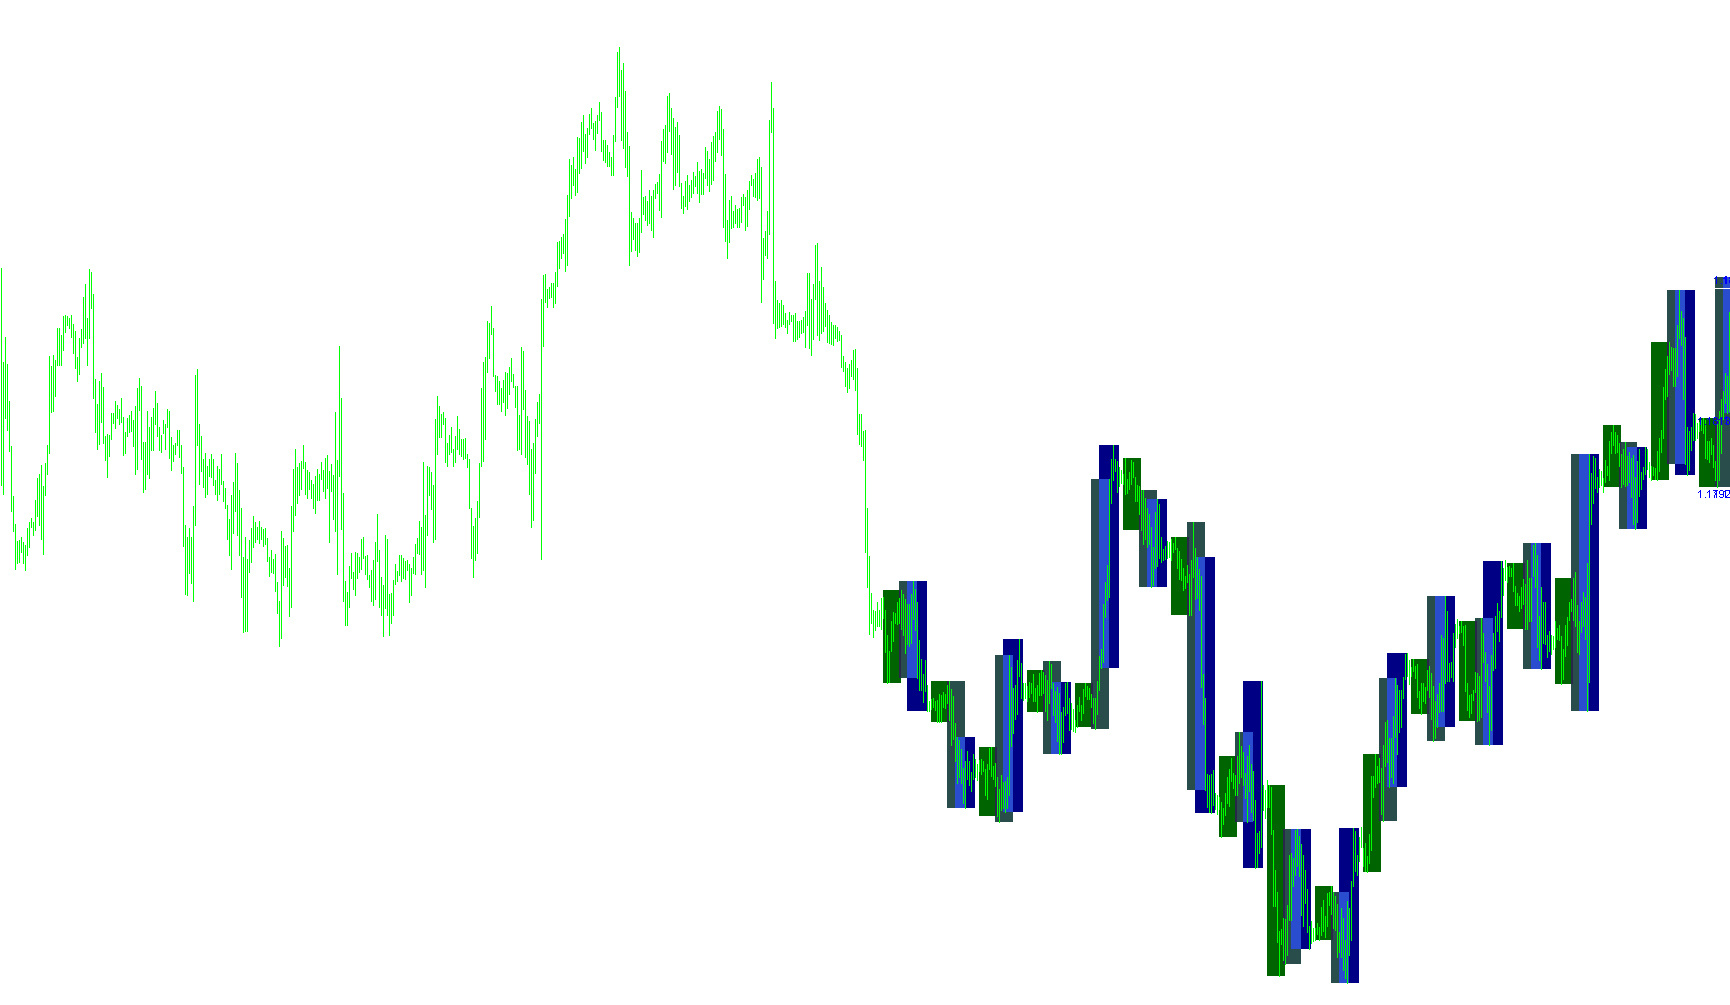
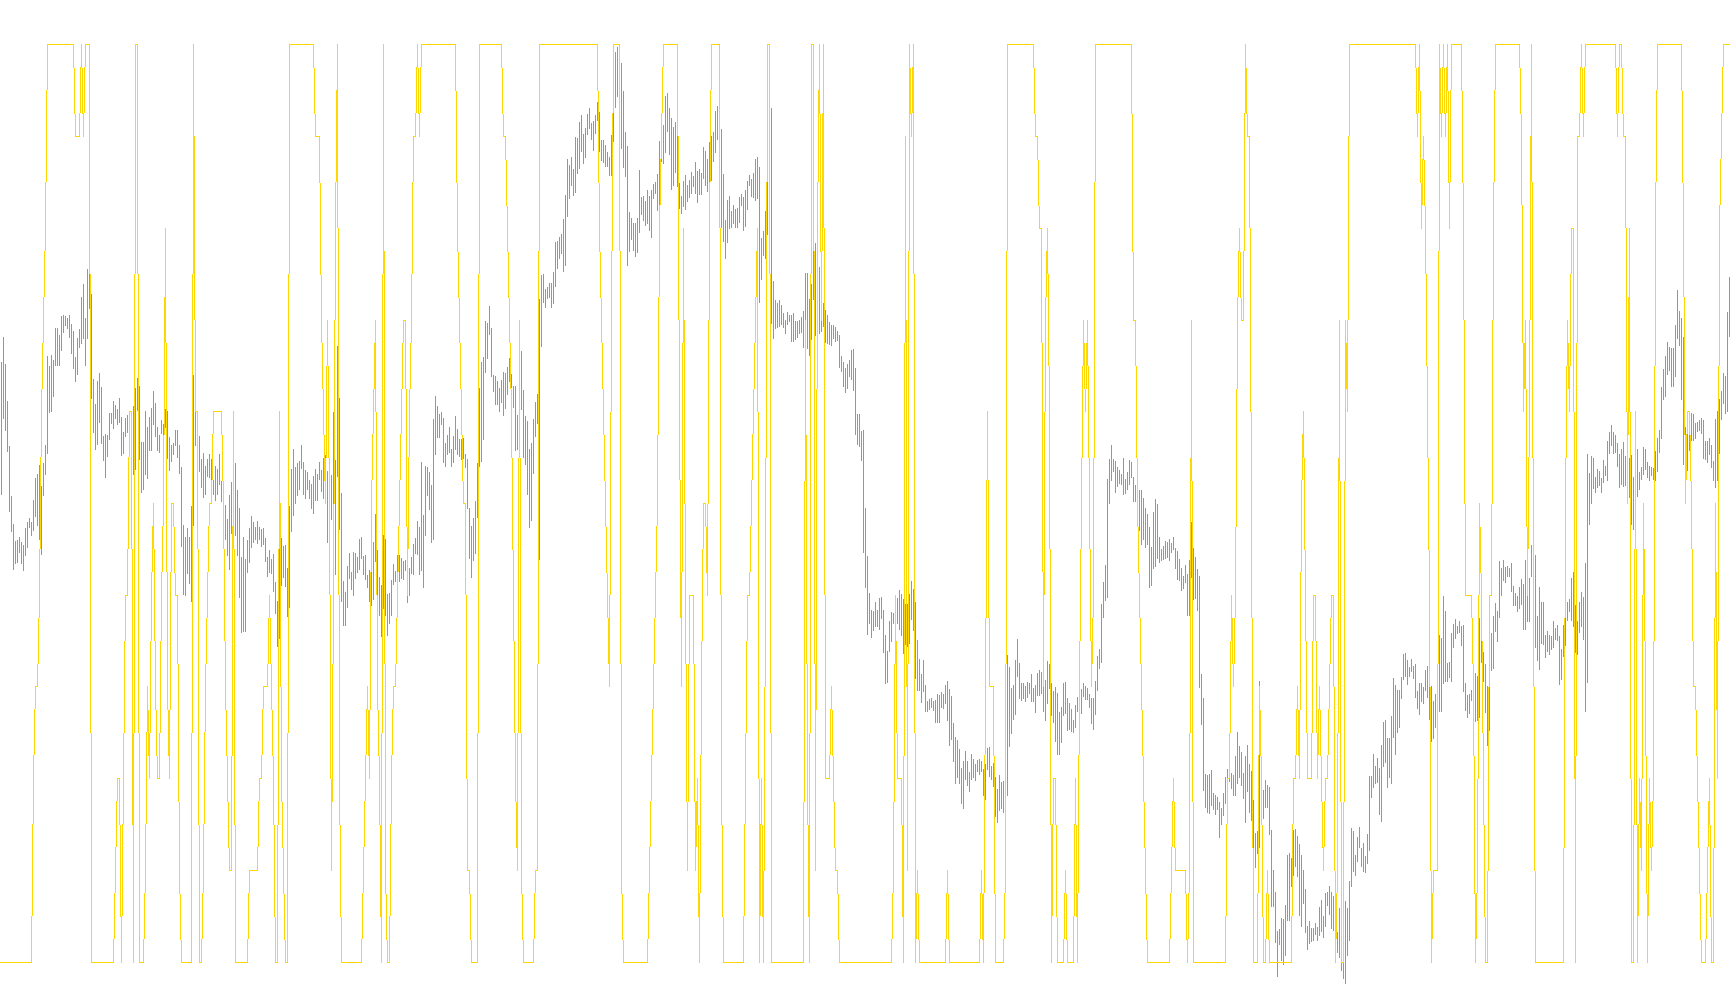
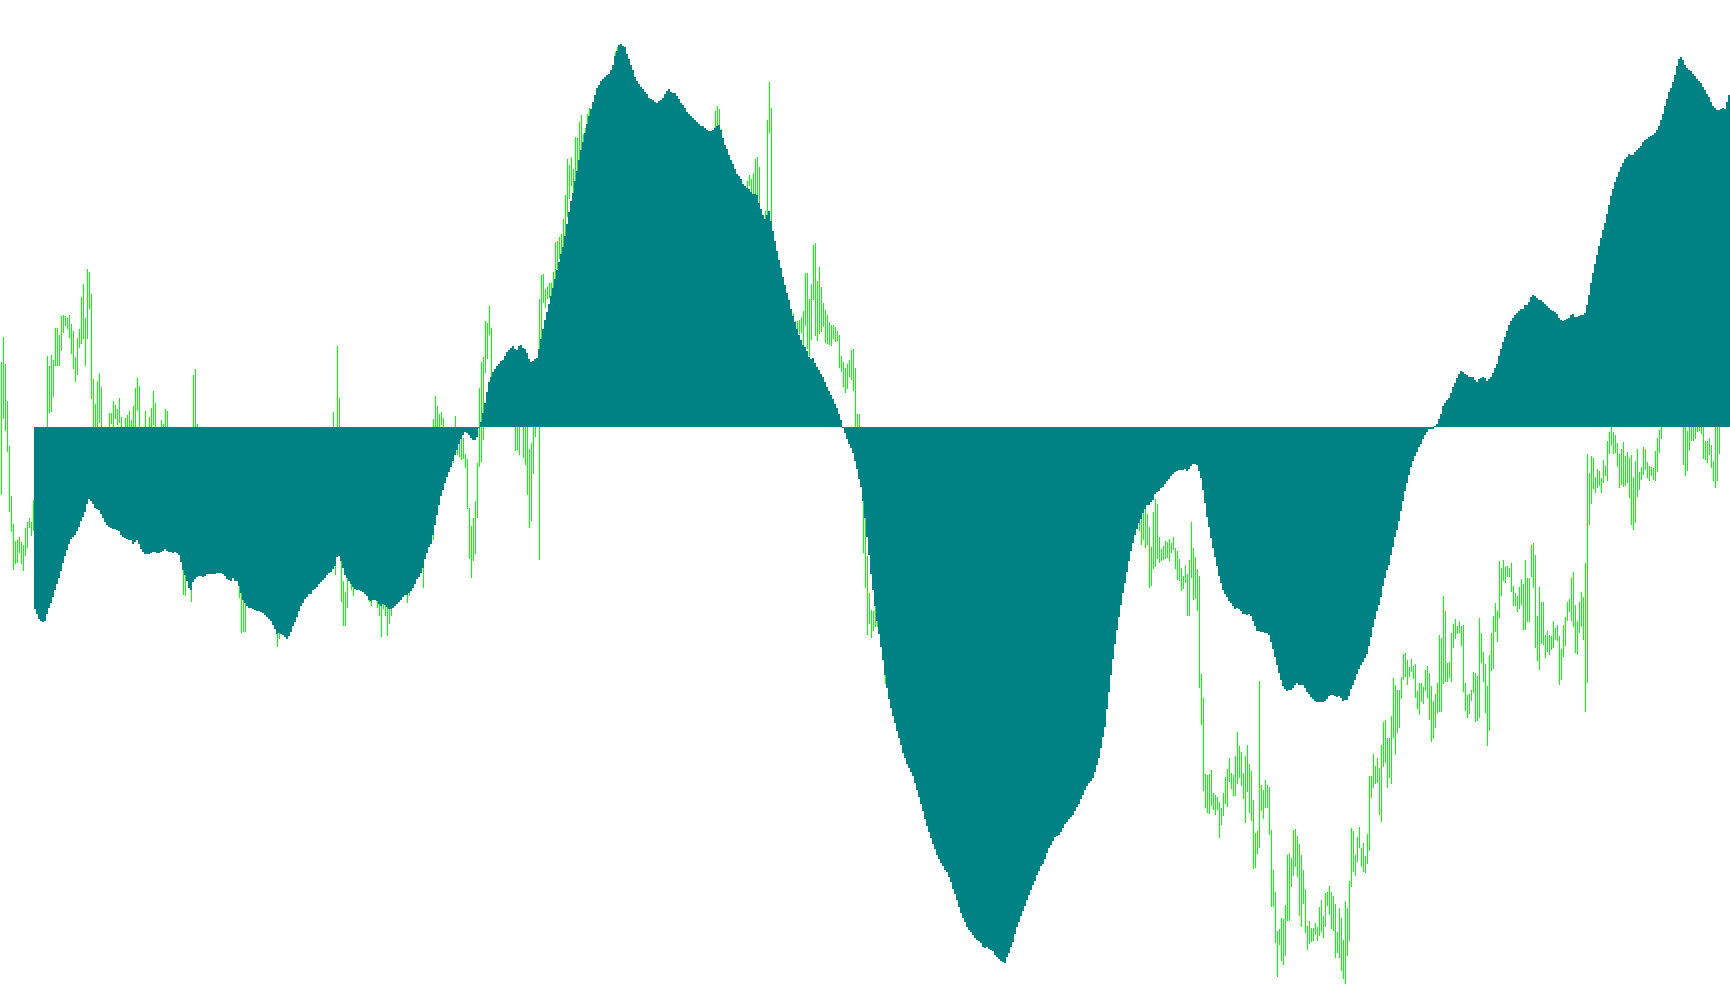
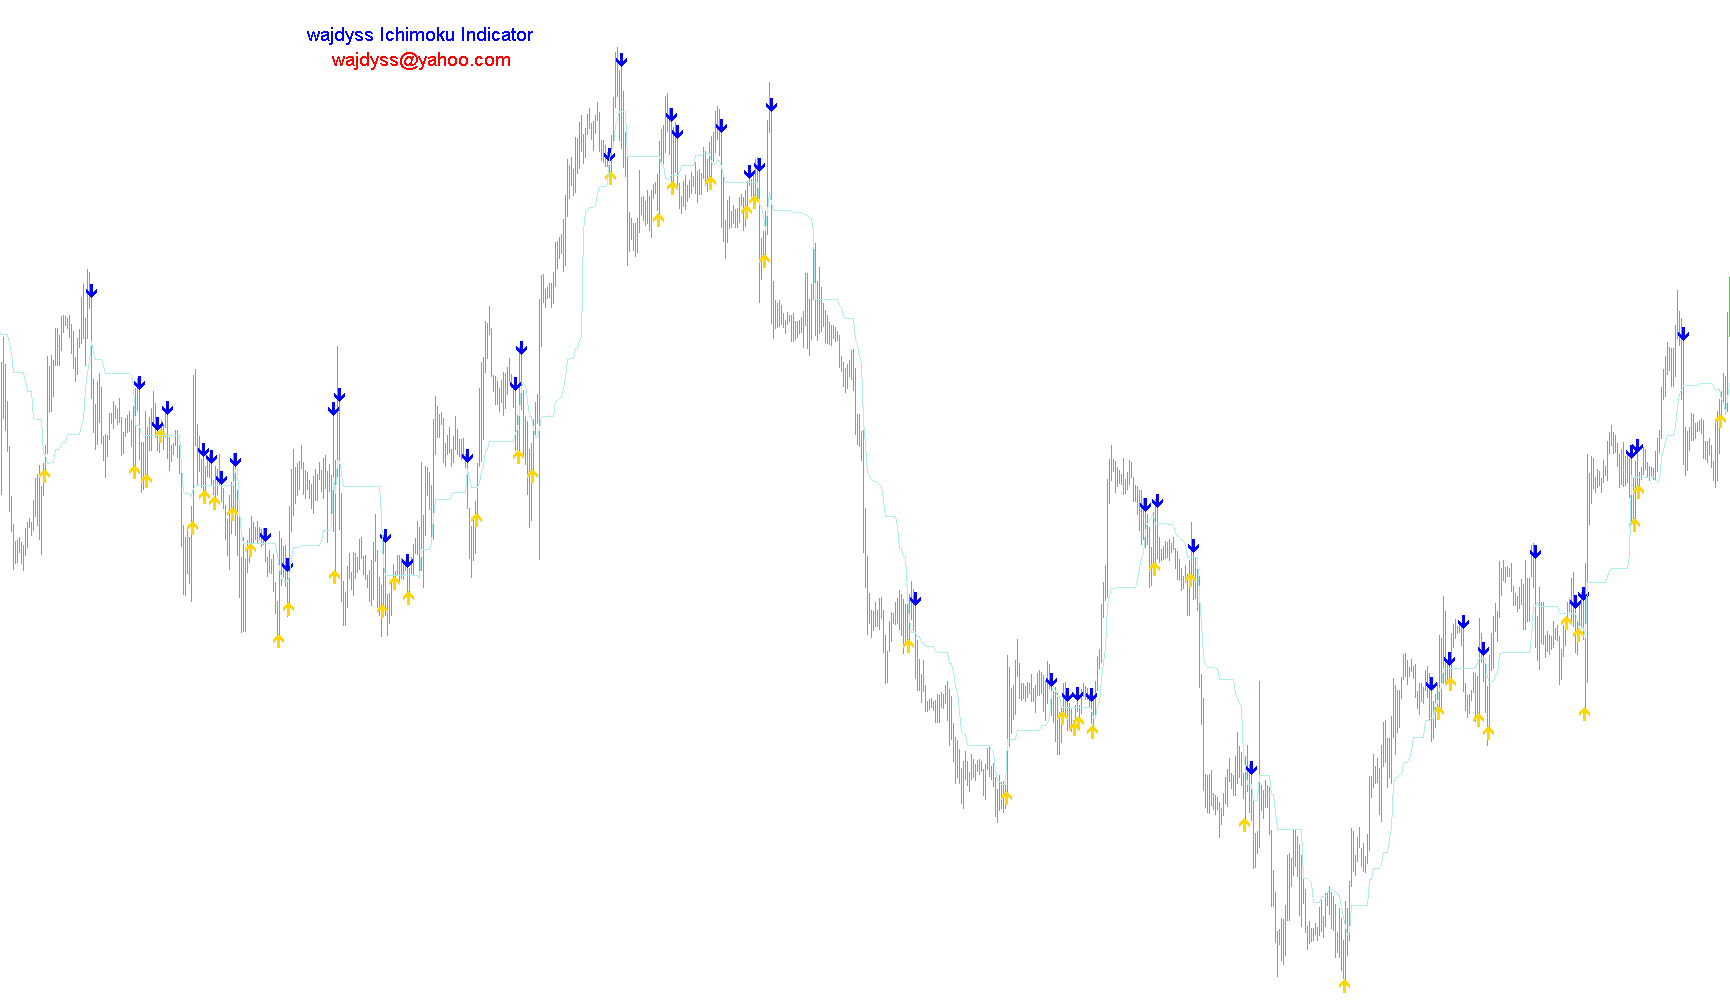
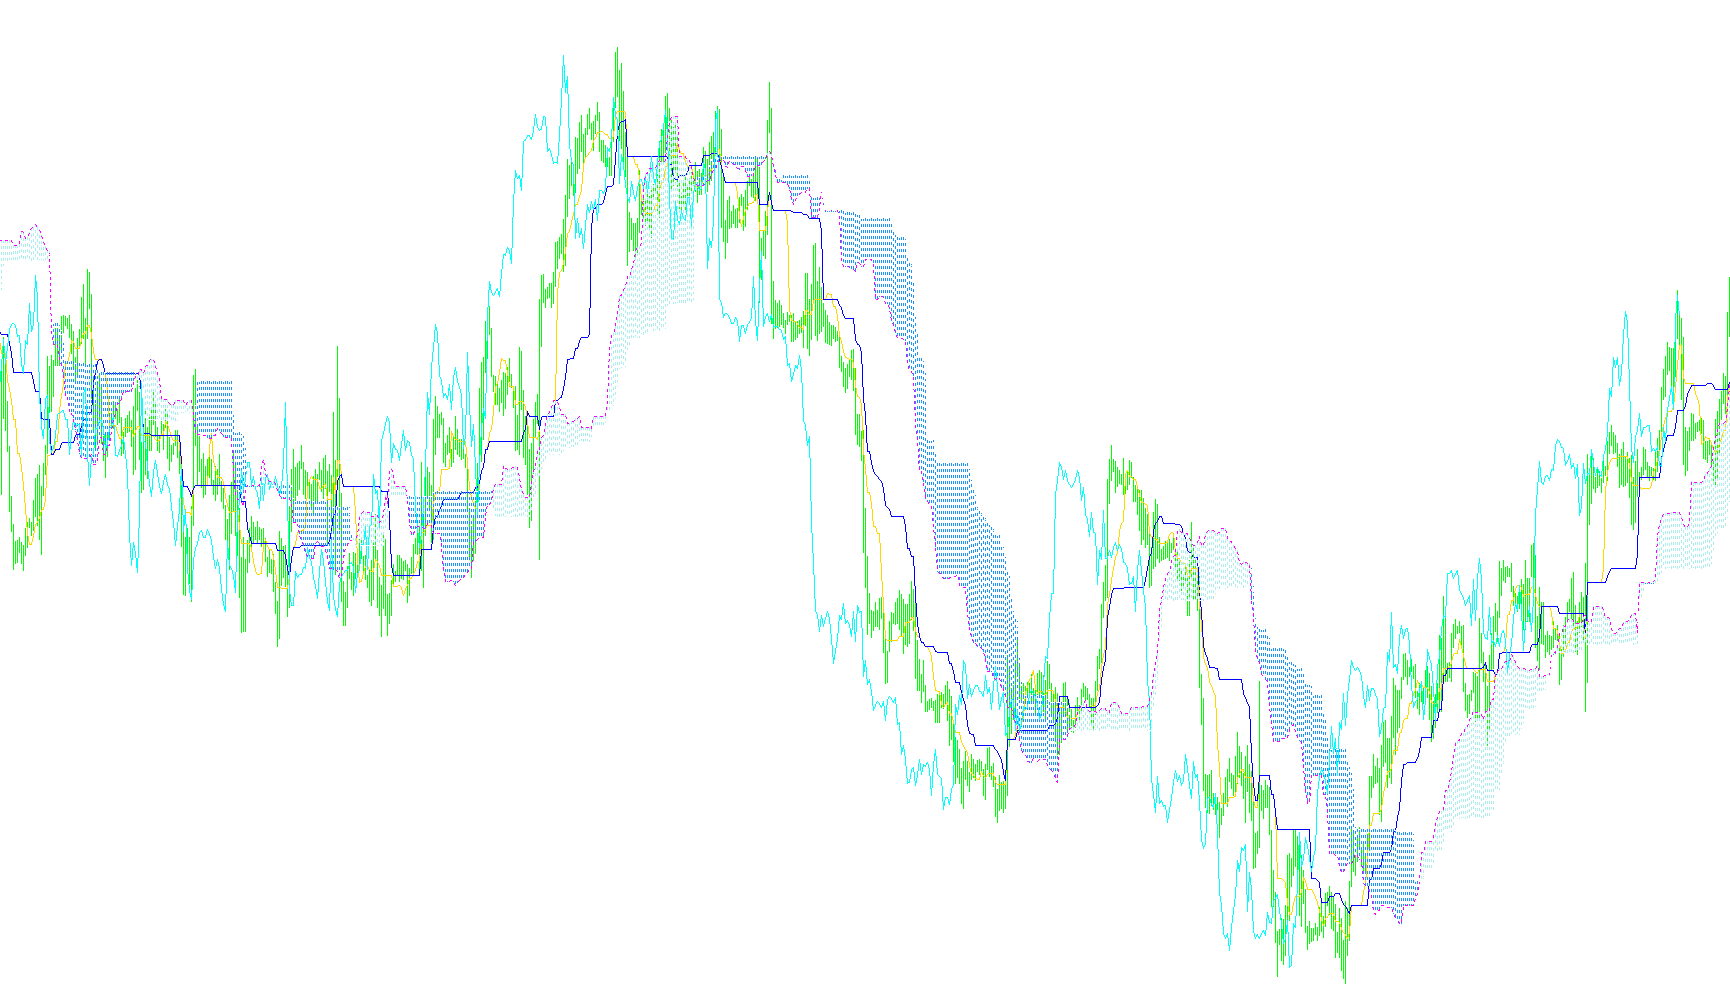
This indicator employs Gaussian elimination to solve a system of linear equations for polynomial regression, generating a dynamic price channel bounded by standard deviation offsets.

i-Regr_tracemode
Indicator

i-Regr_tracemode

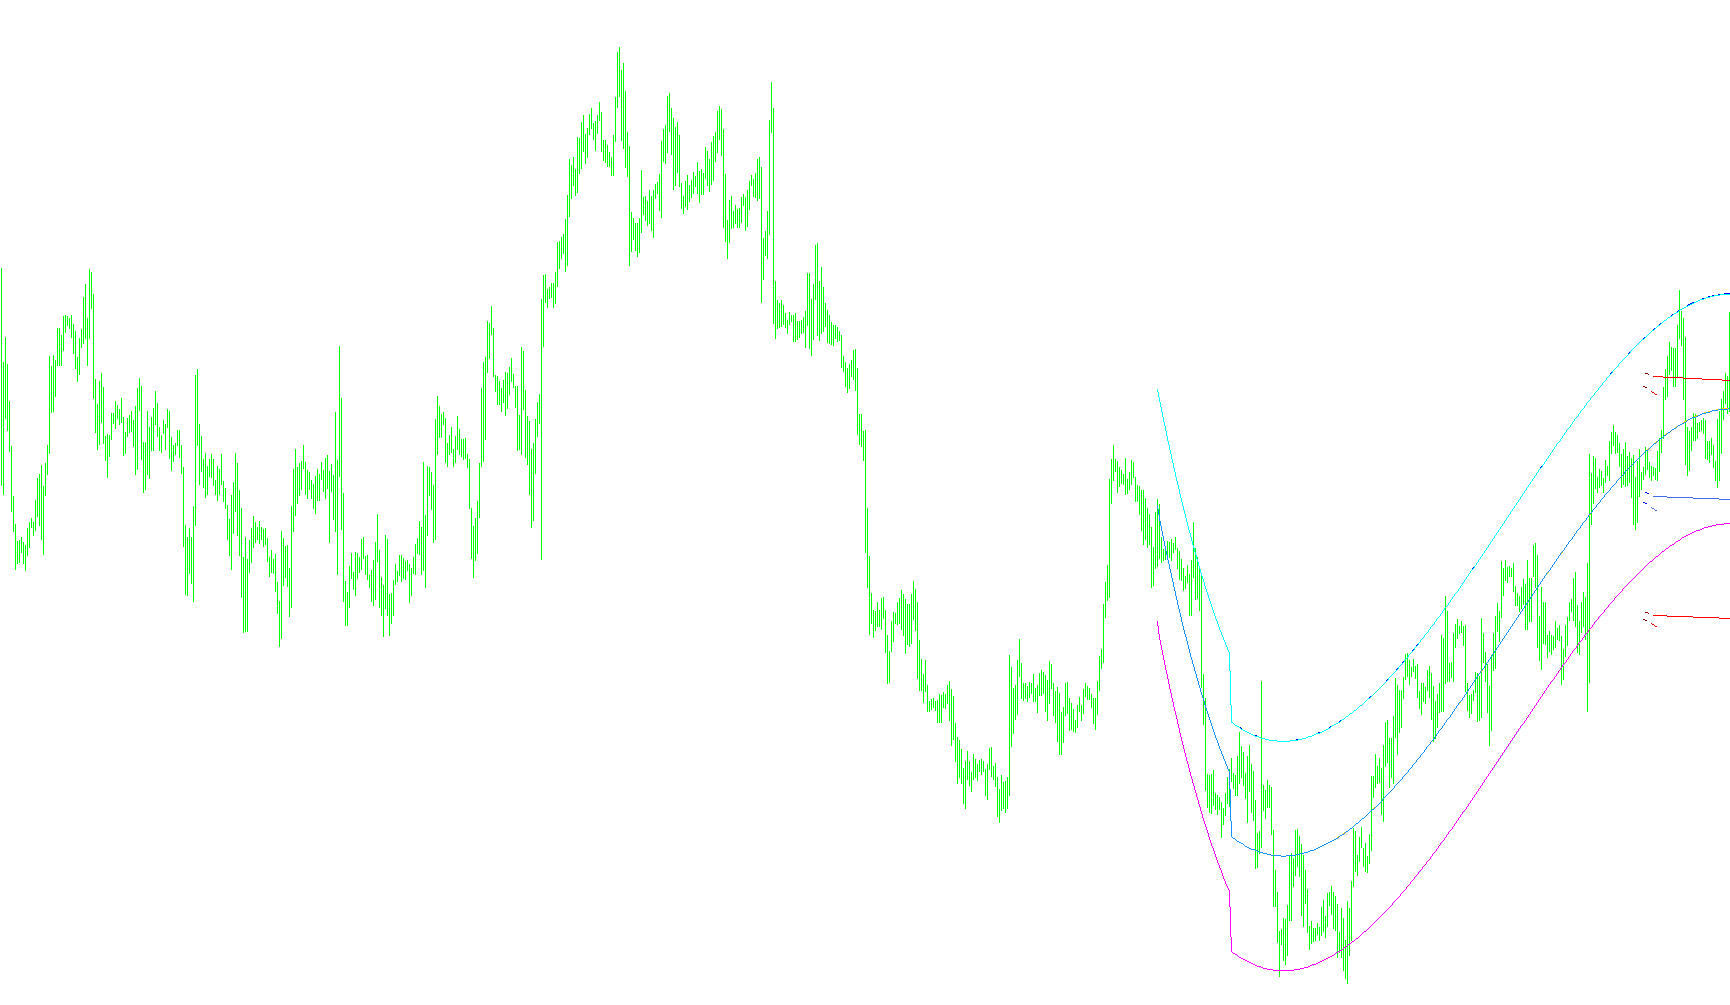
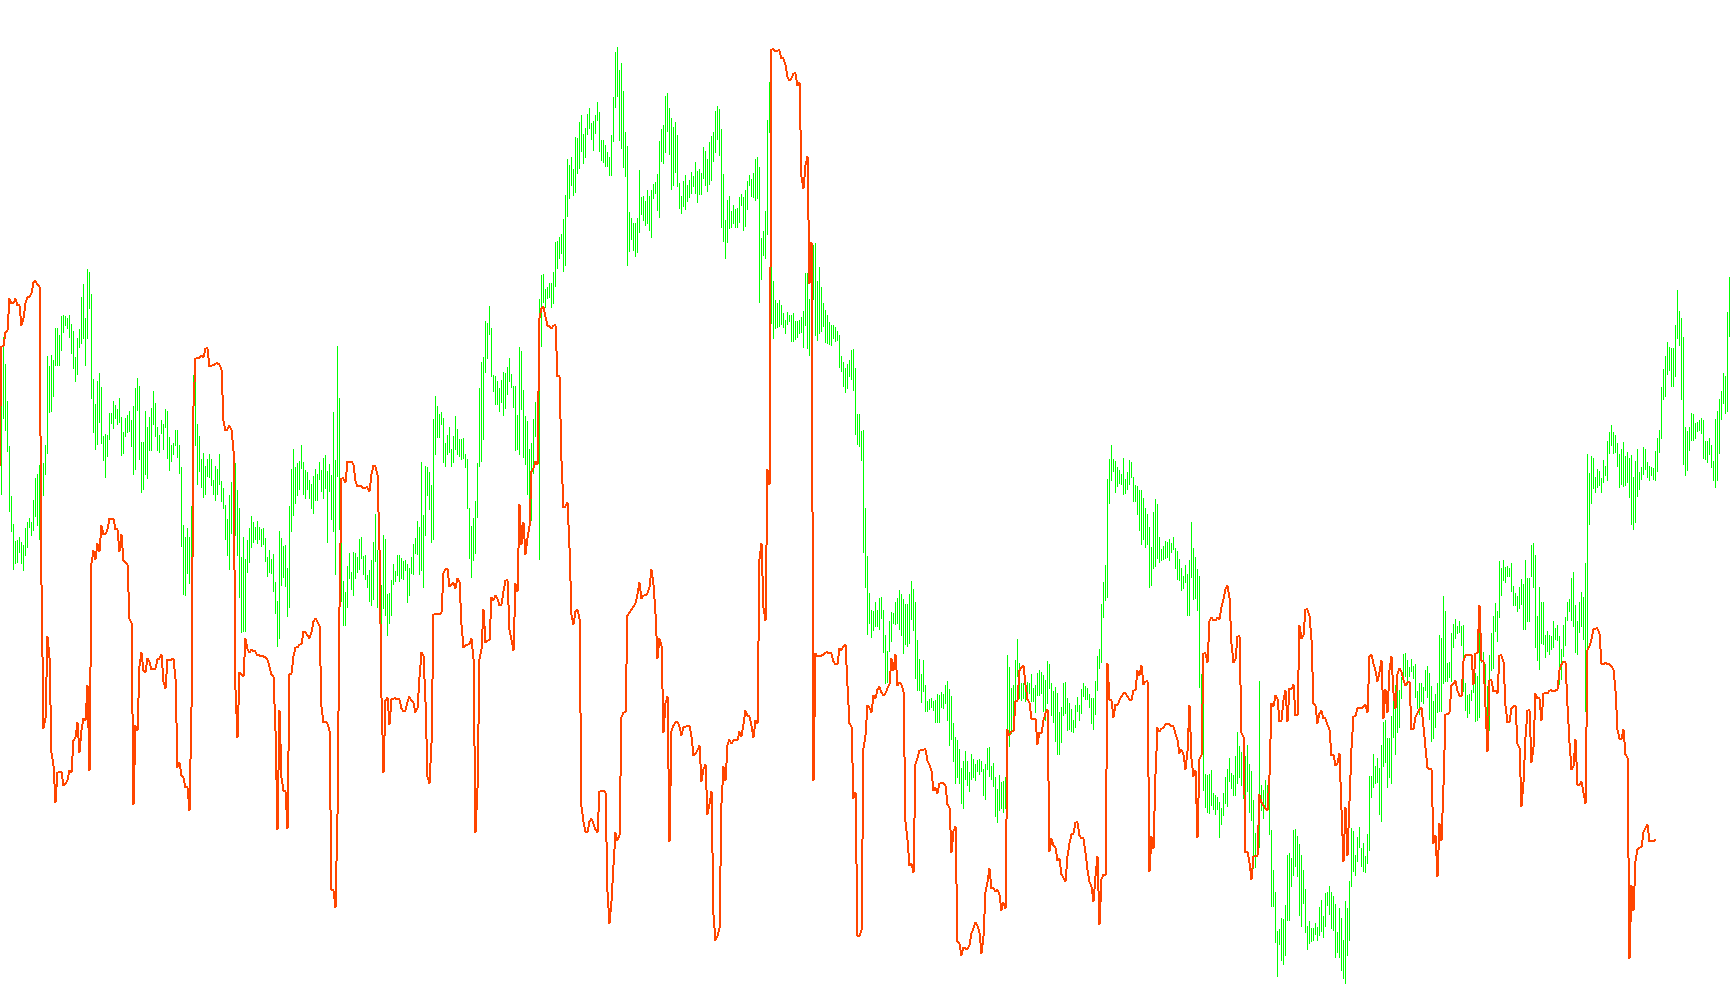
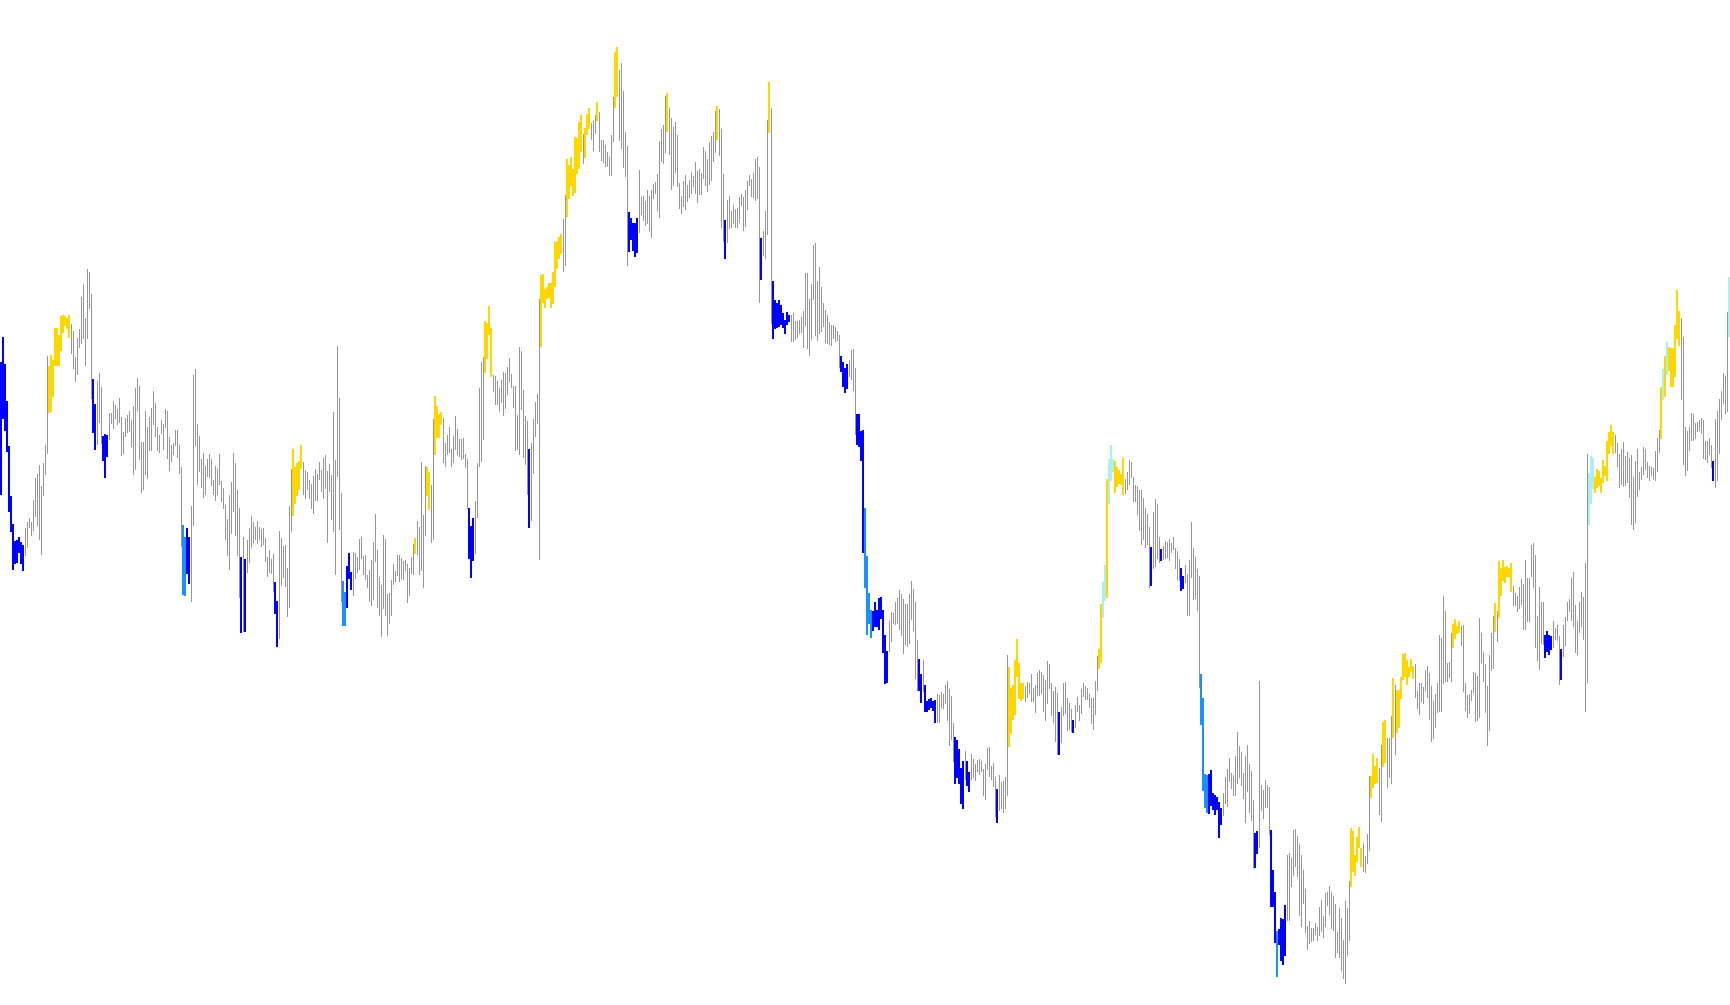
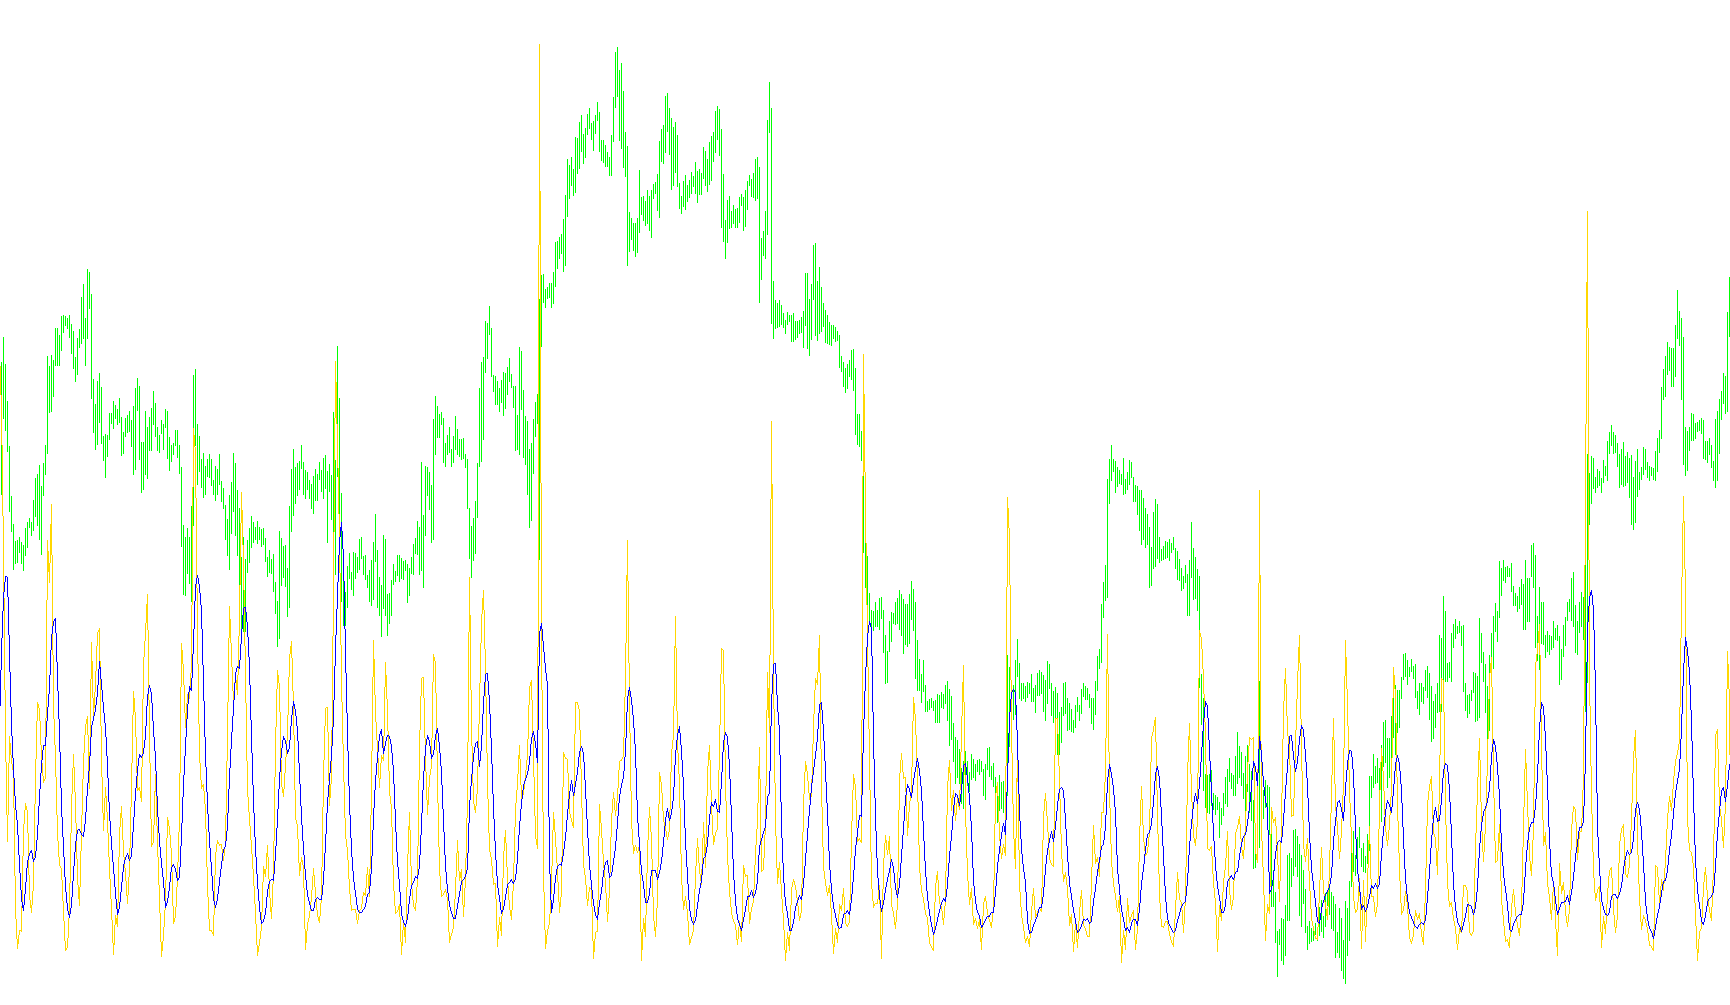
This indicator utilizes Gaussian elimination to solve a matrix of least squares for high-degree polynomial regression, generating dynamic upper and lower standard deviation bands.

i-Regr_trace_tail
Indicator

i-Regr_trace_tail

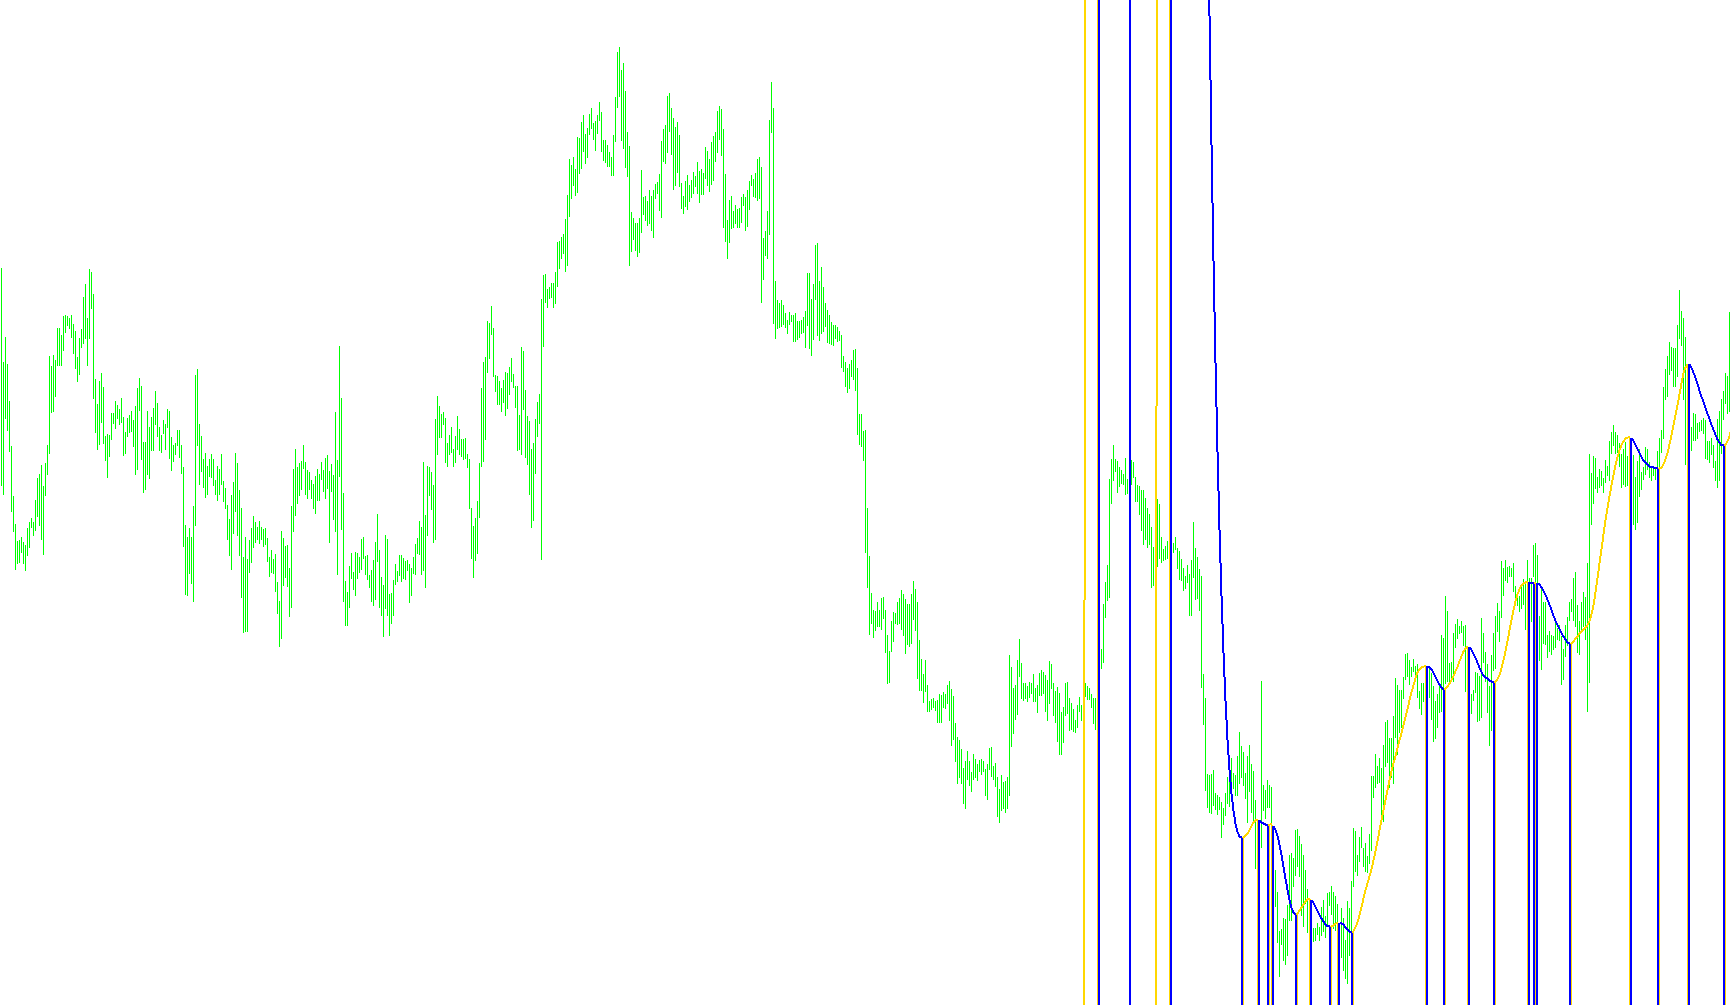
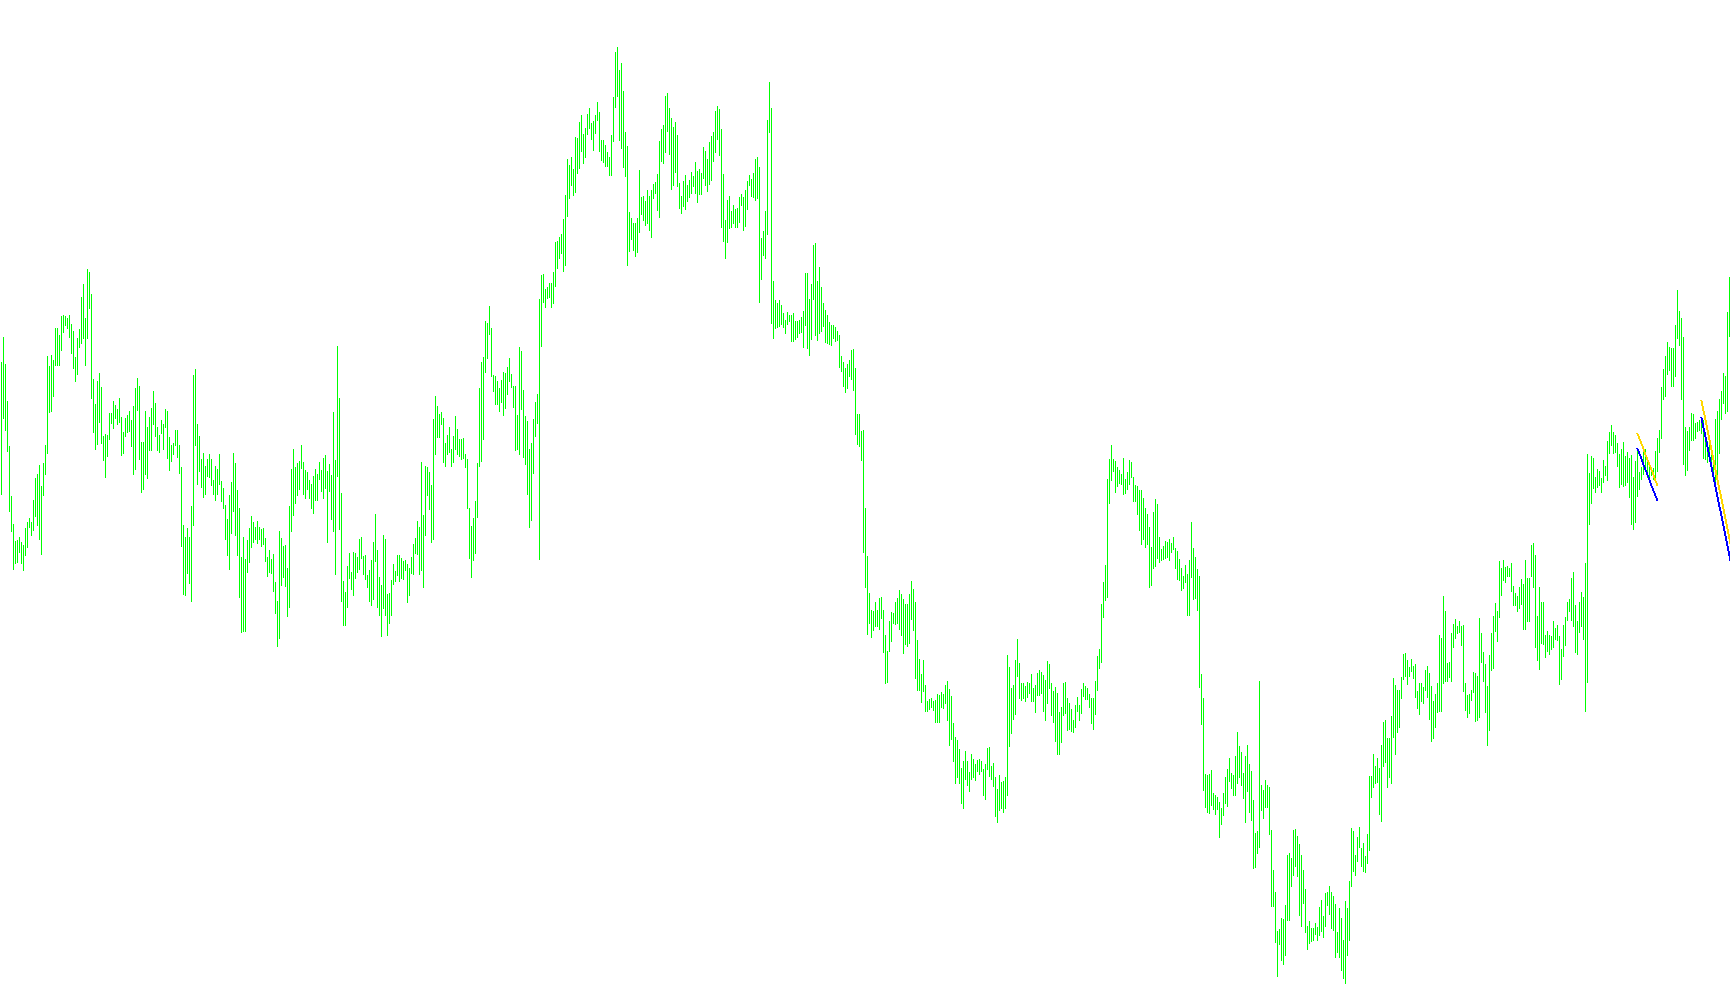
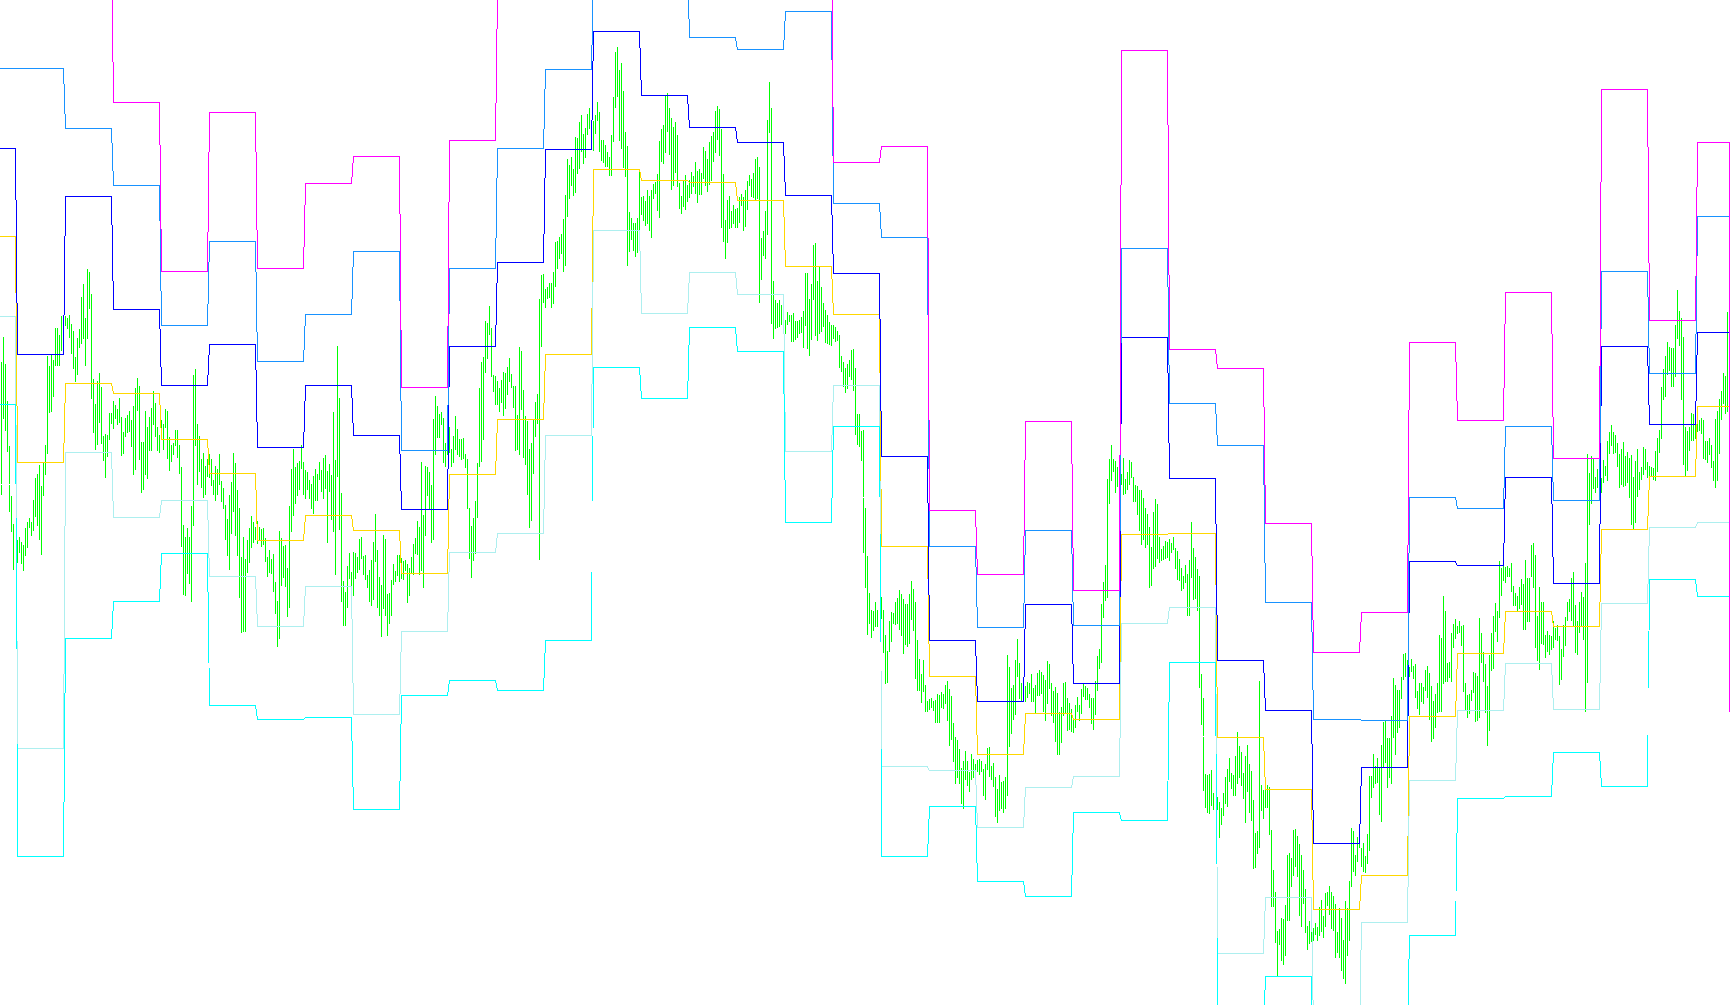
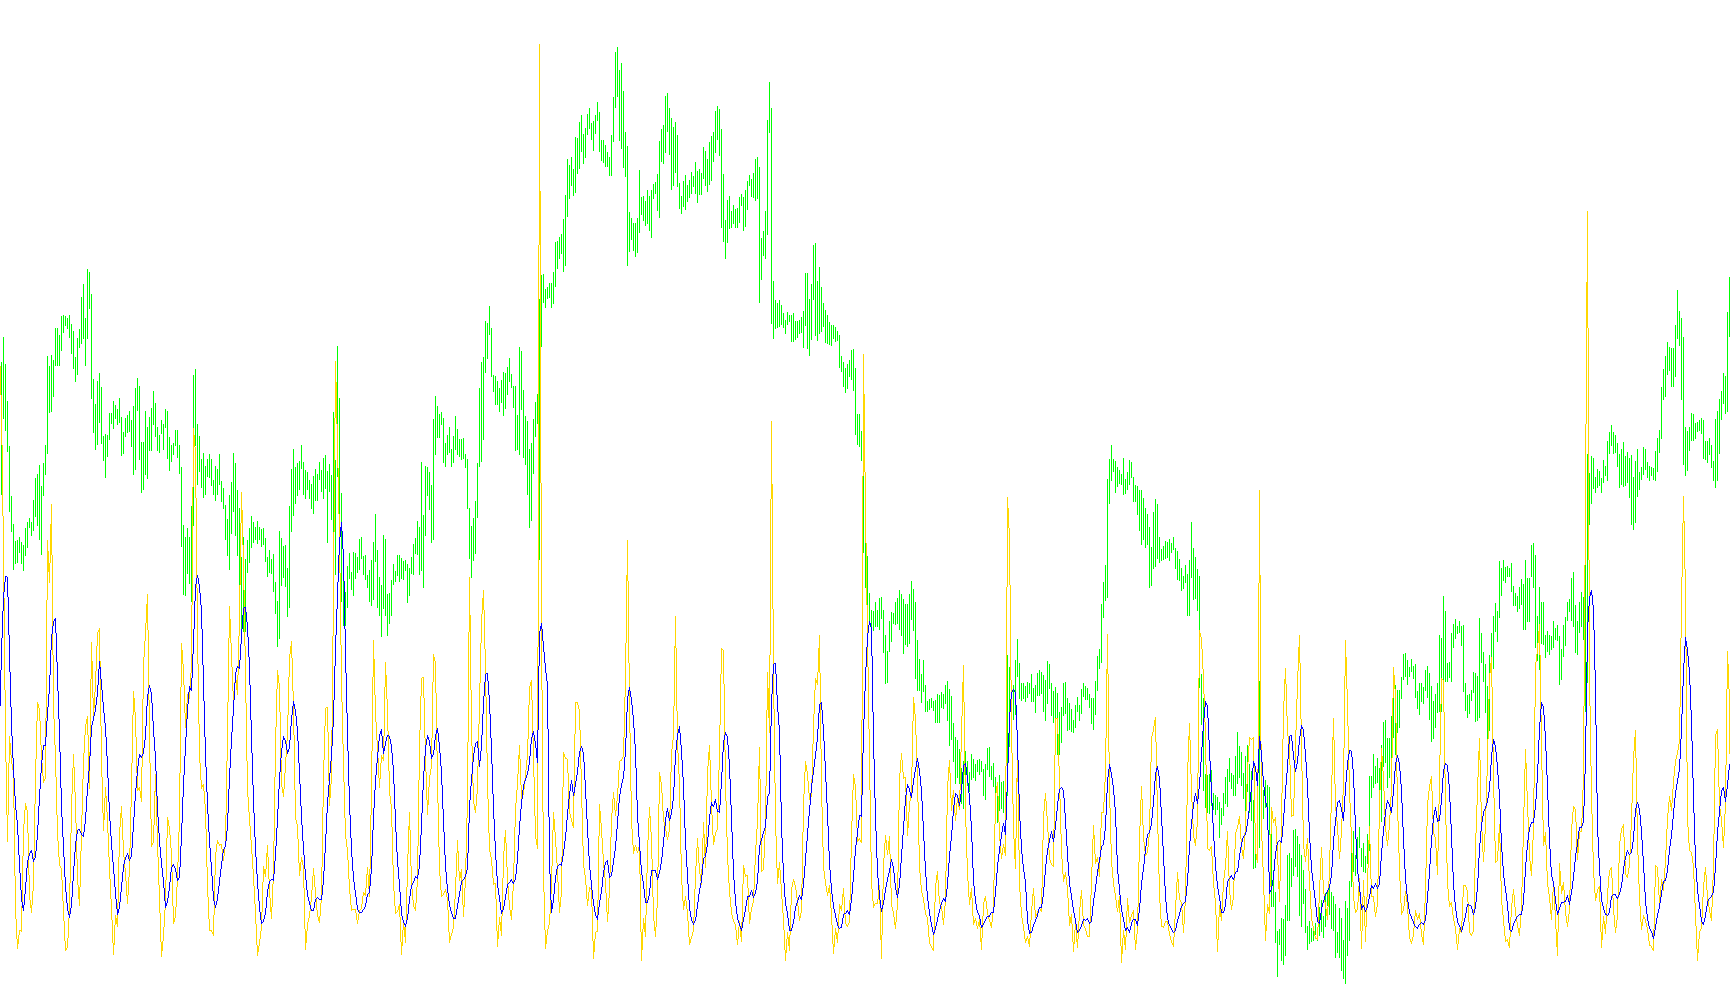
This indicator utilizes a Gaussian elimination matrix algorithm to calculate polynomial regression curves and associated standard deviation envelopes for trend forecasting.

i-RoundPrice-T01m-mod
Indicator

i-RoundPrice-T01m-mod

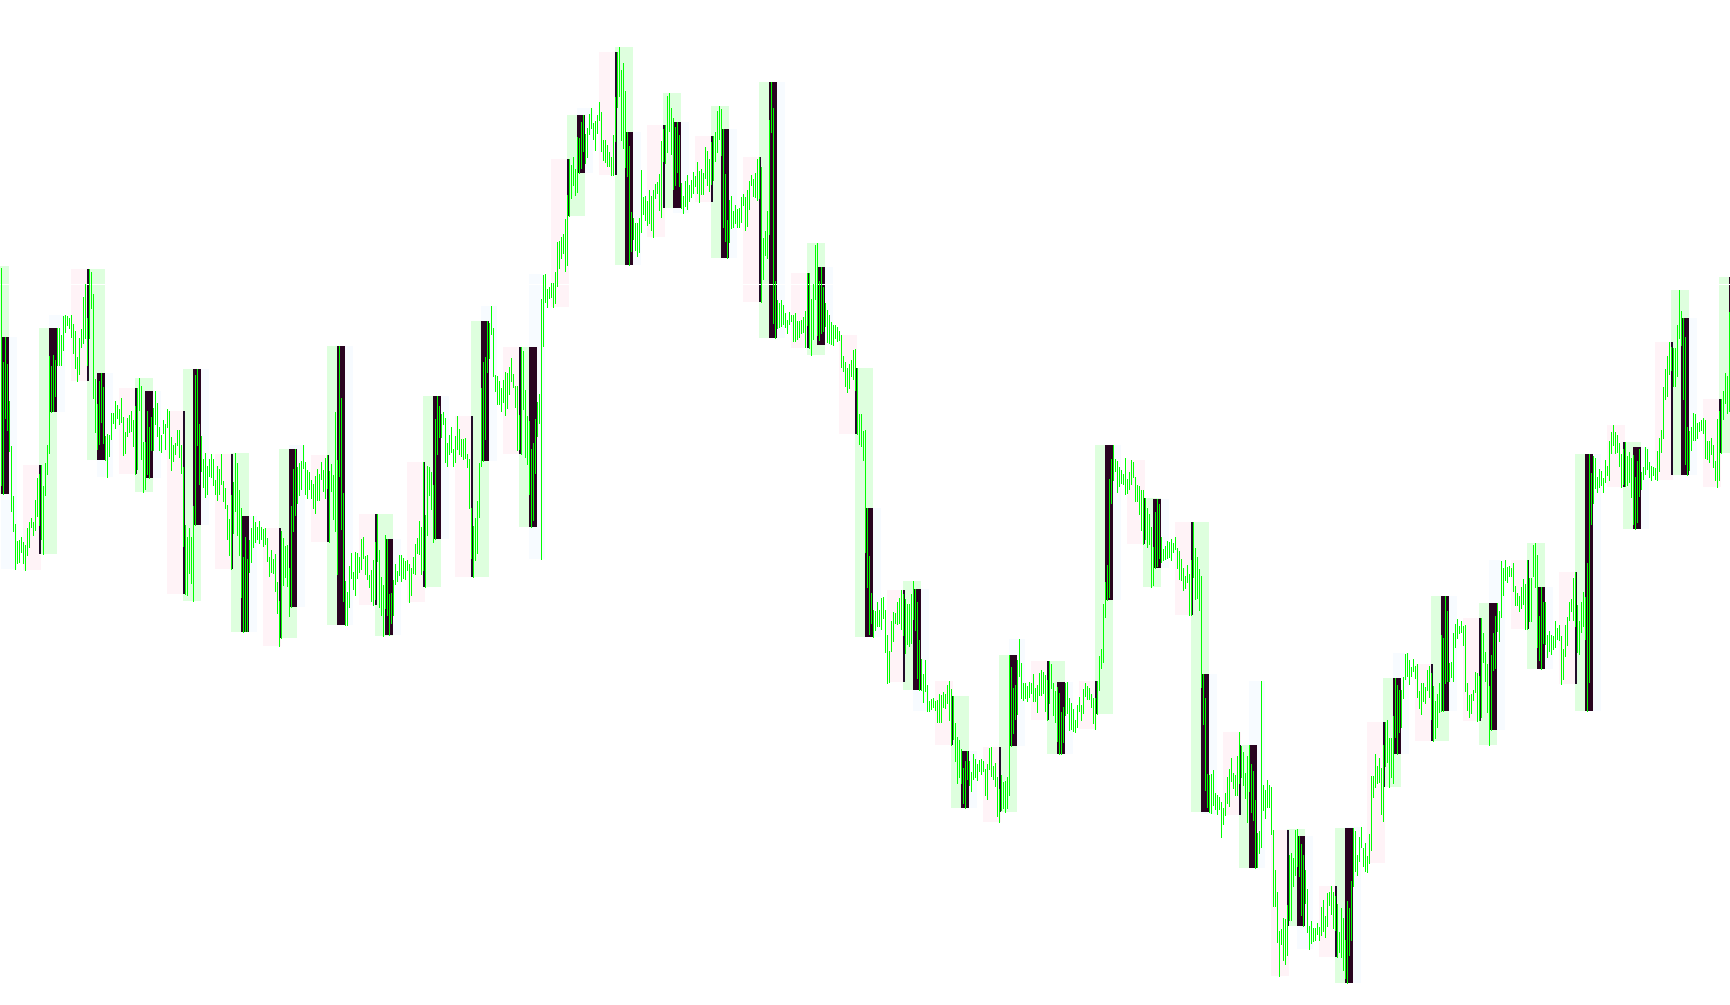
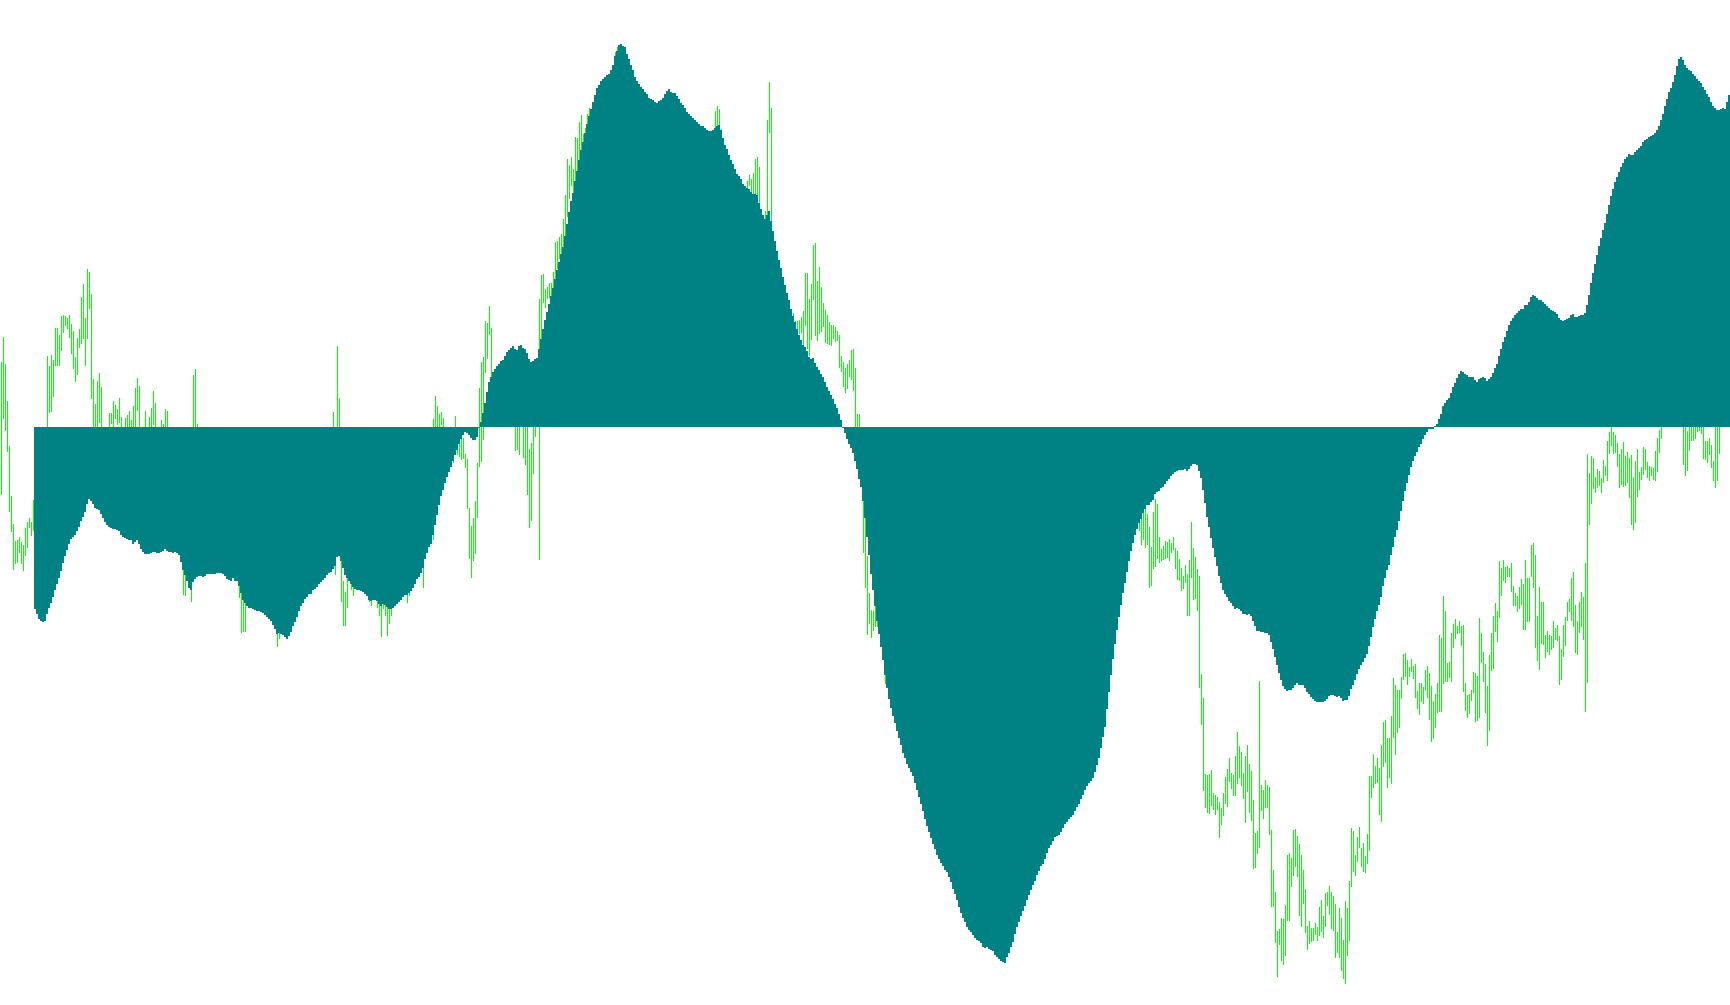
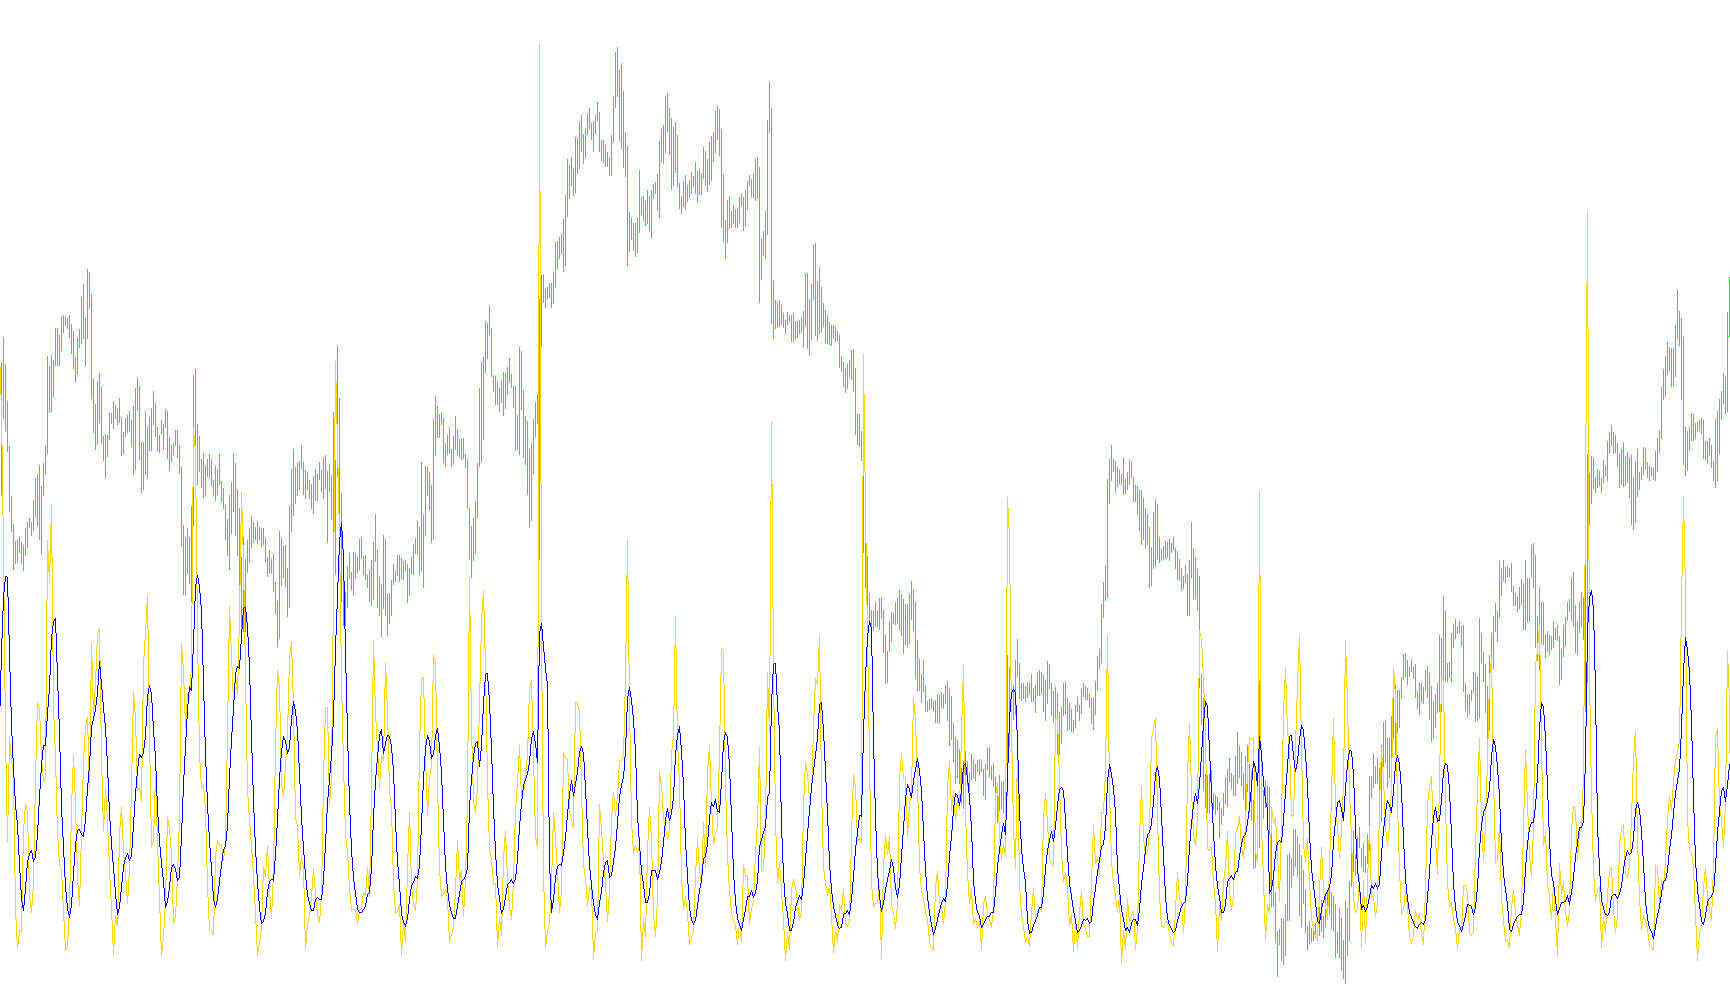
This indicator utilizes a multi-stage weighted moving average to calculate a cubic polynomial derivation that identifies directional momentum shifts and price trend acceleration.

i-RoundPrice-T01m-mod_NonLagMA_2
Indicator

i-RoundPrice-T01m-mod_NonLagMA_2

iMA

This indicator employs a weighted moving average filtered through Gaussian coefficients and trigonometric phase shifts to isolate specific price velocity trends.

i-RoundPrice-T01m
Indicator

i-RoundPrice-T01m

The indicator calculates a high-order polynomial smoothing of price action to identify directional momentum shifts through recursive weighted averages.

i-RP-T01m-mod-4
Indicator

i-RP-T01m-mod-4

The indicator calculates a fourth-order polynomial regression based on weighted closing prices to identify directional shifts in price momentum.

i-Sessions pst
Indicator

i-Sessions pst

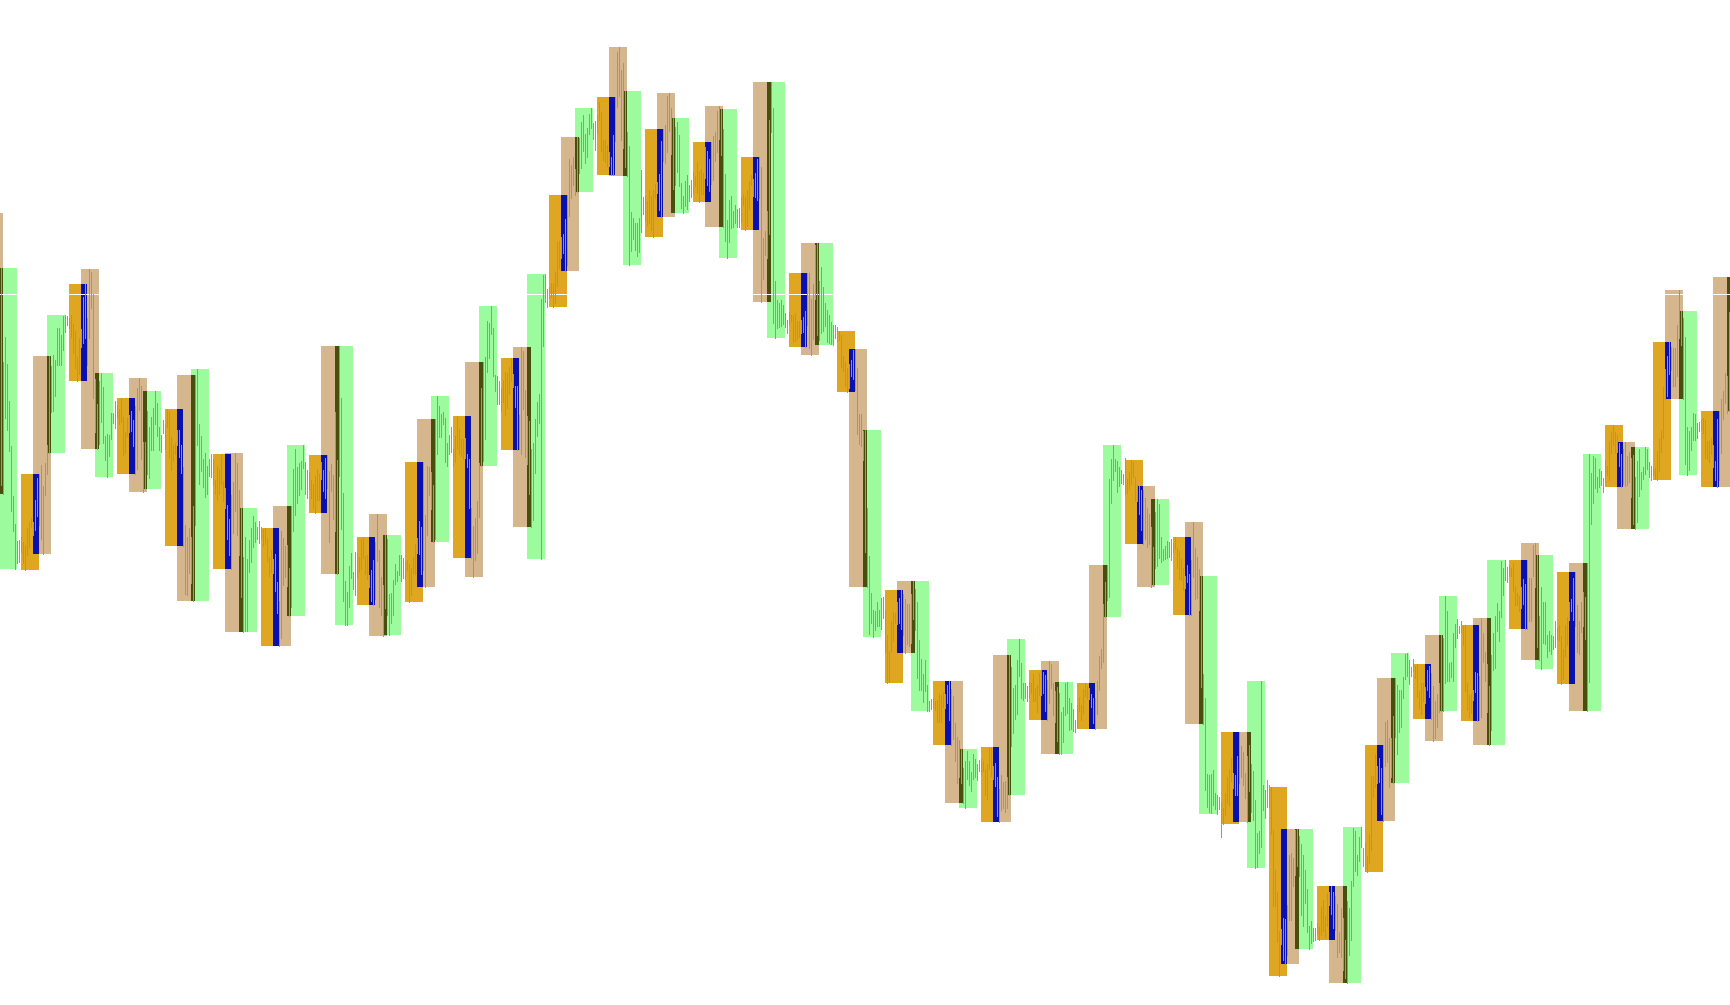
This indicator dynamically renders visual zones on the chart to demarcate specific Asian, European, and American trading periods based on user-defined temporal boundaries.

i-Sessions-02
Indicator

i-Sessions-02

This indicator dynamically plots distinct visual zones on the chart to demarcate specific temporal trading windows and their corresponding price extremes.

i-Sessions-02_v1
Indicator

i-Sessions-02_v1

This indicator visually segments the trading chart into eight distinct chronological windows by plotting high and low price boundaries for predefined time intervals.

i-Sessions-02_v2
Indicator

i-Sessions-02_v2

This indicator maps specific trading timeframes onto the chart by dynamically rendering shaded rectangles based on defined start and end periods over a multi-day historical range.

i-Sessions
Indicator

i-Sessions

This indicator dynamically visualizes distinct geographic trading windows by projecting high-low price boundaries onto the chart based on user-defined time intervals.

i-Sessions1
Indicator

i-Sessions1

This indicator dynamically maps and highlights high/low price boundaries for Asia, Europe, and US trading sessions on the chart.

i-Sessions1_v1
Indicator

i-Sessions1_v1

This indicator visually delineates specific trading sessions by projecting high and low price boundaries as rectangular zones across a multi-day historical timeframe.

i-Sessions_v1
Indicator

i-Sessions_v1

This indicator renders distinct shaded zones on the chart to delineate the specific operating hours of Asian, European, and American markets over a multi-day historical period.

i-Sessions_v2
Indicator

i-Sessions_v2

This indicator visualizes predefined temporal trading windows by overlaying distinct color-coded rectangular zones on the chart to represent Asian, European, and American market sessions.

i-Sessions_v3
Indicator

i-Sessions_v3

This indicator visualizes specific global trading sessions by drawing shaded rectangles over historical price action and identifying high/low extremes for each period.

i-SignalOfTrade
Indicator

i-SignalOfTrade

This indicator tracks real-time execution events by notifying the user of new order placements, pending request activations, position modifications, and final closures with detailed account metrics.

i-SKB-F
Indicator

i-SKB-F

iFractals
Indicator

i-UrovenZero-v.2.2.7

i-VaR95
Indicator

i-VaR95

This indicator calculates historical volatility using Simple, Exponential, and High-Low methods, while providing a 95% Value at Risk (VaR) projection based on specific investment horizons.

Indicator

i1AMA

iMA
i4_DRF_v2
Indicator

i4_DRF_v2

The algorithm quantifies short-term price trajectory by calculating the cumulative net sum of relative close price comparisons over a rolling ten-bar window.

i4_DRF_v2_v1
Indicator

i4_DRF_v2_v1

This indicator quantifies price velocity by calculating a running tally of closing price relative positions over a rolling ten-bar window to detect structural shifts.

i4_DRF_v2_v2
Indicator

i4_DRF_v2_v2

This indicator quantifies short-term momentum by calculating the cumulative sum of price comparisons over a fixed lookback window to visualize directional bias.

i4_GoldenLionTrend_v3
Indicator

i4_GoldenLionTrend_v3

iBands

The indicator identifies price excursions beyond multiple standard deviation bands to pinpoint extreme volatility zones and potential mean reversion points.

i4_pivot_v1
Indicator

i4_pivot_v1

This indicator calculates daily equilibrium points and multi-level support/resistance zones by aggregating previous day's price extremes and closing data.

iAnchMom
Indicator

iAnchMom

iMA

Quantifies the percentage divergence between a short-term Exponential Moving Average and a long-term Simple Moving Average to identify trend velocity.

iAnchMom_v1
Indicator

iAnchMom_v1

iMA

Calculates the percentage variance between a fast Exponential Moving Average and a slower Simple Moving Average to quantify relative price velocity.

iAnchMom_v2
Indicator

iAnchMom_v2

iMA

This indicator calculates the percentage variance between a fast Exponential Moving Average and a long-term Simple Moving Average to identify momentum shifts.

iAnchMom_v3
Indicator

iAnchMom_v3

iMA

Calculates the percentage deviation of a fast Exponential Moving Average against a long-period Simple Moving Average to identify structural trend strength.

iAvgVol
Indicator

iAvgVol

This indicator plots concurrent real-time volume metrics against a rolling arithmetic mean to identify liquidity surges and anomalous trading activity.

iAvgVol_v1
Indicator

iAvgVol_v1

This indicator visualizes real-time transaction intensity against a rolling arithmetic mean to identify periods of abnormal market participation.

iAvgVol_v2
Indicator

iAvgVol_v2

The indicator calculates a rolling arithmetic mean of historical trading volume to identify periods of anomalous liquidity relative to the established average.

iBalance
Indicator

iBalance

Visualizes a consistent baseline level across the subwindow to serve as a fixed reference point for account monitoring.

iBalans
Indicator

iBalans

This indicator reconstructs historical balance progression by reverse-calculating closed trade profits and commissions to visualize capital fluctuations and peak drawdown levels.

iBalans_v2
Indicator

iBalans_v2

This indicator tracks cumulative account balance fluctuations and historical trade outcomes by mapping chronological profit/loss data onto a visual growth curve.

IBFXDailyPivots
Indicator

IBFXDailyPivots

This indicator projects floor pivots and multi-level support/resistance zones by calculating the arithmetic mean of previous daily highs, lows, and closing prices.

IBS
Indicator

IBS

iMAOnArray

This indicator calculates the percentage position of the closing price relative to the high-low range and applies a simple moving average to smooth the resulting volatility profile.

IBS_v1
Indicator

IBS_v1

iMAOnArray

The indicator calculates a moving average of the normalized price position within each candle's high-low range to identify localized trend bias.

iCCI_M1+H1+D1
Indicator

iCCI_M1+H1+D1

iCCI

This indicator synchronizes Commodity Channel Index values across M1, H1, and D1 timeframes onto a single visual plot to identify momentum alignment.
iCCI_Revercy v1.4
Indicator

iCCI_Revercy v1.4

iCCIiMA

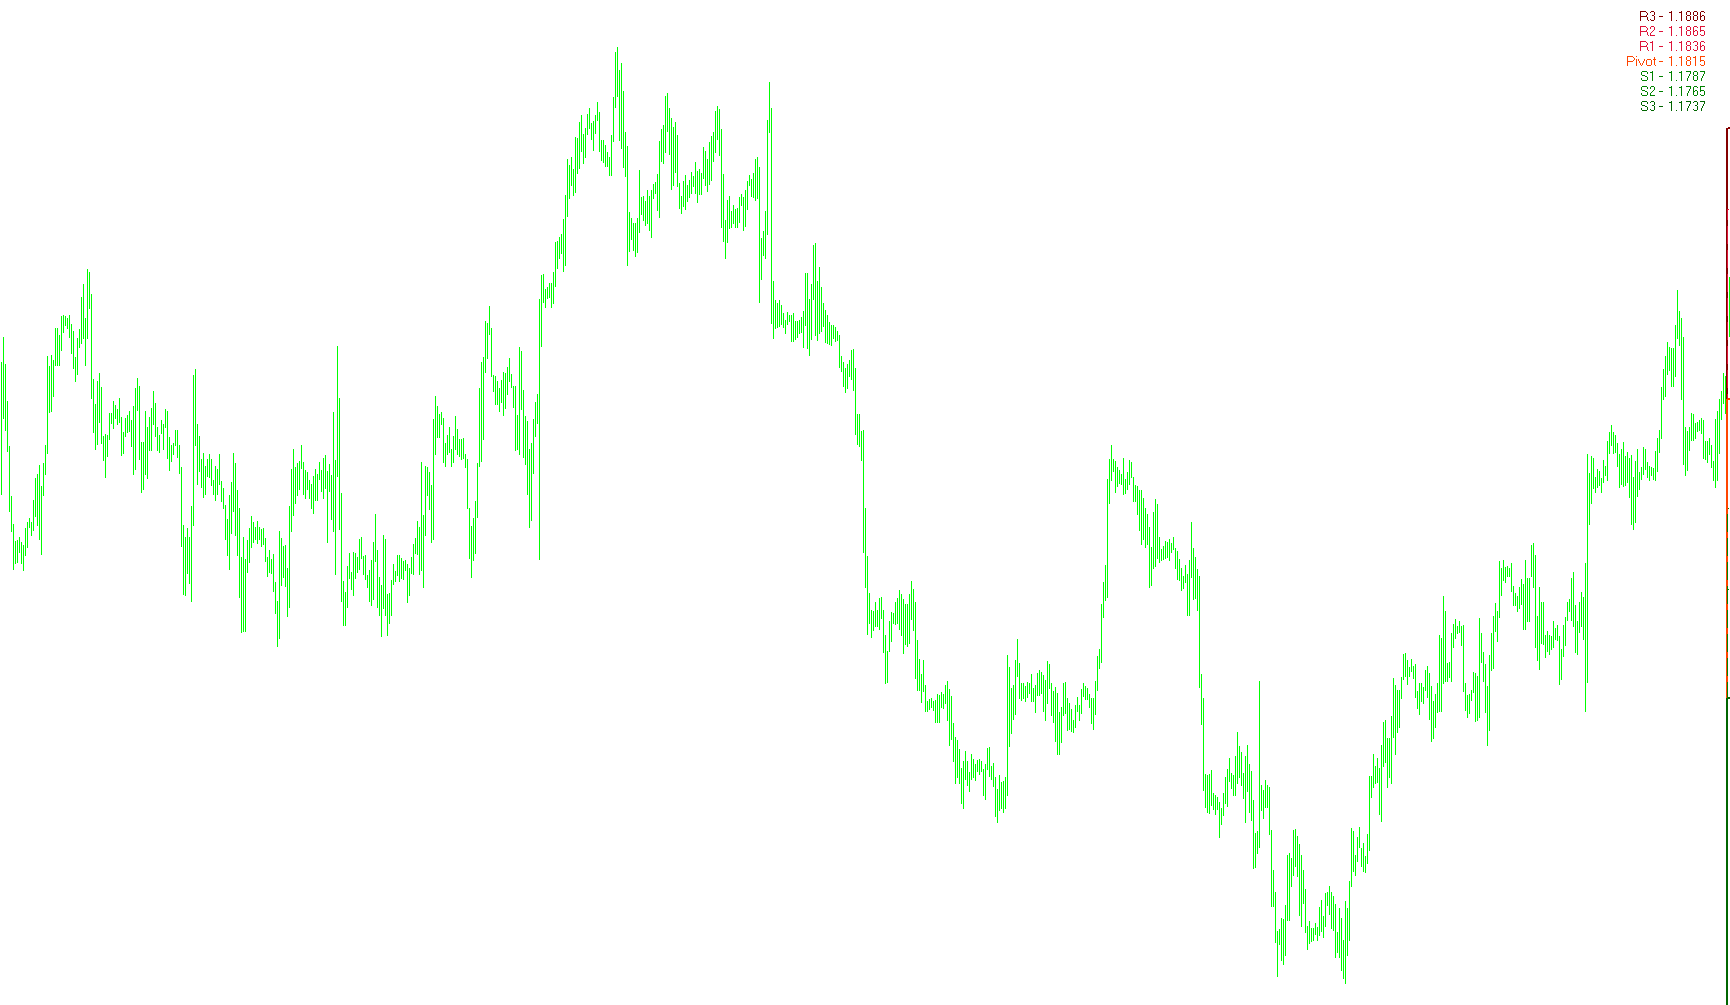
This indicator calculates projected price points by algebraically reversing the Commodity Channel Index formula to estimate potential reversal levels based on a defined CCI threshold.
ichi
Indicator

ichi

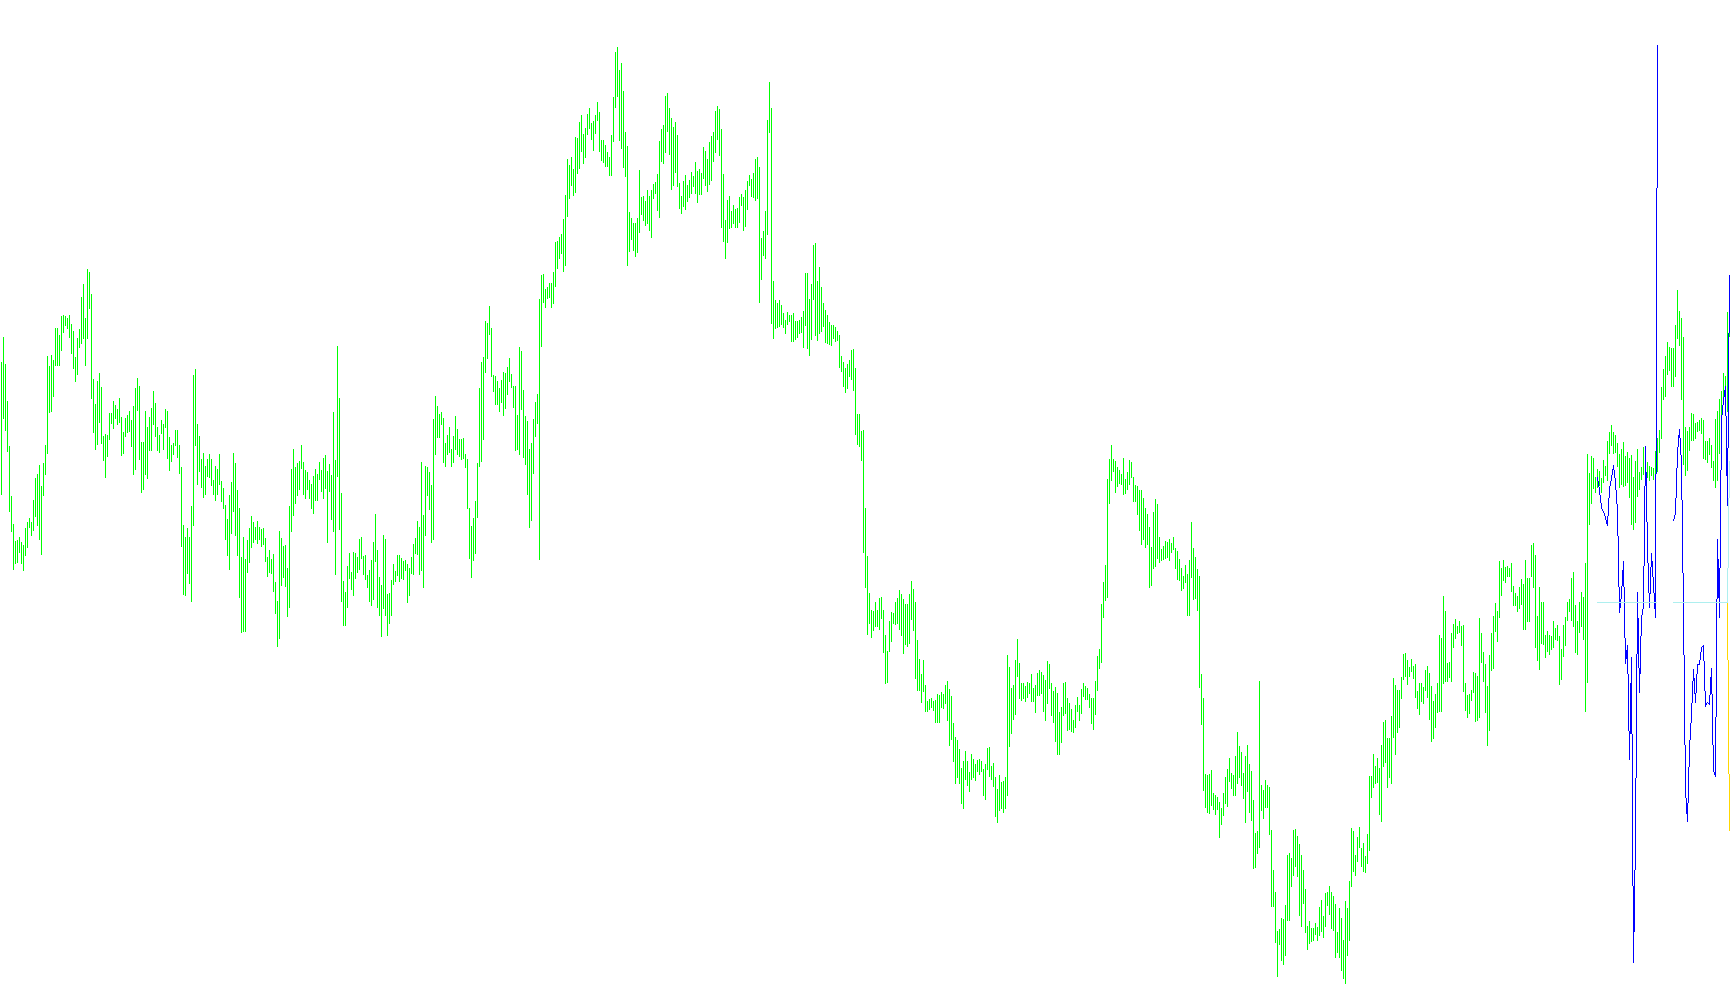
This indicator calculates the foundational components of the Ichimoku Cloud system, utilizing moving averages of highs and lows to determine trend direction, momentum shifts, and price equilibrium levels.

Ichimoku THV
Indicator

Ichimoku THV

This indicator calculates multi-layered equilibrium price points using midpoint averages of high and low price extremes to identify trend momentum and potential reversal zones.

Ichimoku+GuppyAlligator1
Indicator

Ichimoku+GuppyAlligator1

This indicator visualizes eight distinct dynamic equilibrium lines by calculating the midpoint of high and low price ranges across four variable temporal scales for both Tenkan and Kijun components.

Ichimoku+GuppyAlligator2
Indicator

Ichimoku+GuppyAlligator2

This indicator calculates eight distinct price equilibrium lines by computing the midpoints of high and low ranges over varying temporal windows to identify multi-layered trend momentum.

ichimoku-alert
Indicator

ichimoku-alert

This indicator identifies momentum shifts by detecting price crossovers of the Kijun-sen moving average and generates real-time alerts for trend reversals.

Ichimoku
Indicator

Ichimoku

This system maps multi-temporal price equilibrium and momentum shifts by calculating median values of high-low extremes across distinct historical horizons.

IchimokuAlert_v1
Indicator

IchimokuAlert_v1

This indicator detects bullish and bearish reversals by monitoring crossover events between the Tenkan-sen and Kijun-sen lines, as well as price intersections with the lagging Chinkou Span.

IchimokuAlert_v2
Indicator

IchimokuAlert_v2

This indicator monitors price action to trigger real-time notifications based on Tenkan-Sen and Kijun-Sen crossover events or price interaction with the medium-term equilibrium line.